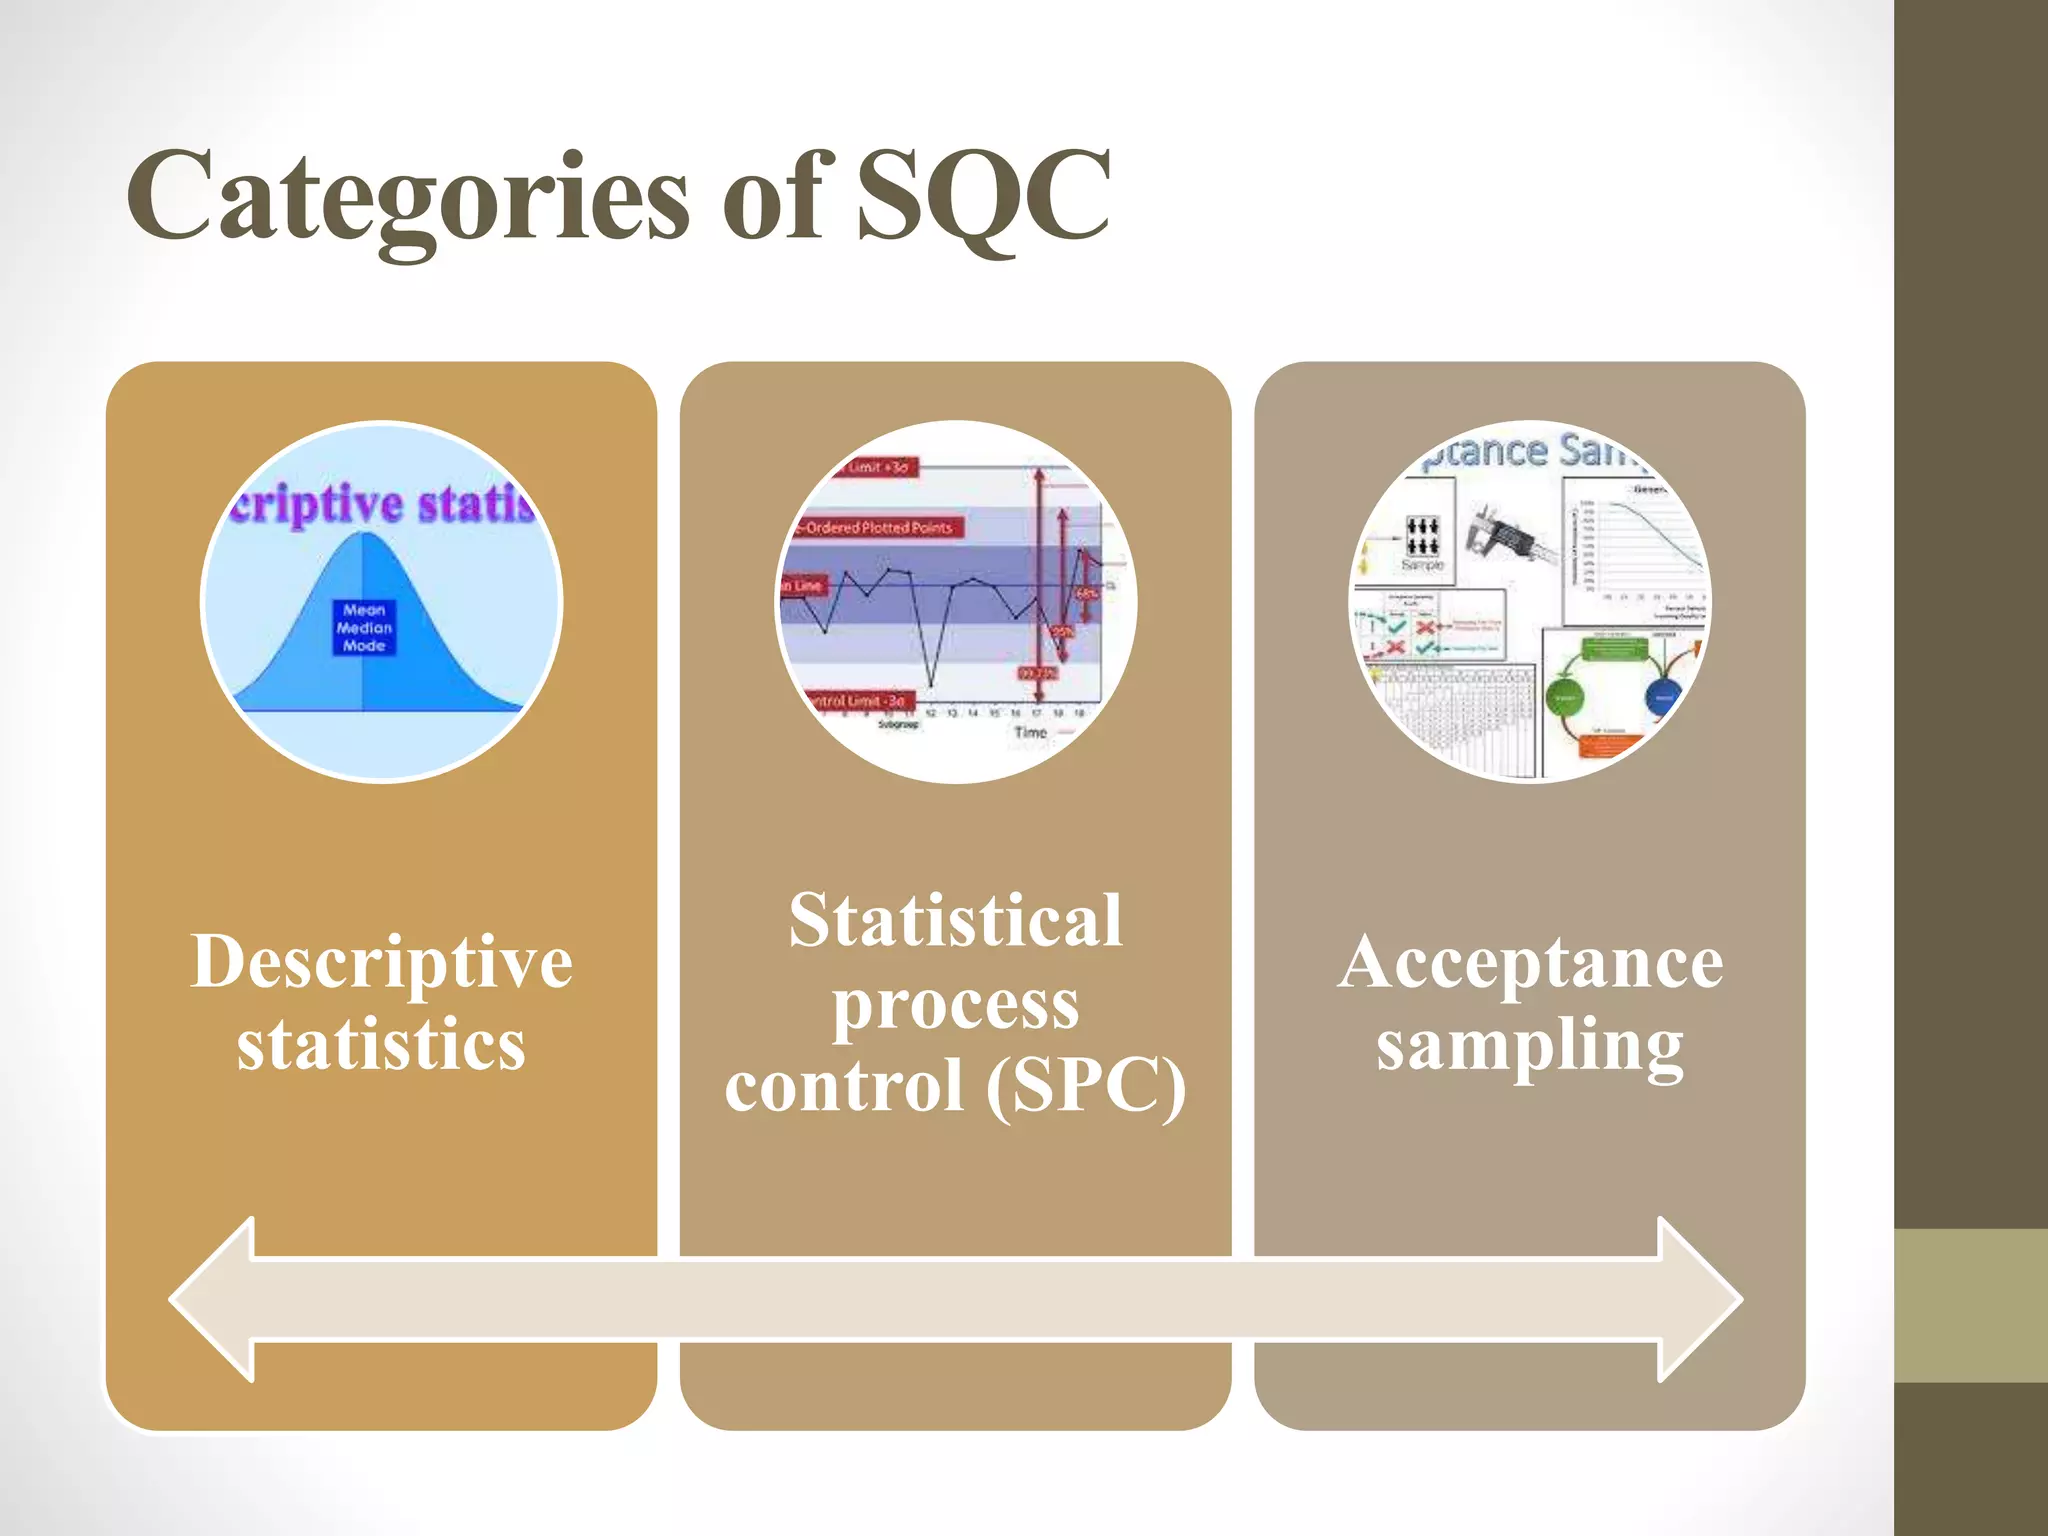
Statistical Quality control
(SQC): Concepts and overview
Dr. Pankaj Das
Mail id: pankaj.iasri@gmail.com
Background
• The goal of every operation or production system is to generate
a useful product.
• The product may be a service, information or a physical object.
• The quality built into product and process design, quality
identified problems at the source, and quality made everyone’s
responsibility is important.
• Therefore need specific tools that can help us make the right
quality decisions.
• These tools come from the area of statistics and are used to help
identify quality problems in the production process as well as in
the product itself.
Need of SQC
• In every system or process, errors or
uncertain aberrations may causes
nonconformities which hampers the quality
of produced products (outputs).
• SQC help to identify, measure and rectify
the problems.
• It also help us make the right quality
decisions.
Goals of SQC
• Elimination of nonconformities and their
consequences.
• Elimination rework and wasted resources.
• Optimization of product cost i.e. achieve the
above goals at a lowest price.
Definition
• Statistical quality control (SQC) is the term
used to describe the set of statistical tools
used by quality professionals.
• It is a general category of statistical tools
used to evaluate organizational quality.
History
• SQC was pioneered by Walter A. Shewhart at
Bell Lab in early 1920.
• Shewhart developed the control chart in 1924 and
the concept of a state of statistical control.
• Shewhart consulted with colonel Lesile E. Simon
in the application of control chart in army arsenal
in 1934.
History
• W. Edwards Deming invited Shewhart to speak at
the Graduate School of the U.S. Department of
Agriculture and served as the editor of
Shewhart's book Statistical Method from the
Viewpoint of Quality Control (1939) which was
the result of that lecture.
• Deming was an important architect of the quality
control short courses that trained American
industry in the new techniques during WWII.
History
• In 1988, the Software Engineering Institute
in Pittsburgh, Pennsylvania, United States
suggested that SPC could be applied to
non-manufacturing processes, such as
software engineering processes
Categories of SQC
Descriptive
statistics
Statistical
process
control (SPC)
Acceptance
sampling
Descriptive statistics
• Descriptive statistics are used to describe
quality characteristics and relationships
Included are statistics such as the mean,
standard deviation, the range and a
measure of the distribution of data.
Statistical process
control (SPC)
• A statistical tool that involves inspecting a
random sample of the output from a
process and deciding whether the process
is producing products with characteristics
that fall within a predetermined range.
Acceptance sampling
• The process of randomly inspecting a sample of
goods and deciding whether to accept the entire
lot based on the results.
• The tools in each of these categories provide
different types of information for use in
analyzing quality.
Variation in quality
Variation denotes the no similarity in product
or its characteristics.
For example, when a chipmaking machine
was found to be a few feet longer at one
facility than another.
Variation in the production process leads to
quality defects and lack of product
consistency.
Sources of Variations
• Common causes of variation: Random causes
that cannot be identified.
Example: Difference in the average liquid content
in a bottle of a soft drink.
• Assignable causes of variation: Causes that can
be identified and eliminated.
Example: Poor quality in raw materials, an
employee who needs more training, or a machine in
need of repair
15
Types of Data
• Variable data
• Product characteristic that can be measured
Examples: Length, size, weight, height, time, velocity
• Attribute data
• Product characteristic evaluated with a discrete choice
Examples: Good/bad, yes/no
16
Topics that need to recall for
upcoming class
1. Descriptive statistics: mean, mode, range, Standard
Deviation, Standard error, Shape of Distributions.
2. Normal distribution and its properties
3. Confidence intervals, Control limits
4. Concept of sampling
17

Statistical quality control introduction

  • 1.
    Statistical Quality control (SQC):Concepts and overview Dr. Pankaj Das Mail id: pankaj.iasri@gmail.com
  • 2.
    Background • The goalof every operation or production system is to generate a useful product. • The product may be a service, information or a physical object. • The quality built into product and process design, quality identified problems at the source, and quality made everyone’s responsibility is important. • Therefore need specific tools that can help us make the right quality decisions. • These tools come from the area of statistics and are used to help identify quality problems in the production process as well as in the product itself.
  • 3.
    Need of SQC •In every system or process, errors or uncertain aberrations may causes nonconformities which hampers the quality of produced products (outputs). • SQC help to identify, measure and rectify the problems. • It also help us make the right quality decisions.
  • 4.
    Goals of SQC •Elimination of nonconformities and their consequences. • Elimination rework and wasted resources. • Optimization of product cost i.e. achieve the above goals at a lowest price.
  • 5.
    Definition • Statistical qualitycontrol (SQC) is the term used to describe the set of statistical tools used by quality professionals. • It is a general category of statistical tools used to evaluate organizational quality.
  • 6.
    History • SQC waspioneered by Walter A. Shewhart at Bell Lab in early 1920. • Shewhart developed the control chart in 1924 and the concept of a state of statistical control. • Shewhart consulted with colonel Lesile E. Simon in the application of control chart in army arsenal in 1934.
  • 7.
    History • W. EdwardsDeming invited Shewhart to speak at the Graduate School of the U.S. Department of Agriculture and served as the editor of Shewhart's book Statistical Method from the Viewpoint of Quality Control (1939) which was the result of that lecture. • Deming was an important architect of the quality control short courses that trained American industry in the new techniques during WWII.
  • 8.
    History • In 1988,the Software Engineering Institute in Pittsburgh, Pennsylvania, United States suggested that SPC could be applied to non-manufacturing processes, such as software engineering processes
  • 9.
  • 10.
    Descriptive statistics • Descriptivestatistics are used to describe quality characteristics and relationships Included are statistics such as the mean, standard deviation, the range and a measure of the distribution of data.
  • 11.
    Statistical process control (SPC) •A statistical tool that involves inspecting a random sample of the output from a process and deciding whether the process is producing products with characteristics that fall within a predetermined range.
  • 12.
    Acceptance sampling • Theprocess of randomly inspecting a sample of goods and deciding whether to accept the entire lot based on the results. • The tools in each of these categories provide different types of information for use in analyzing quality.
  • 13.
    Variation in quality Variationdenotes the no similarity in product or its characteristics. For example, when a chipmaking machine was found to be a few feet longer at one facility than another. Variation in the production process leads to quality defects and lack of product consistency.
  • 14.
    Sources of Variations •Common causes of variation: Random causes that cannot be identified. Example: Difference in the average liquid content in a bottle of a soft drink. • Assignable causes of variation: Causes that can be identified and eliminated. Example: Poor quality in raw materials, an employee who needs more training, or a machine in need of repair
  • 15.
    15 Types of Data •Variable data • Product characteristic that can be measured Examples: Length, size, weight, height, time, velocity • Attribute data • Product characteristic evaluated with a discrete choice Examples: Good/bad, yes/no
  • 16.
    16 Topics that needto recall for upcoming class 1. Descriptive statistics: mean, mode, range, Standard Deviation, Standard error, Shape of Distributions. 2. Normal distribution and its properties 3. Confidence intervals, Control limits 4. Concept of sampling
  • 17.