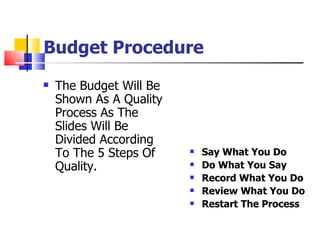
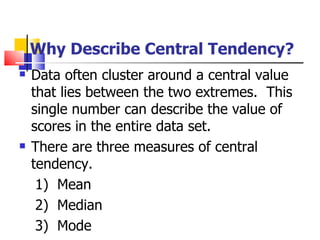
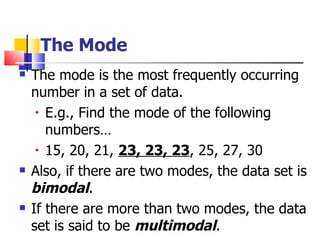
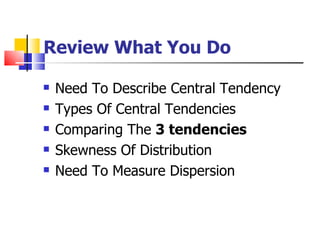
March 2012


   Statistcal
   methods
Budget Procedure
   The Budget Will Be
    Shown As A Quality
    Process As The
    Slides Will Be
    Divided According
    To The 5 Steps Of       Say What You Do
    Quality.                Do What You Say
                            Record What You Do
                            Review What You Do
                            Restart The Process
Say What You Do (Contents)
The Budget Shall Consist The Following
 Parameters
   Need To Describe Central Tendency
   Types Of Central Tendencies
   Comparing The 3 tendencies
   Skewness Of Distribution
   Need To Measure Dispersion
Do What You Say &
Record What You Do

    Both Steps Are Collaborated
Because recording of the Processes
 shall be done side by side so as to
   find the mistakes ASAP………
 And Here We Present The Budget
Why Describe Central Tendency?
   Data often cluster around a central value
    that lies between the two extremes. This
    single number can describe the value of
    scores in the entire data set.
   There are three measures of central
    tendency.
     1) Mean
     2) Median
     3) Mode
The Mode
   The mode is the most frequently occurring
    number in a set of data.
     • E.g., Find the mode of the following

       numbers…
     • 15, 20, 21, 23, 23, 23, 25, 27, 30

   Also, if there are two modes, the data set is
    bimodal.
   If there are more than two modes, the data
    set is said to be multimodal.
The Median
   The middle score when all scores in the
    data set are arranged in order.
   Half the scores lie above and half lie
    below the median.
   E.g., Find the median of the following
    numbers…
      10, 12, 14, 15, 17, 18, 20.
   When there are an even number of
    scores, you must take the average of the
    middle two scores.


         Eg., 10, 12, 14, 15, 17, 18
         (14 + 15)/2 = 14.5.
   The median can also be calculated from a
     frequency distribution.
    E.g., A stats class received the following
     marks out of 20 on their first exam.
X        freq Cumulative
freq
20        1      15
19        2      14
16        2      12
14        1      10 What is the median grade?
12        4       9
11        2       5
10        3       3
   Step 1 - Multiply 0.5 times N + 1 to obtain
    the location of the middle frequency.
       0.5(15 + 1) = 8
   Step 2 - Locate this score on your
    frequency distribution.
       12
The Mean
   This is the sum of all the scores data set
    divided by the number of scores in the set.
                 E.g., What’s the mean of the
       ∑x        following test scores?
x    =

        n        56, 65, 75, 83, 92

                  x = 371/5 = 74.2
   The mean can also be calculated using a
    frequency distribution.
   The following scores were obtained on a
    stats exam marked out of 20.
    X       freq
    20       1
    19       2
    16       2
                 Find the mean of the exam
    14       1
    12       4 scores.
    11       2
    10       3
   Multiply each score by the frequency. Add
    them together and divide by N

X         freq       fX
20         1         20       X = X fX/N
19         2         38
16         2         32
14         1         14         = 204/15
12         4         48
11         2         22         = 13.6
10         3         30
     N = 15      NfX = 204
Characteristics of the Mean
   Summed deviations about the mean equal 0.


Score             X-X
  2               2 - 5 = -3
  3               3 - 5 = -2
  5               5-5=0
  7               7-5=2
__8__             8-5=3
_    X = 25       8 (x - x) = 0
X=5
   The mean is sensitive to extreme scores.

    Score        Score        Note, the median
      2            2          remains the same in
      3            3
                              both cases.
      5            5
      7            7
    __8__        __33__
    _   X = 25   _   X = 50

    X=5          X = 10
   The sum of squared deviations is least
    about the mean


         Score          (X - X)2
           2            (2 - 5)2 = 9
           3            (3 - 5)2 = 4
           5            (5 - 5)2 = 0
           7            (7 - 5)2 = 4
         __8__          (8 - 5)2 = 9
         _   X = 25     (x - x)2 =
                      26
         X=5
Comparison of the Mean,
Median, and Mode
   The mode is the roughest measure of
    central tendency and is rarely used in
    behavioral statistics.
   Mean and median are generally more
    appropriate.
   If a distribution is skewed, the mean is
    pulled in the direction of the skew. In
    such cases, the median is a better
    measure of central tendency.
Skewness of Distribution
  Comparing the mean and the median
  Normal                        Negative
                Positive Skew    Skew
Distribution


 Mean &        Median   Mean    Mean   Median
Median the
  same
Why Measure Dispersion?
   Measures of dispersion tell us how spread
    out the scores in a data set are. Surely all
    scores will not be equal to the mean.
   There are four measures of dispersion we
    will look at:
     • Range (crude range)

     • Standard Deviation
The Range
    The simplest measure of variability.
     Simply the highest score minus the lowest
     score.
    Limited by extreme scores or outliers.

E.g., Find the range in the following test scores.
      100, 74, 68, 68, 57, 56

      Range = H - L = 100 - 56 = 44
The Variance
   The sum of the squared deviations from
    the mean divided by N.


                       ∑ (x - x)
                               2

           s   2
                   =
                         N
Calculating Variance (Deviation Formula)
        X                       X-X               (X -
X)2
       12                          3                  9
       11                          2                  4
       10                          1                  1
        9                          0                  0
        9                          0                  0
        9                          0                  0
        8                         -1                  1
        7                         -2                  4
        6                         -3                  9
      ∑ x = 81             ∑ (x - x) = 0   ∑ (x - x)2 =
      28
         x=9
      S2 = ∑ (x - x)2 = 28 = 3.11
             n         9
Calculating Standard
Deviation
   Simply calculate the square root of the
    variance.

   So if s2 from the previous example was
    3.11, the standard deviation (denoted
    by s) is 1.76.
Calculating the Variance and/or
Standard Deviation

           Formulae:

        Variance:                 Standard Deviation:


s   2
        =
          ∑( X − X ) i
                         2
                             s=
                                      ∑( X − X )  i
                                                      2


                N                           N

        Examples Are As Follows
Example:
       Data: X = {6, 10, 5, 4, 9, 8};             N=6
                                     Mean:
     X       X−X     (X − X )    2


                                     X=
                                        ∑X    =
                                                  42
                                                     =7
   6          -1         1               N        6
   10          3
               3         9           Variance:
    5         -2         4            S2 = ∑ (x - x)2 = 28 = 4.67
                                             n         6
    4         -3         9
    9          2
               2         4           Standard Deviation:
    8          1
               1         1            s = s 2 = 4.67 = 2.16
Total: 42            Total: 28
Review What You Do

   Need To Describe Central Tendency
   Types Of Central Tendencies
   Comparing The 3 tendencies
   Skewness Of Distribution
   Need To Measure Dispersion
Do We Pass The Quality Test?

        No Or Yes
Quality Not Achieved

Please tell where we lacked and
          were wrong.
The Process Shall Start
Again
Budget Ends
Quality Achieved
Budget Ends
Statistical methods

Statistical methods

  • 1.
    March 2012 Statistcal methods
  • 2.
    Budget Procedure  The Budget Will Be Shown As A Quality Process As The Slides Will Be Divided According To The 5 Steps Of  Say What You Do Quality.  Do What You Say  Record What You Do  Review What You Do  Restart The Process
  • 3.
    Say What YouDo (Contents) The Budget Shall Consist The Following Parameters  Need To Describe Central Tendency  Types Of Central Tendencies  Comparing The 3 tendencies  Skewness Of Distribution  Need To Measure Dispersion
  • 4.
    Do What YouSay & Record What You Do Both Steps Are Collaborated Because recording of the Processes shall be done side by side so as to find the mistakes ASAP……… And Here We Present The Budget
  • 5.
    Why Describe CentralTendency?  Data often cluster around a central value that lies between the two extremes. This single number can describe the value of scores in the entire data set.  There are three measures of central tendency. 1) Mean 2) Median 3) Mode
  • 6.
    The Mode  The mode is the most frequently occurring number in a set of data. • E.g., Find the mode of the following numbers… • 15, 20, 21, 23, 23, 23, 25, 27, 30  Also, if there are two modes, the data set is bimodal.  If there are more than two modes, the data set is said to be multimodal.
  • 7.
    The Median  The middle score when all scores in the data set are arranged in order.  Half the scores lie above and half lie below the median.  E.g., Find the median of the following numbers… 10, 12, 14, 15, 17, 18, 20.
  • 8.
    When there are an even number of scores, you must take the average of the middle two scores. Eg., 10, 12, 14, 15, 17, 18 (14 + 15)/2 = 14.5.
  • 9.
    The median can also be calculated from a frequency distribution.  E.g., A stats class received the following marks out of 20 on their first exam. X freq Cumulative freq 20 1 15 19 2 14 16 2 12 14 1 10 What is the median grade? 12 4 9 11 2 5 10 3 3
  • 10.
    Step 1 - Multiply 0.5 times N + 1 to obtain the location of the middle frequency. 0.5(15 + 1) = 8  Step 2 - Locate this score on your frequency distribution. 12
  • 11.
    The Mean  This is the sum of all the scores data set divided by the number of scores in the set. E.g., What’s the mean of the ∑x following test scores? x = n 56, 65, 75, 83, 92 x = 371/5 = 74.2
  • 12.
    The mean can also be calculated using a frequency distribution.  The following scores were obtained on a stats exam marked out of 20. X freq 20 1 19 2 16 2 Find the mean of the exam 14 1 12 4 scores. 11 2 10 3
  • 13.
    Multiply each score by the frequency. Add them together and divide by N X freq fX 20 1 20 X = X fX/N 19 2 38 16 2 32 14 1 14 = 204/15 12 4 48 11 2 22 = 13.6 10 3 30 N = 15 NfX = 204
  • 14.
    Characteristics of theMean  Summed deviations about the mean equal 0. Score X-X 2 2 - 5 = -3 3 3 - 5 = -2 5 5-5=0 7 7-5=2 __8__ 8-5=3 _ X = 25 8 (x - x) = 0 X=5
  • 15.
    The mean is sensitive to extreme scores. Score Score Note, the median 2 2 remains the same in 3 3 both cases. 5 5 7 7 __8__ __33__ _ X = 25 _ X = 50 X=5 X = 10
  • 16.
    The sum of squared deviations is least about the mean Score (X - X)2 2 (2 - 5)2 = 9 3 (3 - 5)2 = 4 5 (5 - 5)2 = 0 7 (7 - 5)2 = 4 __8__ (8 - 5)2 = 9 _ X = 25 (x - x)2 = 26 X=5
  • 17.
    Comparison of theMean, Median, and Mode  The mode is the roughest measure of central tendency and is rarely used in behavioral statistics.  Mean and median are generally more appropriate.  If a distribution is skewed, the mean is pulled in the direction of the skew. In such cases, the median is a better measure of central tendency.
  • 18.
    Skewness of Distribution  Comparing the mean and the median Normal Negative Positive Skew Skew Distribution Mean & Median Mean Mean Median Median the same
  • 19.
    Why Measure Dispersion?  Measures of dispersion tell us how spread out the scores in a data set are. Surely all scores will not be equal to the mean.  There are four measures of dispersion we will look at: • Range (crude range) • Standard Deviation
  • 20.
    The Range  The simplest measure of variability. Simply the highest score minus the lowest score.  Limited by extreme scores or outliers. E.g., Find the range in the following test scores. 100, 74, 68, 68, 57, 56 Range = H - L = 100 - 56 = 44
  • 21.
    The Variance  The sum of the squared deviations from the mean divided by N. ∑ (x - x) 2 s 2 = N
  • 22.
    Calculating Variance (DeviationFormula) X X-X (X - X)2 12 3 9 11 2 4 10 1 1 9 0 0 9 0 0 9 0 0 8 -1 1 7 -2 4 6 -3 9 ∑ x = 81 ∑ (x - x) = 0 ∑ (x - x)2 = 28 x=9 S2 = ∑ (x - x)2 = 28 = 3.11 n 9
  • 23.
    Calculating Standard Deviation  Simply calculate the square root of the variance.  So if s2 from the previous example was 3.11, the standard deviation (denoted by s) is 1.76.
  • 24.
    Calculating the Varianceand/or Standard Deviation Formulae: Variance: Standard Deviation: s 2 = ∑( X − X ) i 2 s= ∑( X − X ) i 2 N N Examples Are As Follows
  • 25.
    Example: Data: X = {6, 10, 5, 4, 9, 8}; N=6 Mean: X X−X (X − X ) 2 X= ∑X = 42 =7 6 -1 1 N 6 10 3 3 9 Variance: 5 -2 4 S2 = ∑ (x - x)2 = 28 = 4.67 n 6 4 -3 9 9 2 2 4 Standard Deviation: 8 1 1 1 s = s 2 = 4.67 = 2.16 Total: 42 Total: 28
  • 26.
    Review What YouDo  Need To Describe Central Tendency  Types Of Central Tendencies  Comparing The 3 tendencies  Skewness Of Distribution  Need To Measure Dispersion
  • 27.
    Do We PassThe Quality Test? No Or Yes
  • 28.
    Quality Not Achieved Pleasetell where we lacked and were wrong.
  • 29.
    The Process ShallStart Again
  • 30.
  • 32.
  • 33.