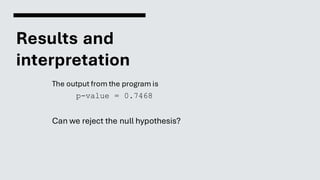
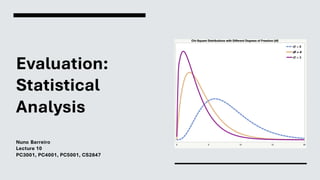
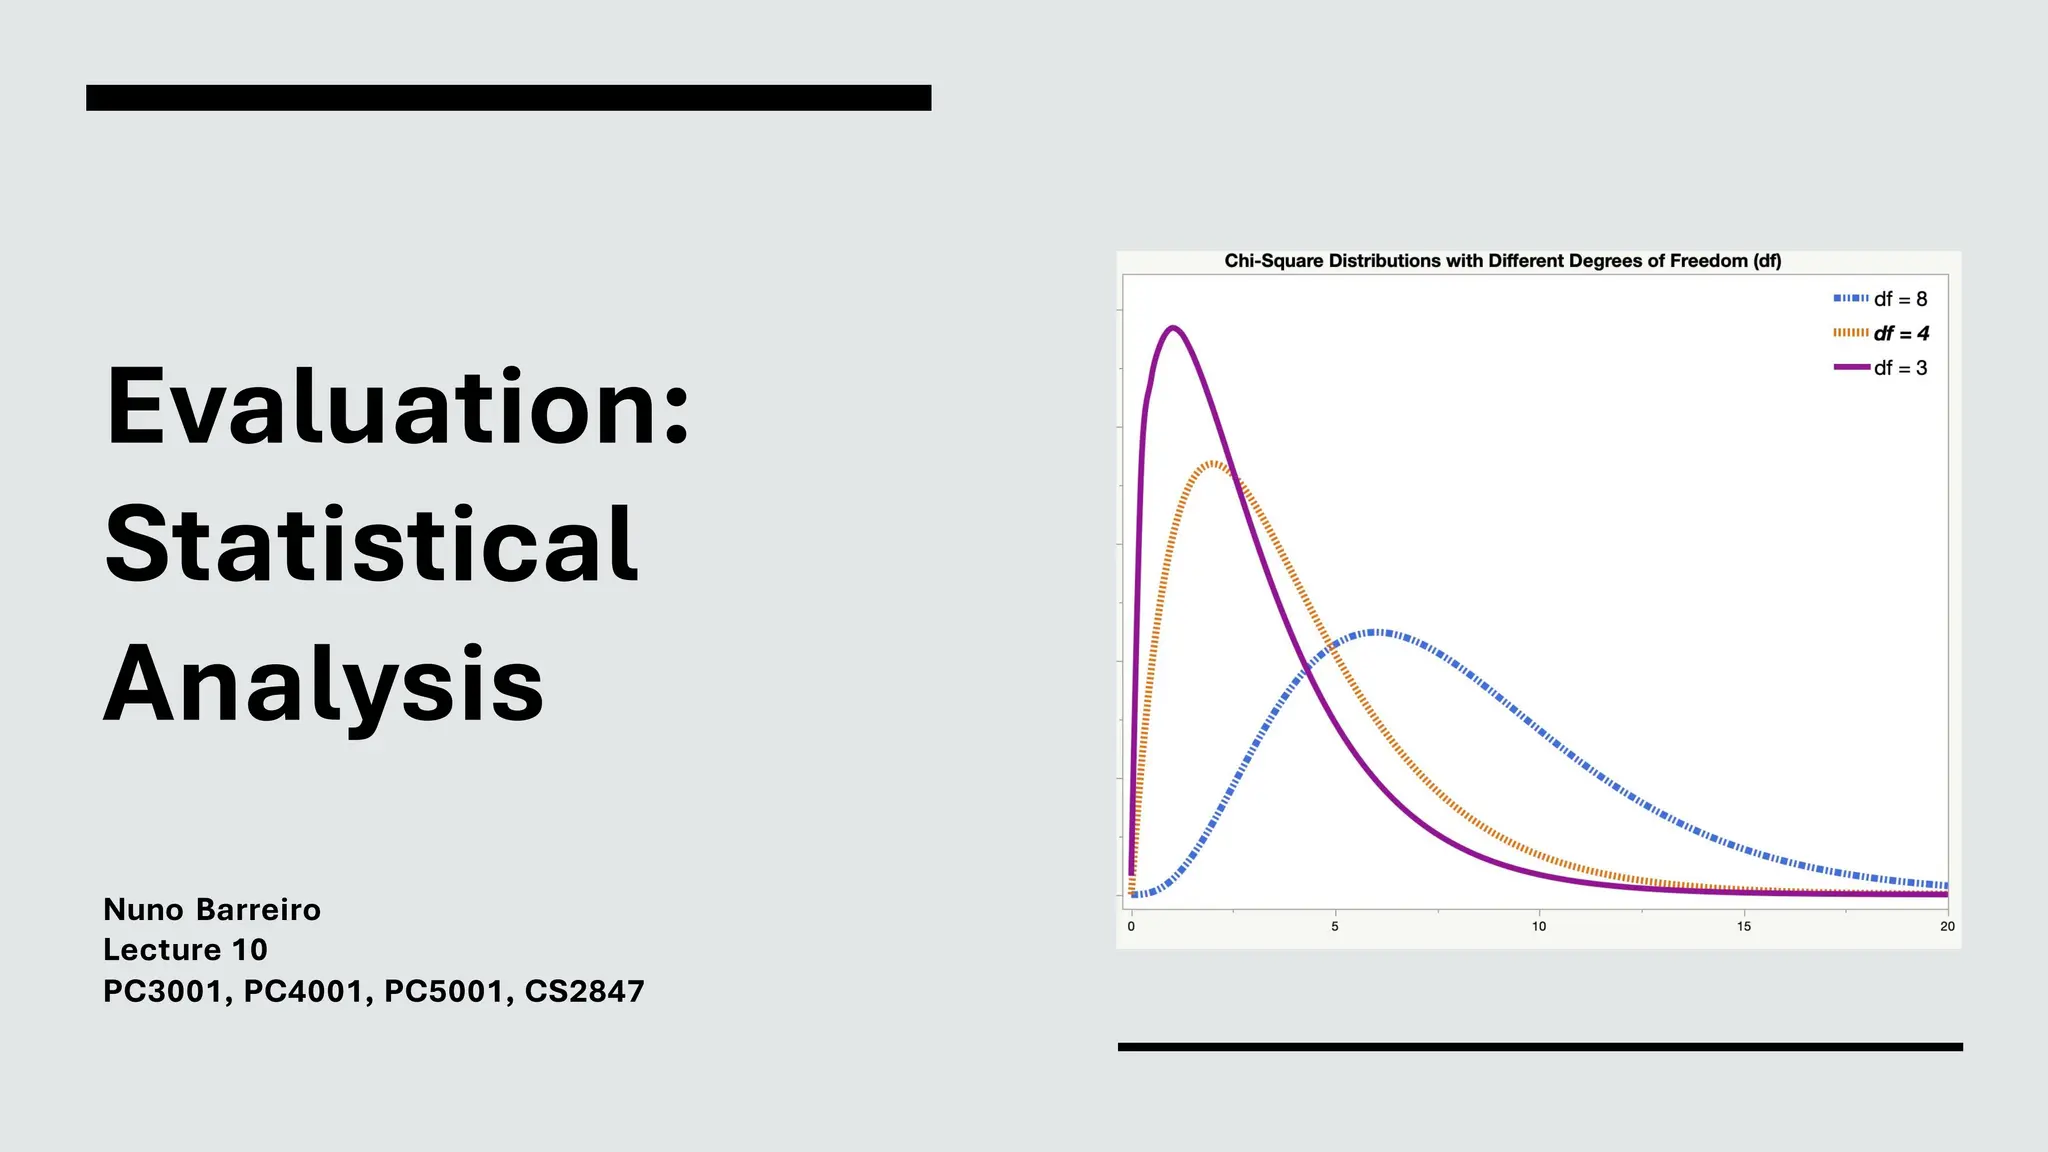
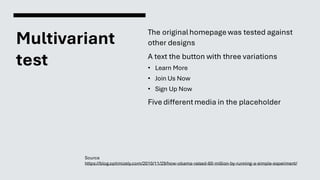
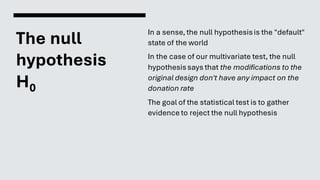
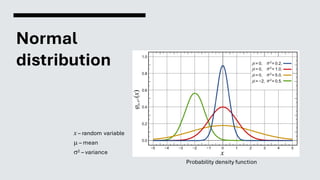
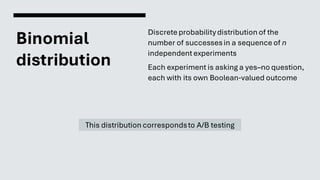
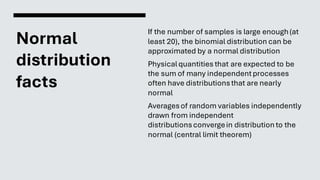
The document discusses a statistical analysis of Barack Obama's 2008 homepage, focusing on multivariate testing to measure the impact of design variations on donation conversion rates, revealing a potential increase of $60 million. It outlines the use of statistical tests, such as the chi-squared (χ2) test and t-test, to evaluate the significance of results in relation to the null hypothesis. Finally, it emphasizes the importance of using appropriate statistical methods to ensure meaningful interpretations of the data.

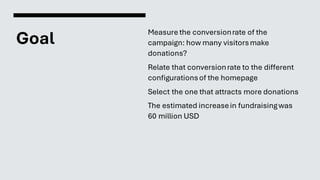


![2 test in Python
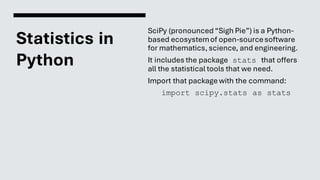
import scipy.stats as stats
a = [5851, 72007]
b = [6927, 70802]
c = [5915, 71729]
d = [5660, 71491]
obs = [a, b, c, d]
chi2, pValue, dof, expected =
stats.chi2_contingency(obs)
print 'p-value =', pValue
http://docs.scipy.org/doc/scipy/reference/generated/scipy.stats.chi2_contingency.html
Done directly with the contingency table
No donat. Donation
5851 72007
6927 70802
5915 71729
5660 71491](https://image.slidesharecdn.com/10-statisticalanalysis-240103233424-a84aeec5/85/Statistical-Analysis-29-320.jpg)
![Two-sided t test in
Python
import scipy.stats as stats
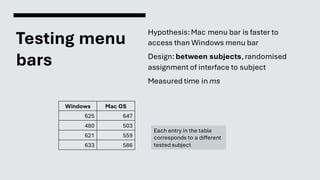
a = [625, 480, 621, 633]
b = [647, 503, 559, 586]
tStatistic, pValue = stats.ttest_ind(a,b)
print 'p-value =', pValue
http://docs.scipy.org/doc/scipy/reference/generated/scipy.stats.ttest_ind.html
Windows Mac OS
625 647
480 503
621 559
633 586](https://image.slidesharecdn.com/10-statisticalanalysis-240103233424-a84aeec5/85/Statistical-Analysis-35-320.jpg)