Downloaded 1,609 times
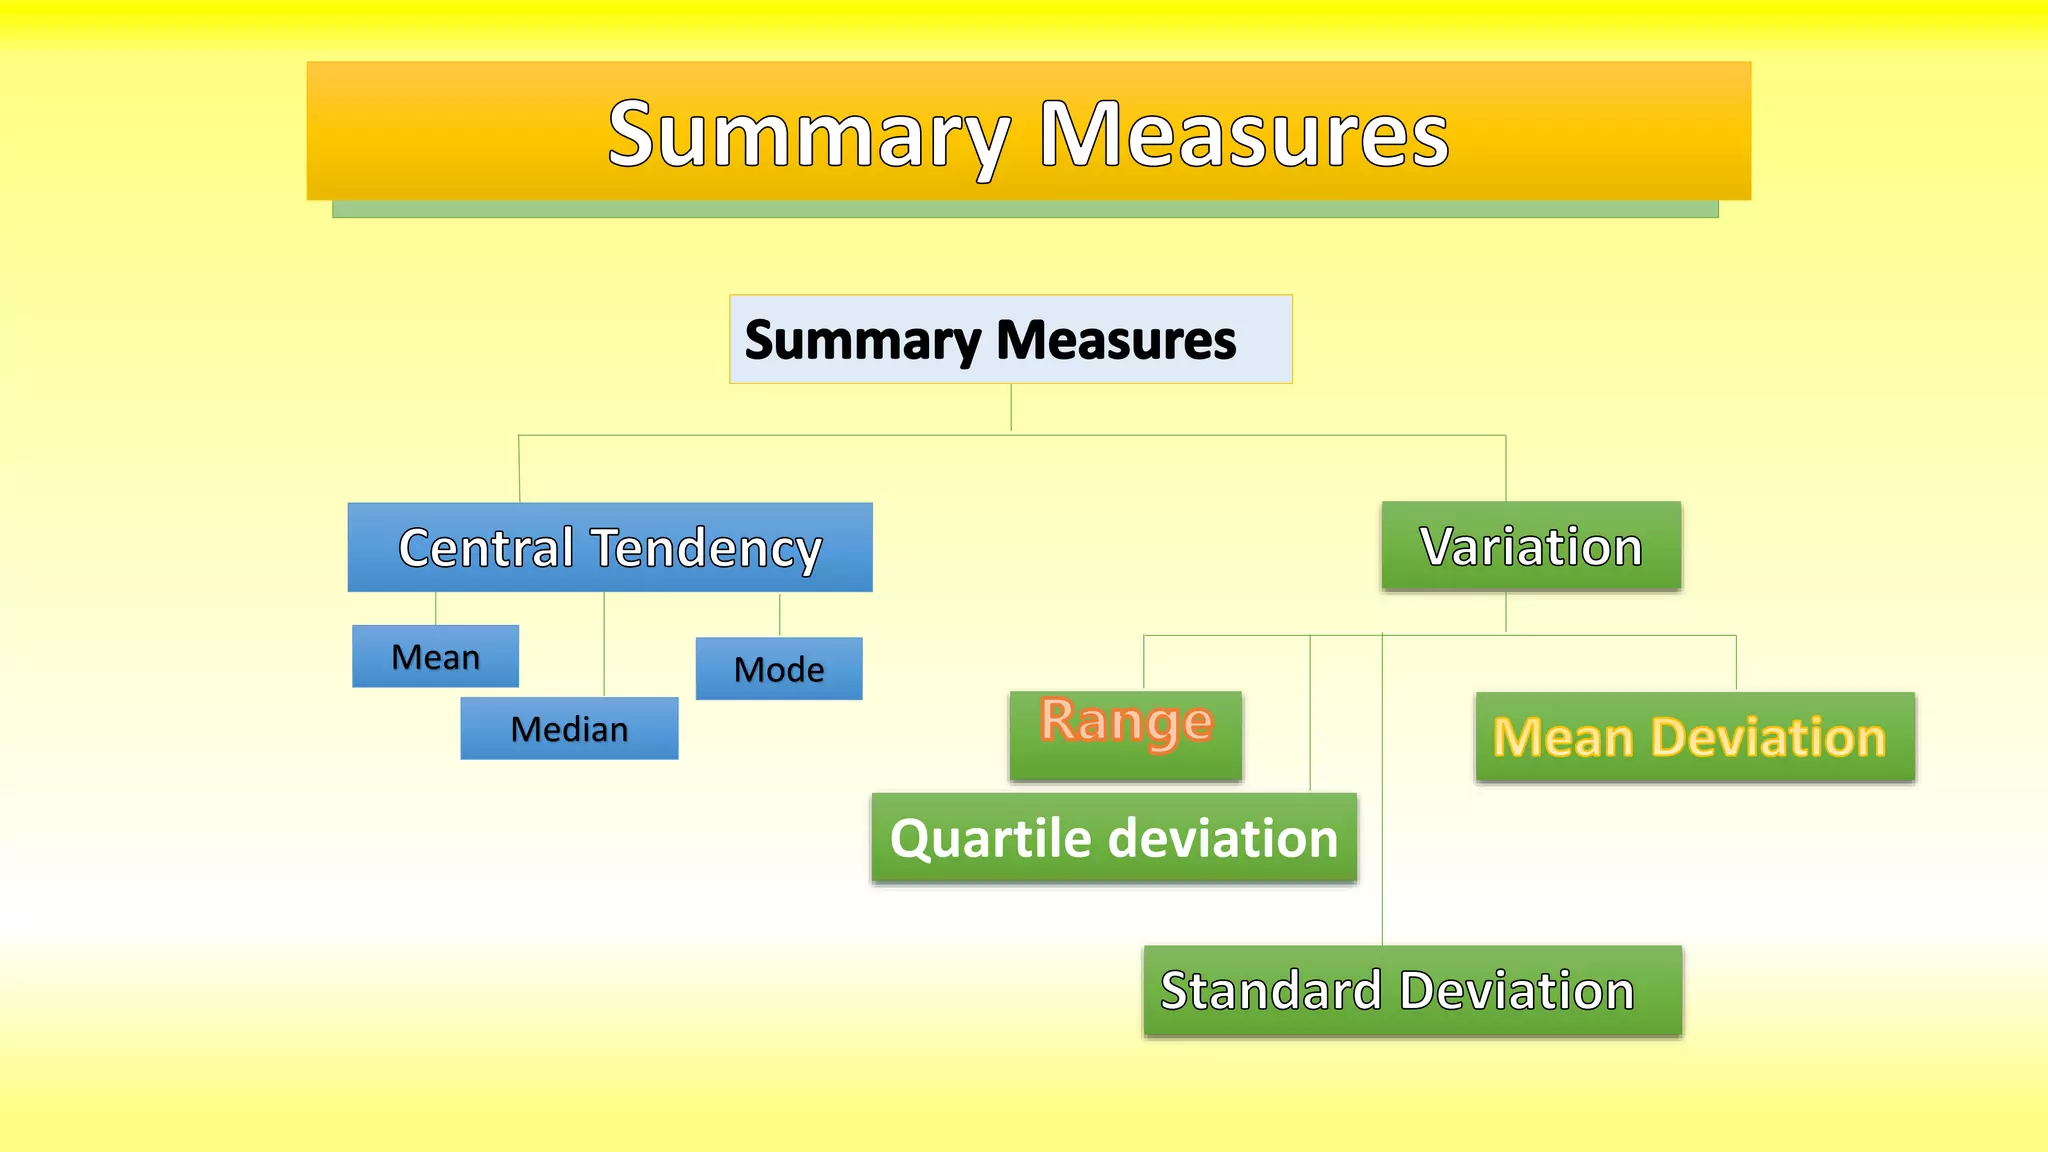
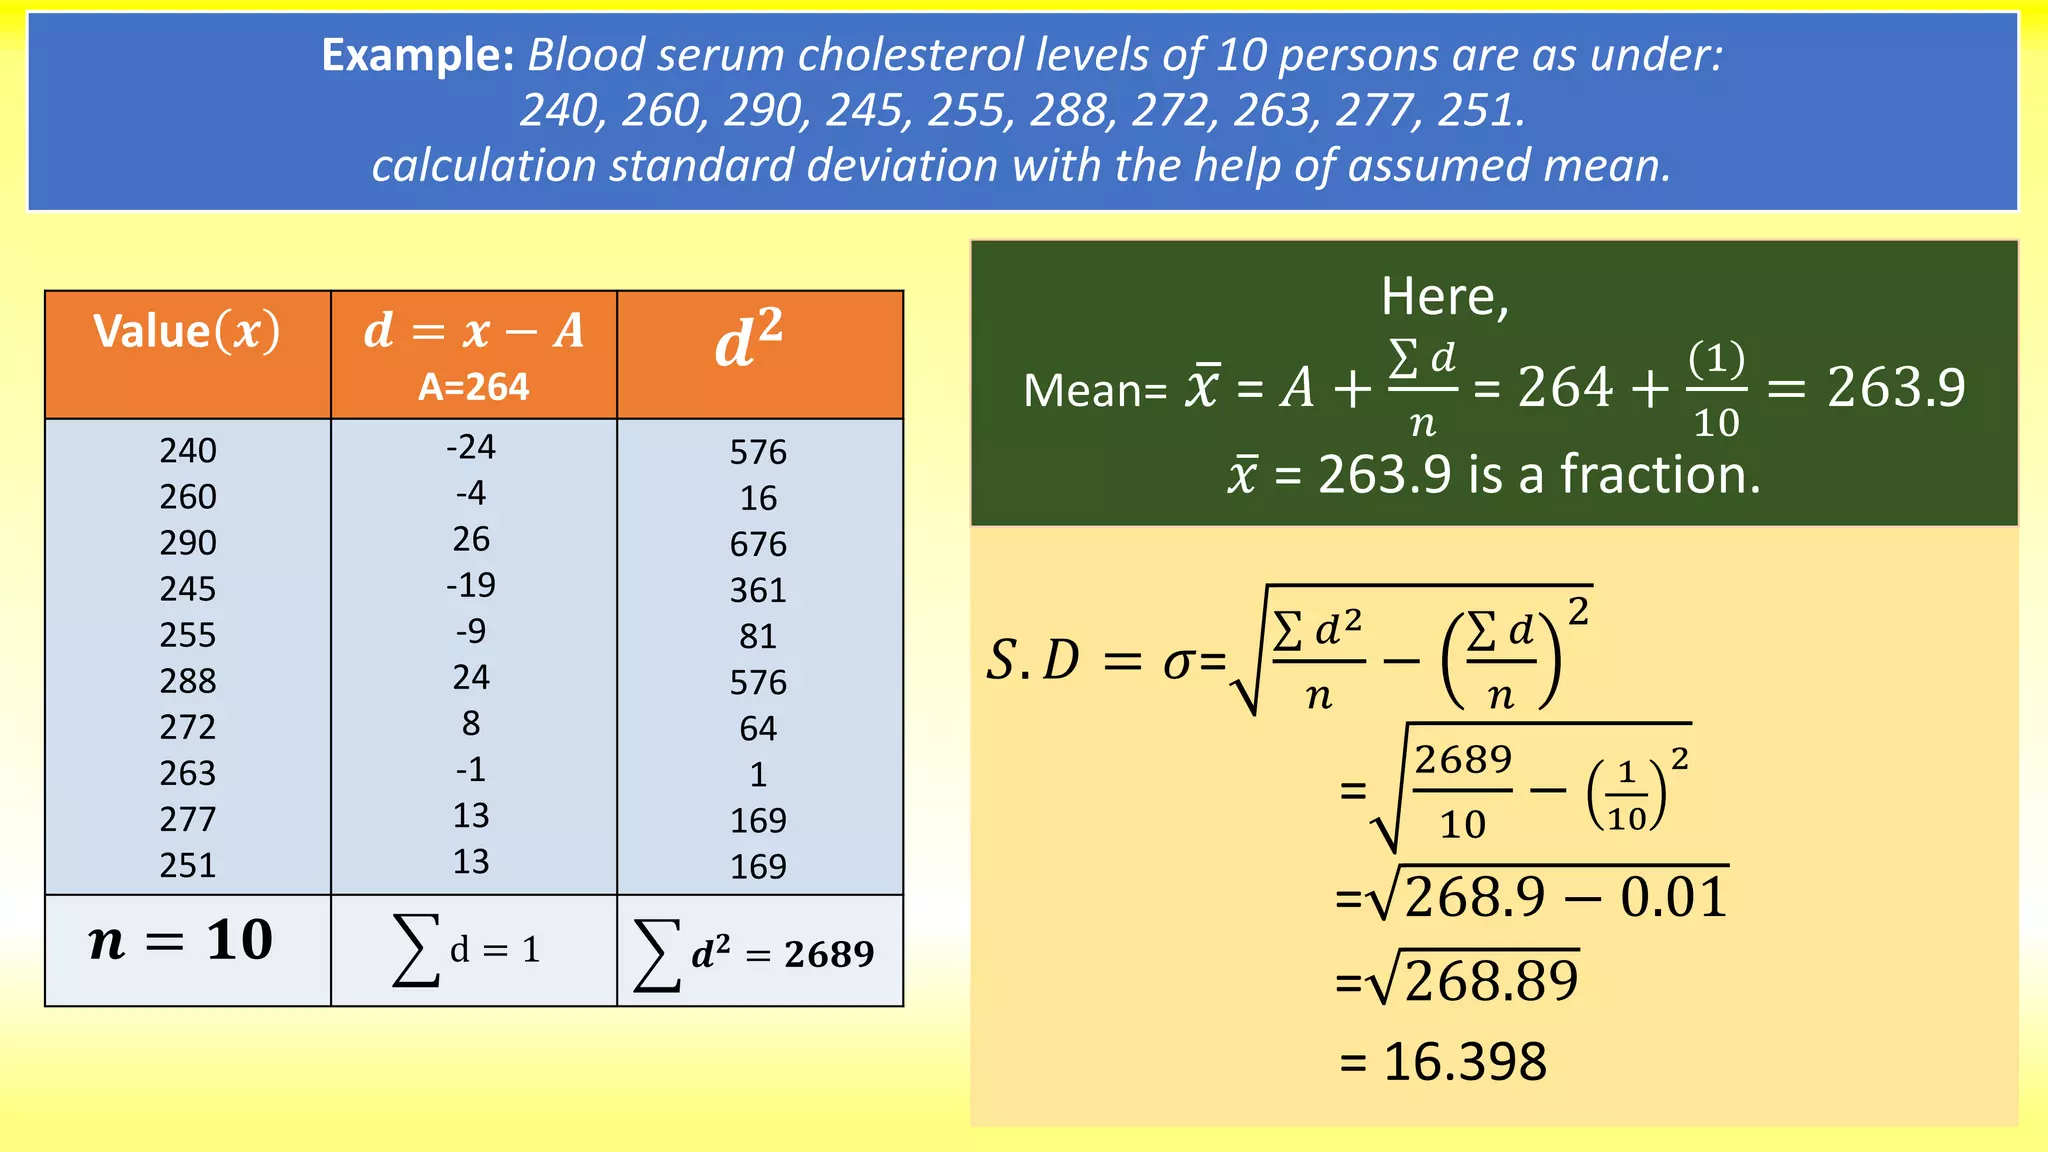
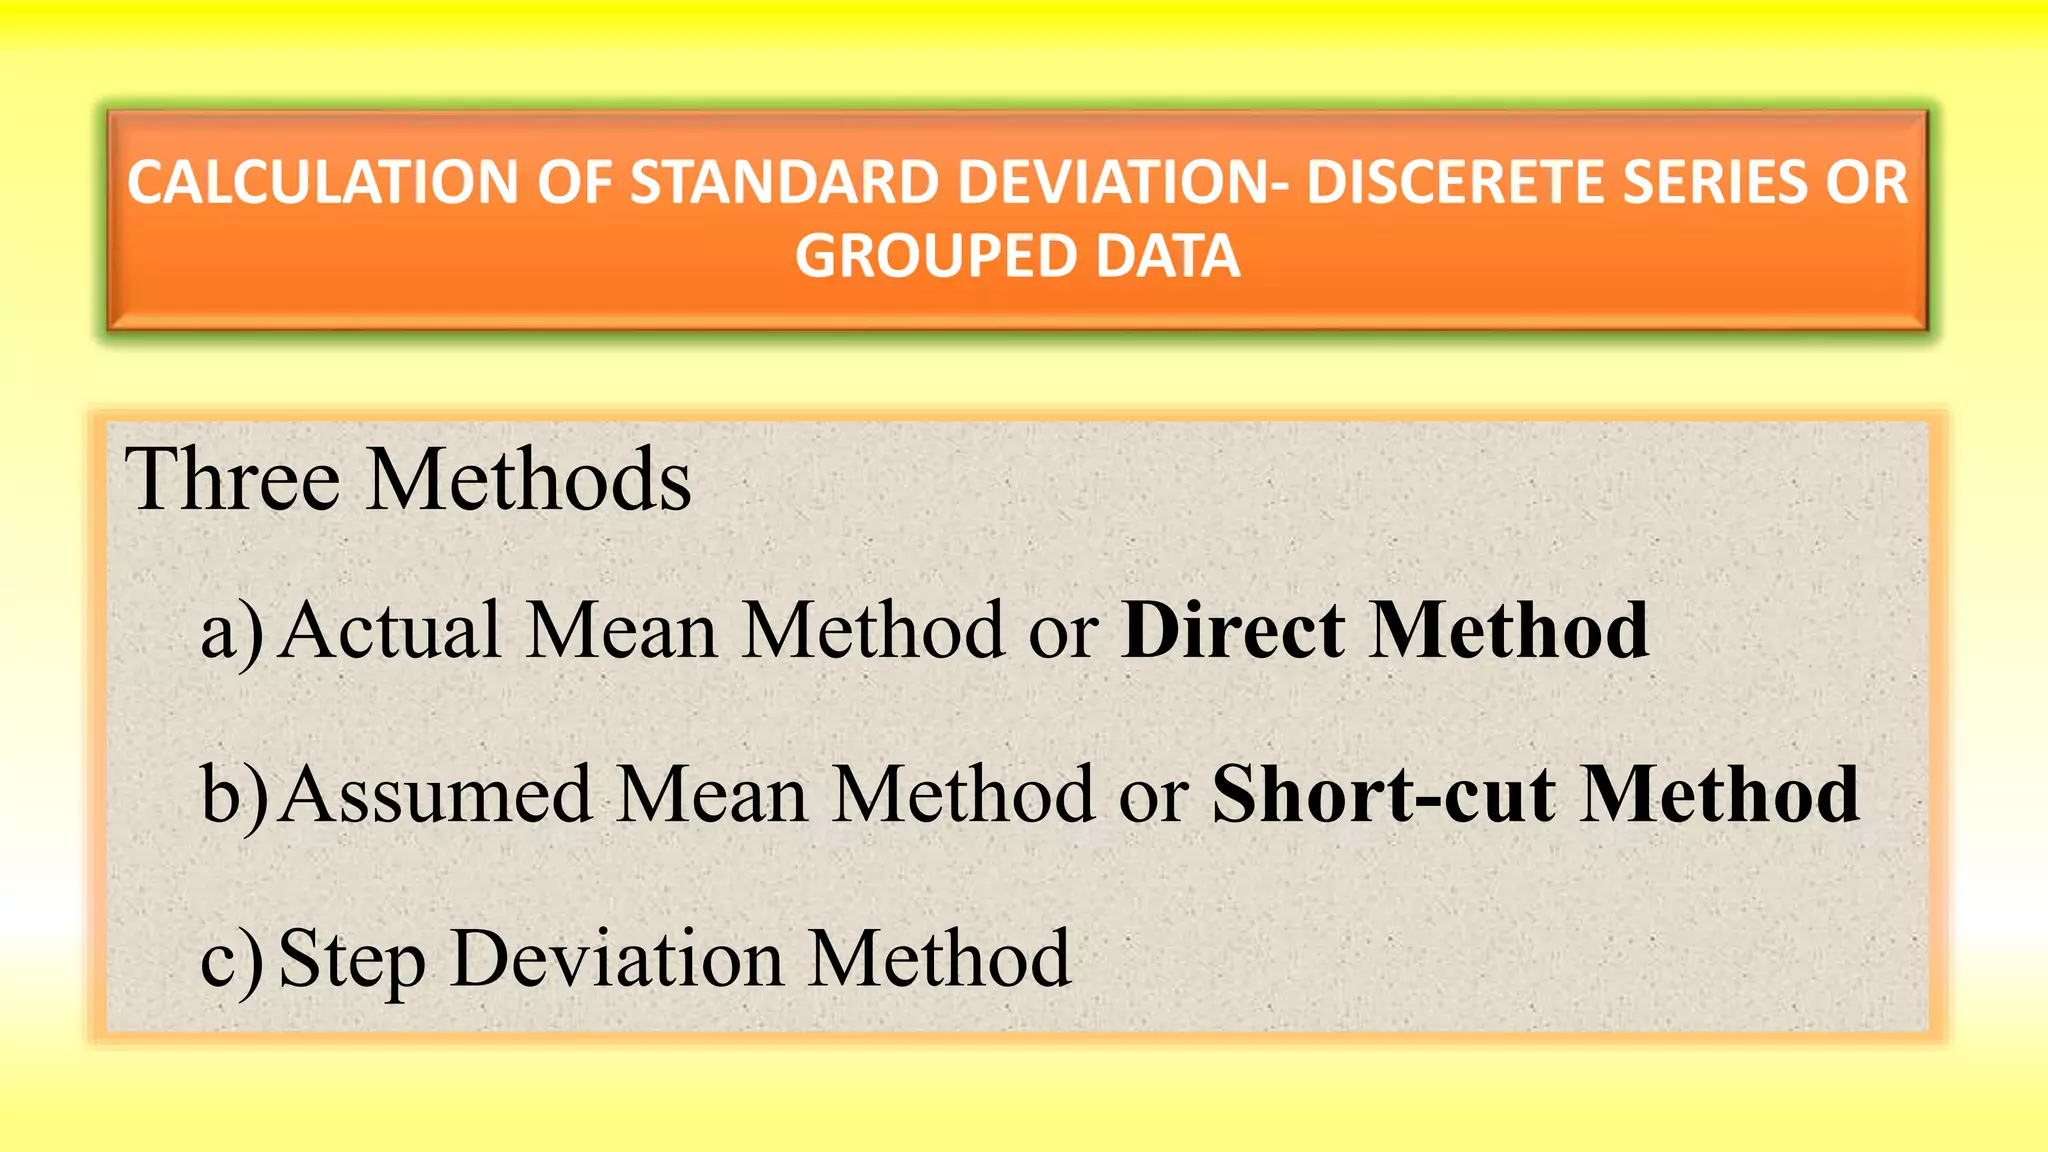
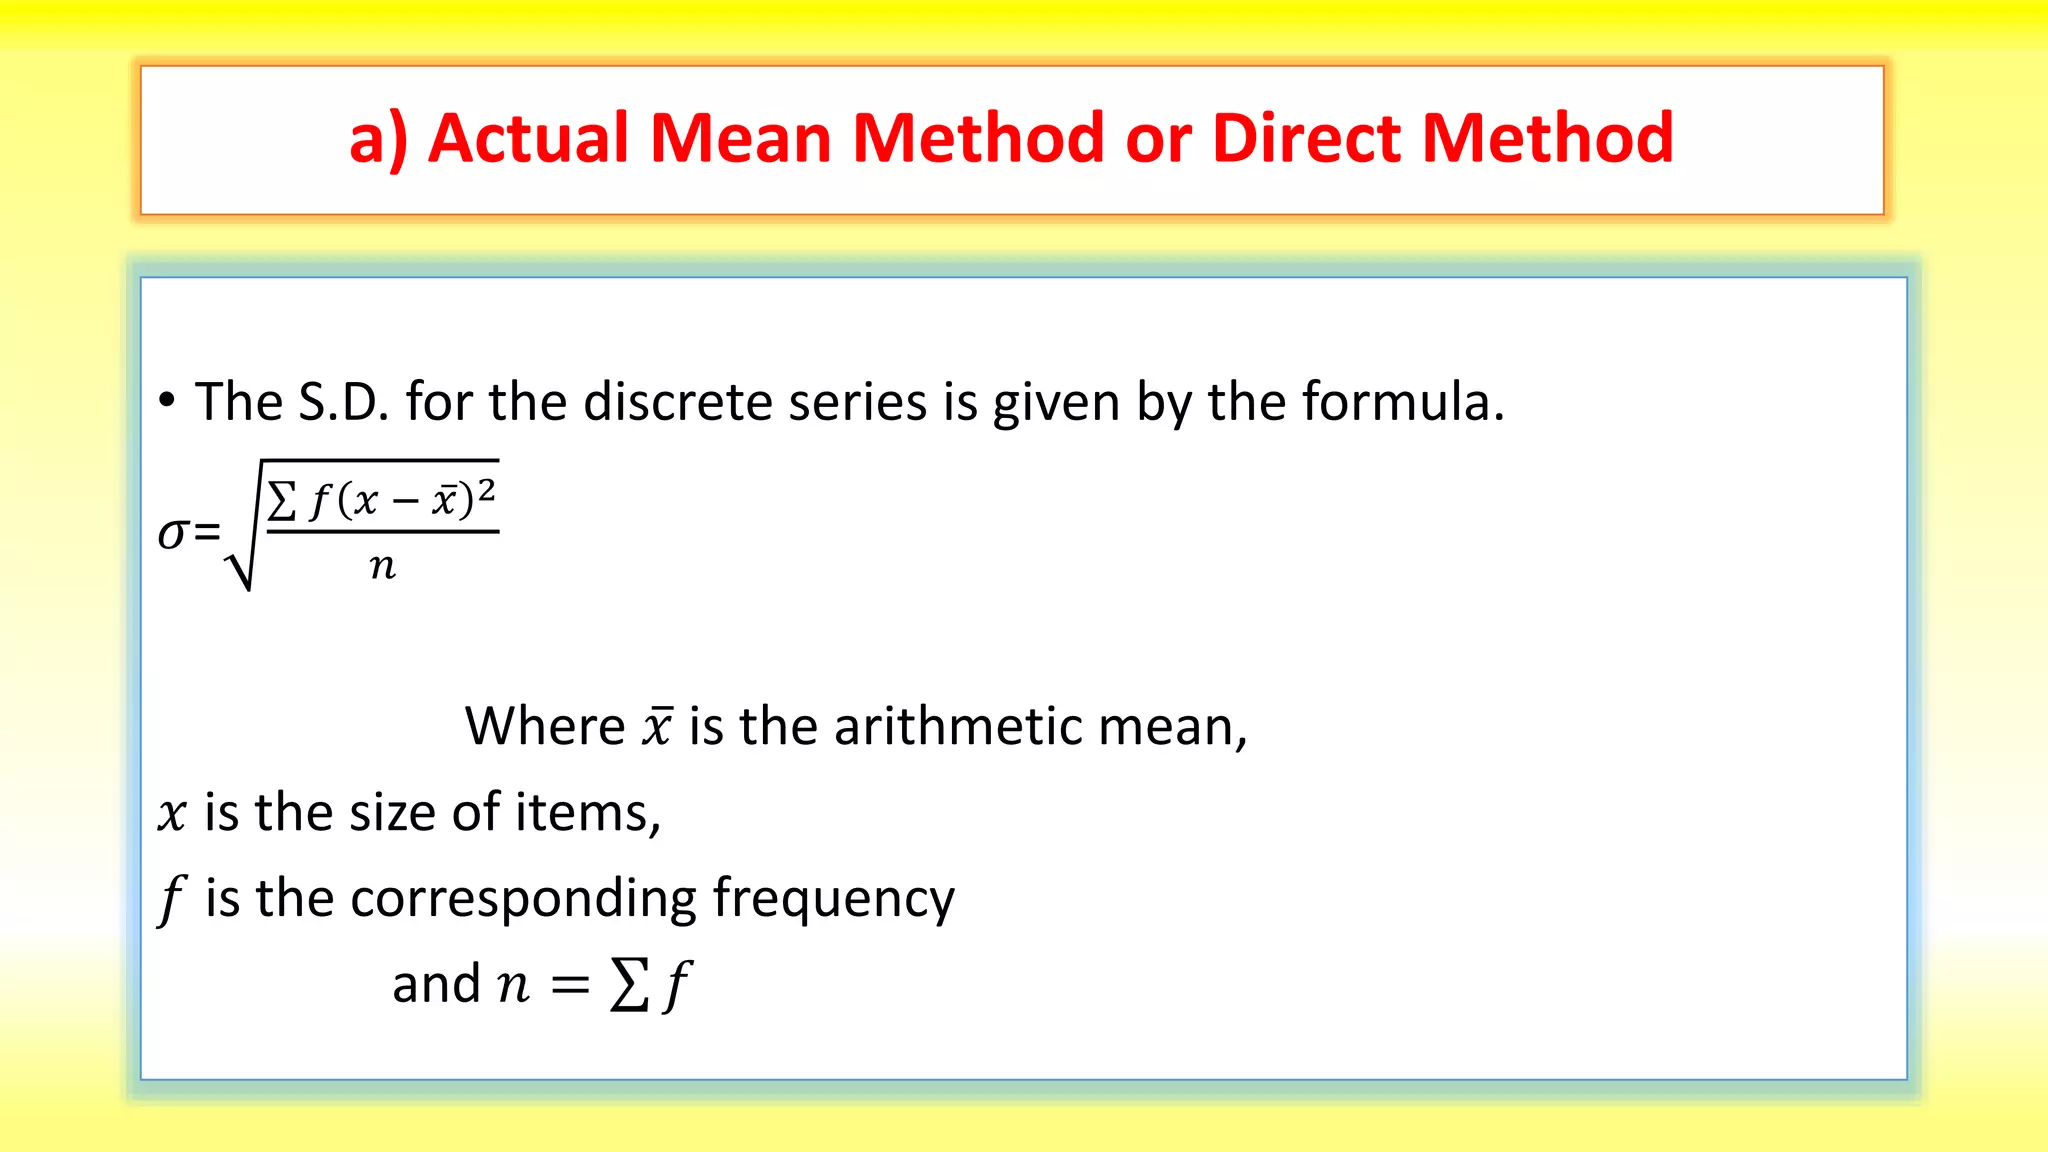
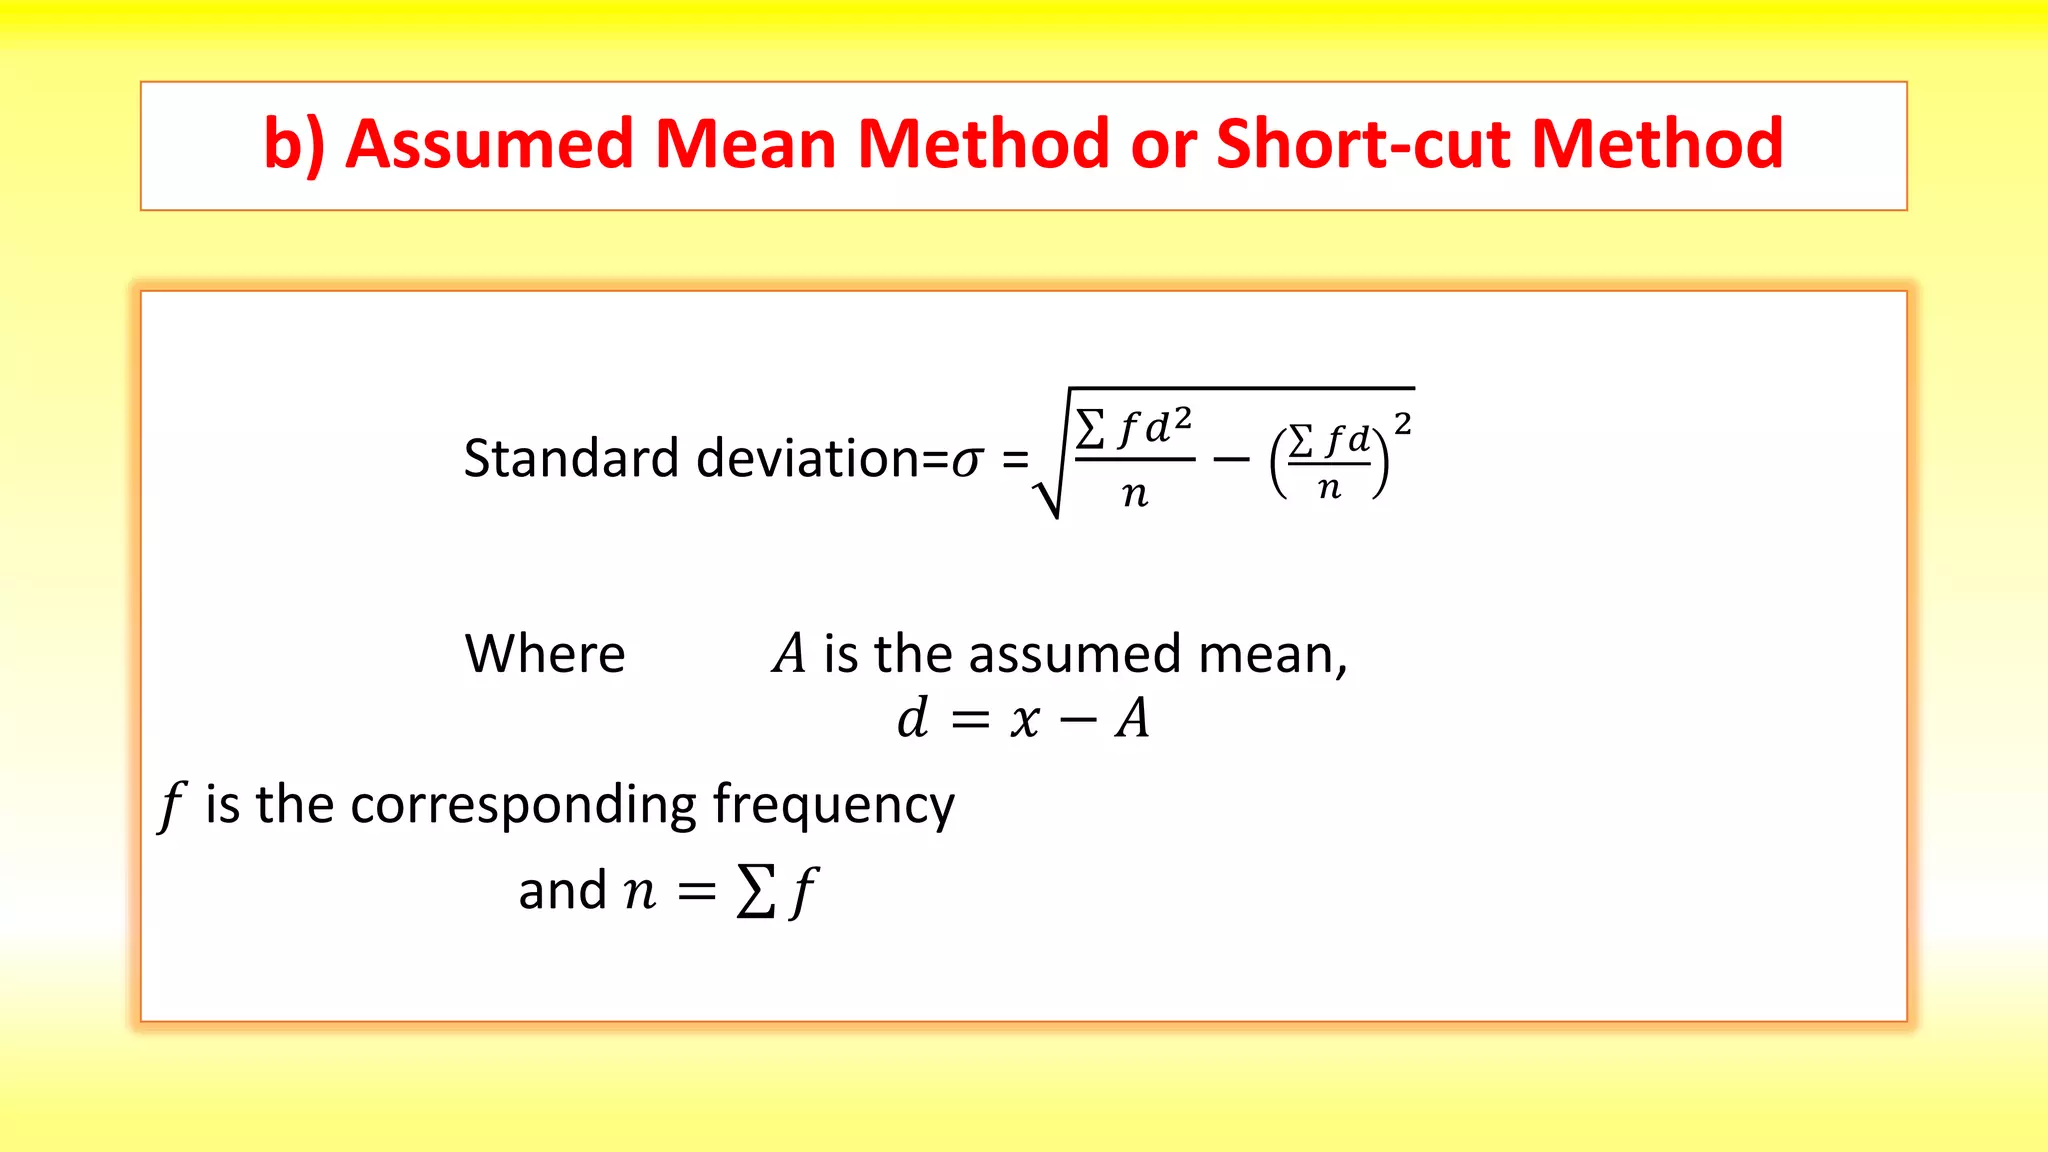
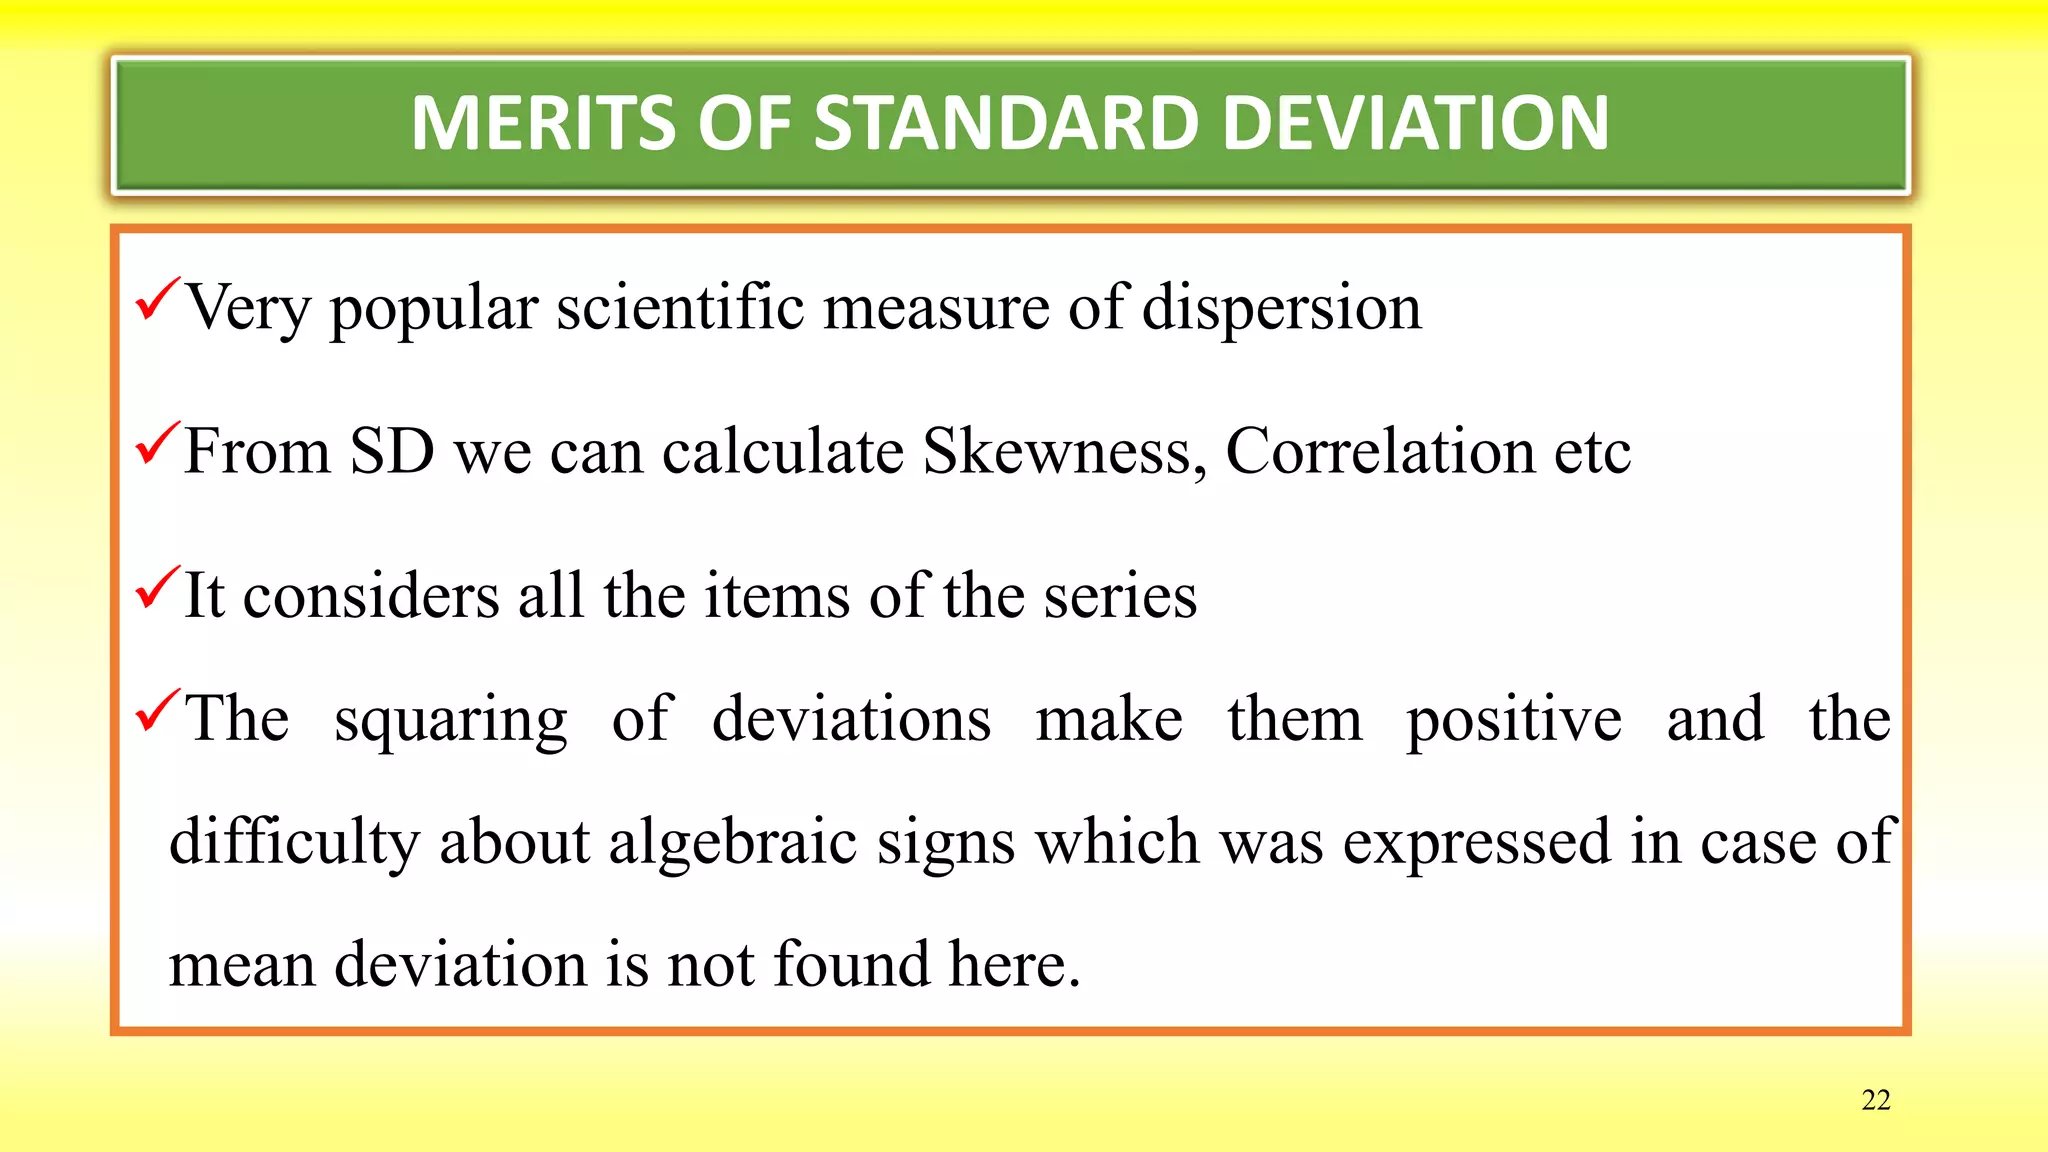
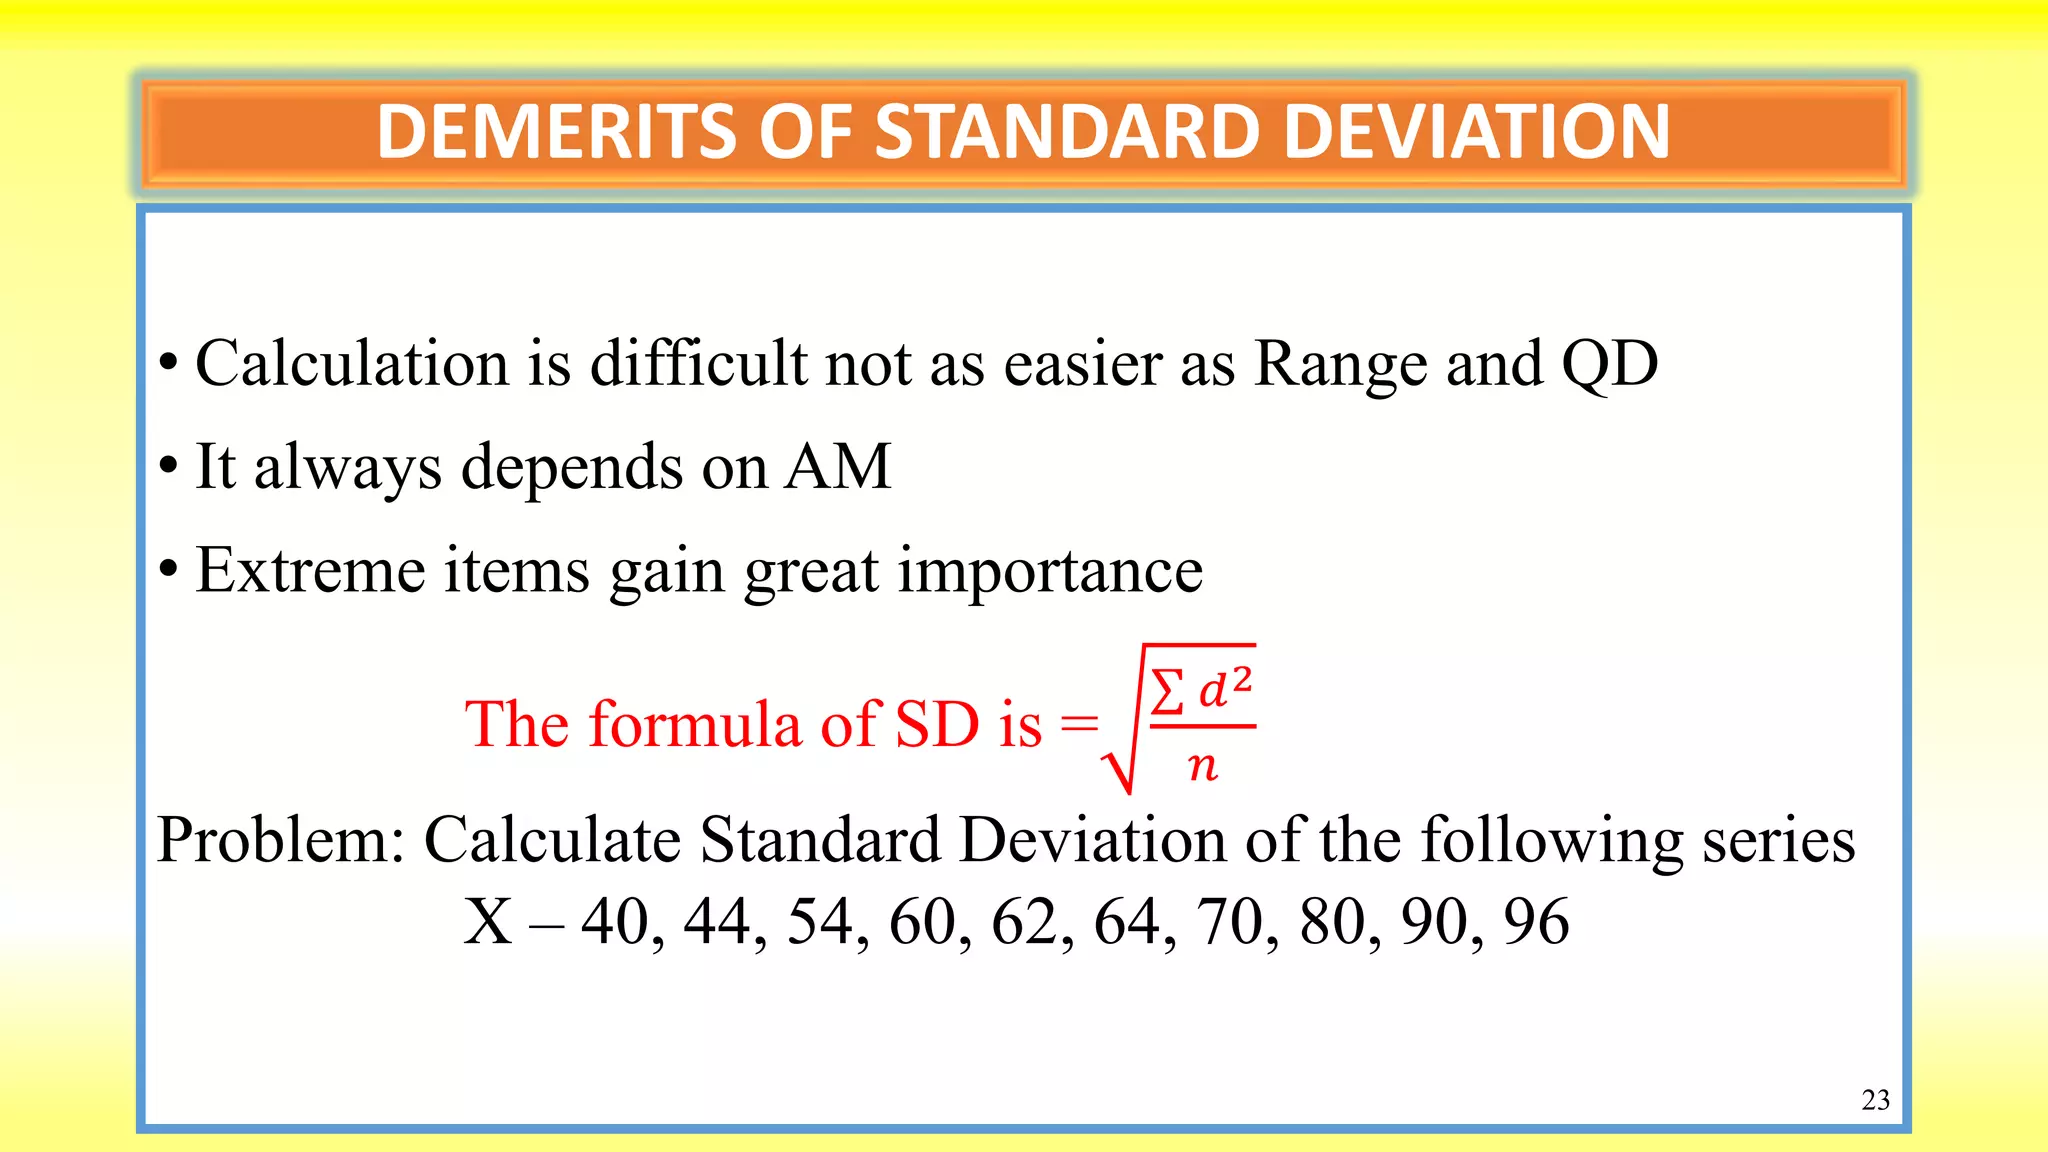
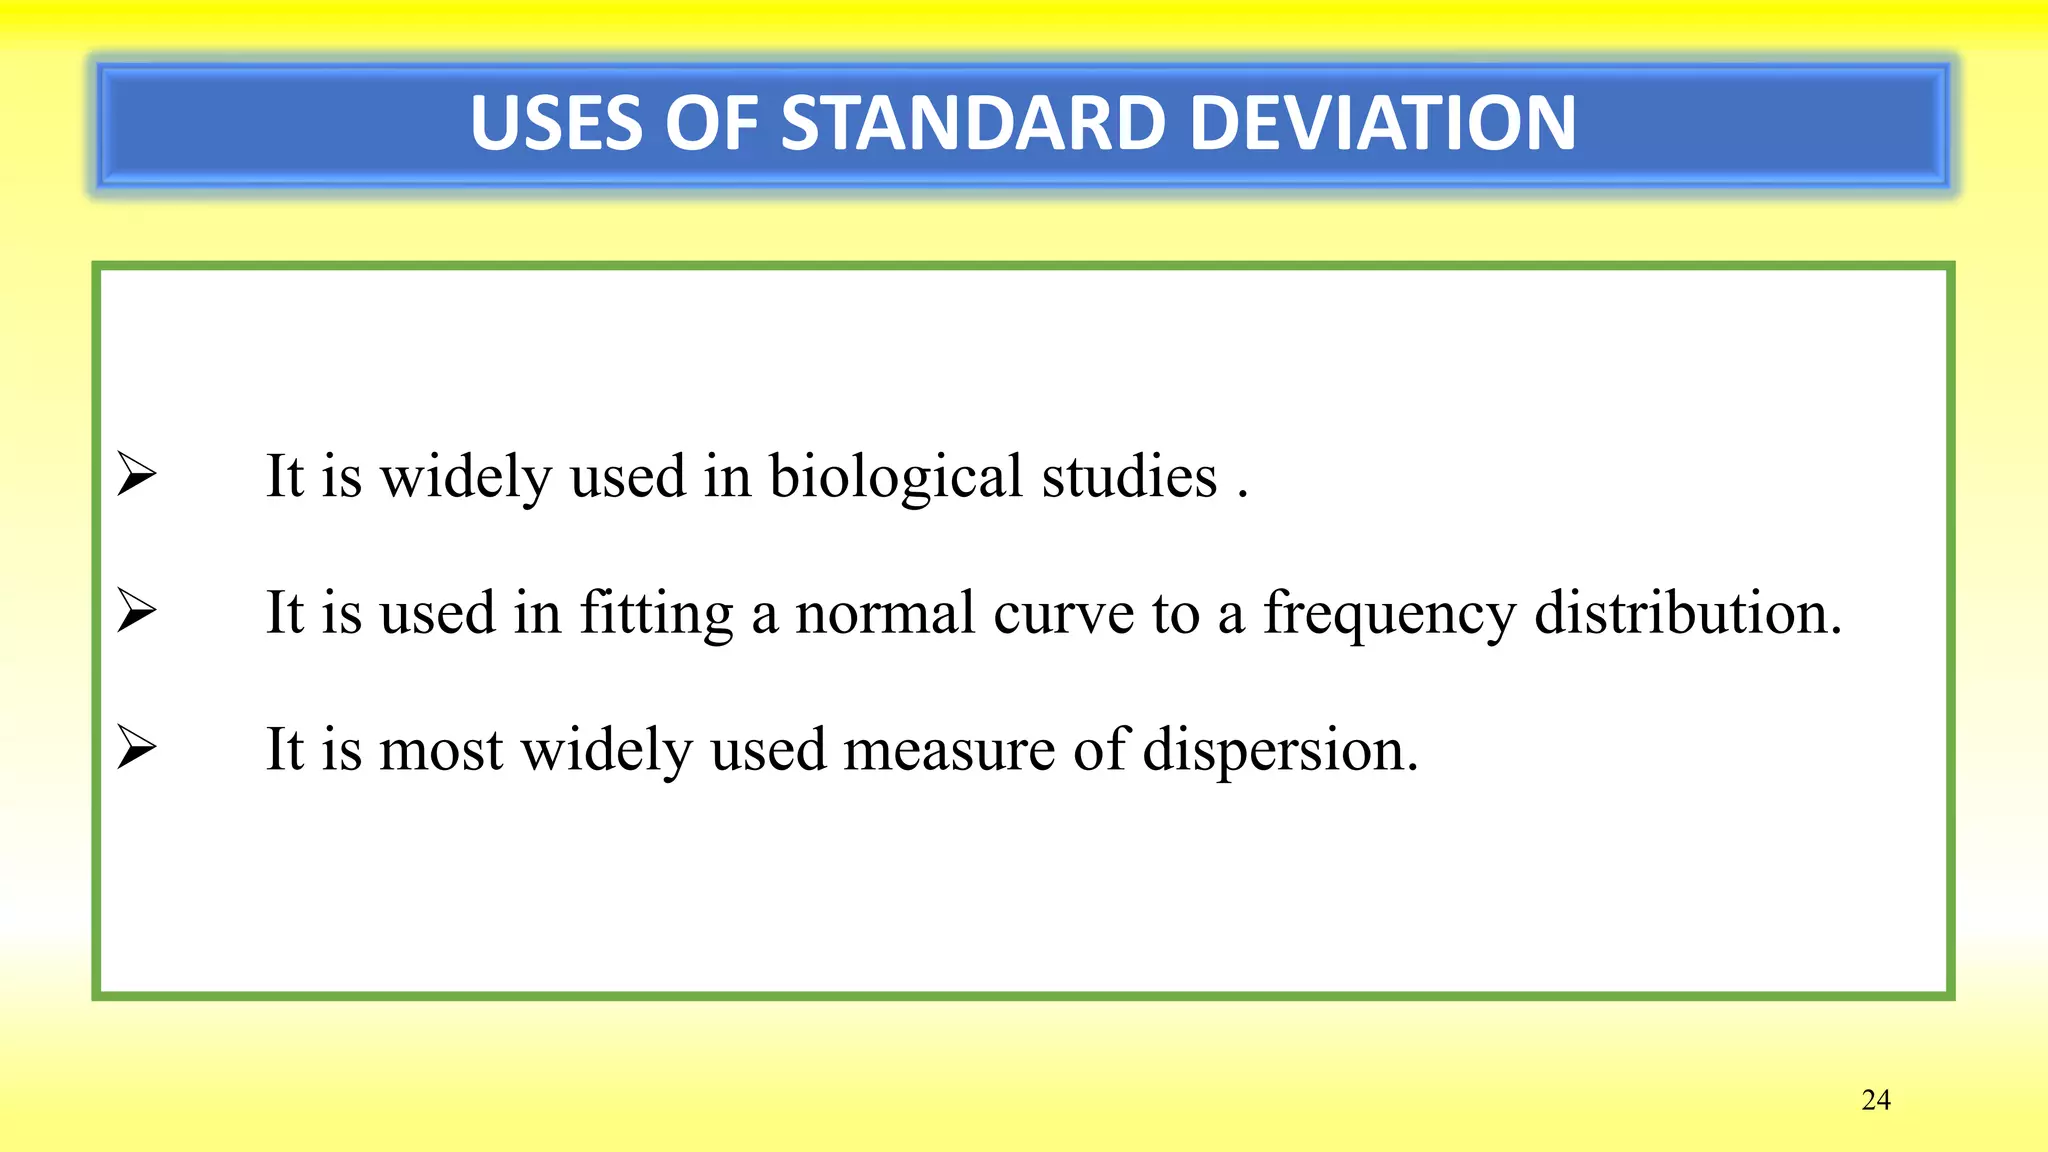

The seminar presented by Jiban Ku Singh at Berhampur University details the standard deviation as a key measure of dispersion introduced by Karl Pearson. It explains its calculation methods, including direct and shortcut methods, and compares it with other measures of dispersion like range and quartile deviation. The document highlights the merits and demerits of standard deviation, emphasizing its scientific importance and widespread application in statistics.