Downloaded 119 times


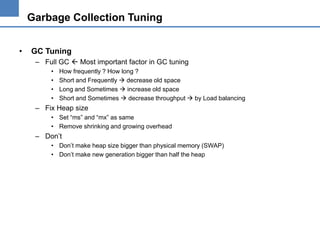
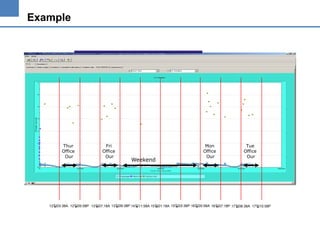
![Slow down in WAS & User AP
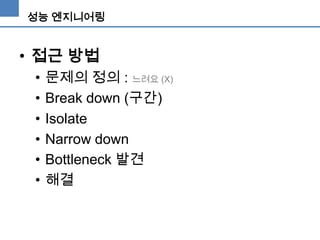
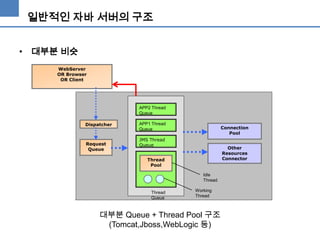
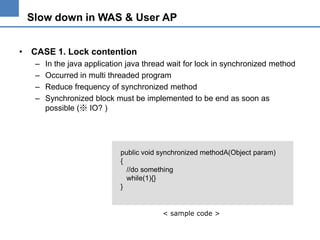
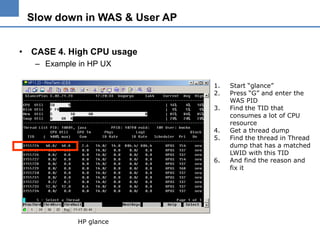
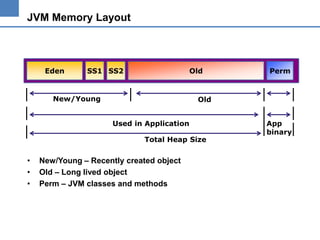
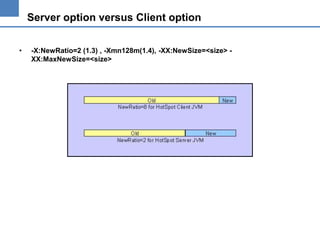
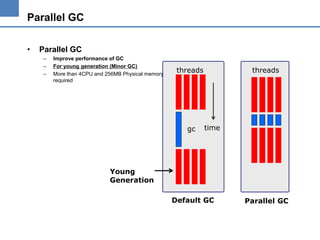
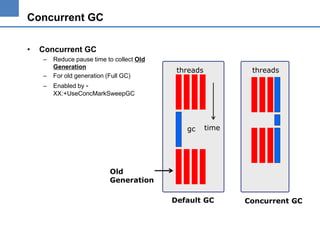
• Thread dump
– It displays all of thread state by “THREAD STACK”
"ExecuteThread: '42' for queue: 'default'" daemon prio=5 tid=0x3504b0 nid=0x34 runnable
[0x9607e000..0x9607fc68]
at
at
at
at
at
at
at
at
at
at
at
at
at
at
at
at
at
java.net.SocketInputStream.read(SocketInputStream.java:85)
oracle.net.ns.Packet.receive(Unknown Source)
oracle.net.ns.NetInputStream.getNextPacket(Unknown Source)
oracle.net.ns.NetInputStream.read(Unknown Source)
oracle.net.ns.NetInputStream.read(Unknown Source)
oracle.net.ns.NetInputStream.read(Unknown Source)
oracle.jdbc.ttc7.MAREngine.unmarshalUB1(MAREngine.java:730)
oracle.jdbc.ttc7.MAREngine.unmarshalSB1(MAREngine.java:702)
oracle.jdbc.ttc7.Oall7.receive(Oall7.java:373)
oracle.jdbc.ttc7.TTC7Protocol.doOall7(TTC7Protocol.java:1427)
oracle.jdbc.ttc7.TTC7Protocol.fetch(TTC7Protocol.java:911)
oracle.jdbc.driver.OracleStatement.doExecuteQuery(OracleStatement.java:1948)
oracle.jdbc.driver.OracleStatement.doExecuteWithTimeout(OracleStatement.java:2137)
oracle.jdbc.driver.OraclePreparedStatement.executeUpdate(OraclePreparedStatement.java:404)
oracle.jdbc.driver.OraclePreparedStatement.executeQuery(OraclePreparedStatement.java:344)
weblogic.jdbc.pool.PreparedStatement.executeQuery(PreparedStatement.java:51)
weblogic.jdbc.rmi.internal.PreparedStatementImpl.executeQuery(PreparedStatementImpl.java:56)
Sun JVM
Thread name
Thread State
Thread id (signature)
Program stack of this thread](https://image.slidesharecdn.com/random-140122083214-phpapp02/85/slide-15-320.jpg)
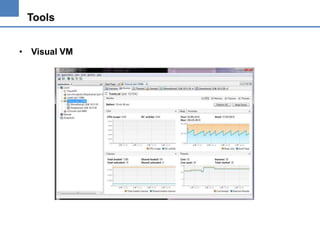
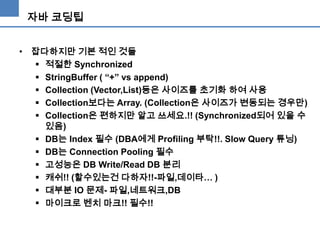
![Slow down in WAS & User AP
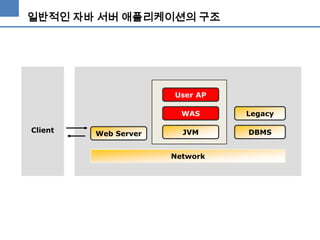
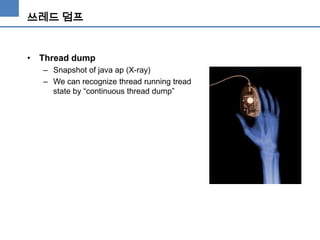
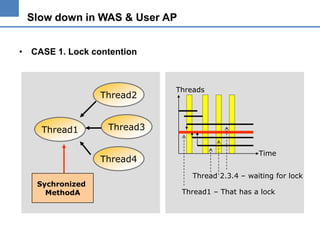
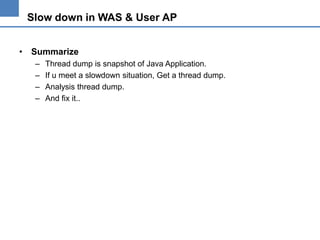
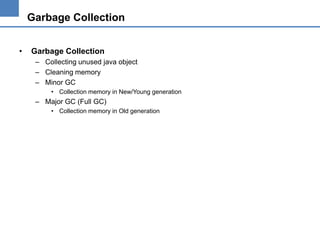
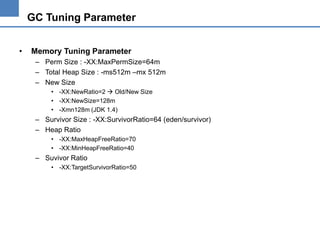
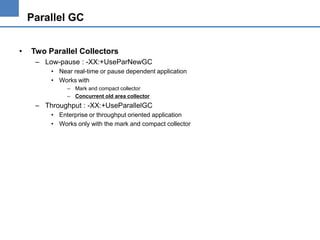
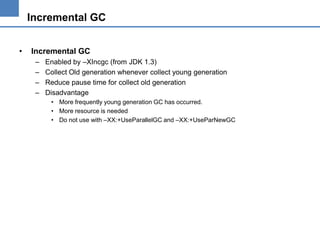
• CASE 1. Lock contention : Thread dump example
"ExecuteThread: '12' for queue: 'weblogic.kernel.Default'" daemon prio=10 tid=0x0055ae20
nid=23 lwp_id=3722788 waiting for monitor entry [0x2fb6e000..0x2fb6d530]
:
at java.lang.ClassLoader.loadClass(ClassLoader.java:255)
:
at org.apache.xerces.jaxp.SAXParserFactoryImpl.newSAXParser(Unknown Source)
at org.apache.axis.utils.XMLUtils.getSAXParser(XMLUtils.java:252)
- locked <0x329fcf50> (a java.lang.Class)
"ExecuteThread: '13' for queue: 'weblogic.kernel.Default'" daemon prio=10 tid=0x0055bde0 nid=24
lwp_id=3722789 waiting for monitor entry [0x2faec000..0x2faec530]
at org.apache.axis.utils.XMLUtils.getSAXParser(XMLUtils.java:247)
- waiting to lock <0x329fcf50> (a java.lang.Class)
:
"ExecuteThread: '15' for queue: 'weblogic.kernel.Default'" daemon prio=10 tid=0x0061dc20 nid=26
lwp_id=3722791 waiting for monitor entry [0x2f9ea000..0x2f9ea530]
at org.apache.axis.utils.XMLUtils.releaseSAXParser(XMLUtils.java:283)
- waiting to lock <0x329fcf50> (a java.lang.Class)
at](https://image.slidesharecdn.com/random-140122083214-phpapp02/85/slide-19-320.jpg)
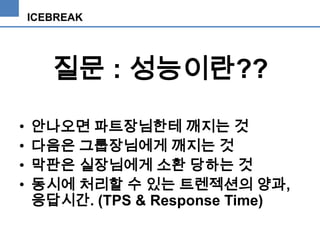
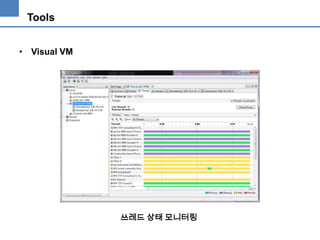
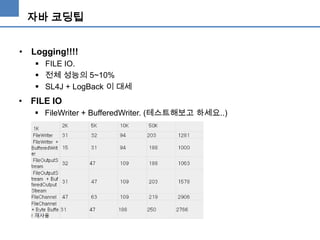
![Slow down in WAS & User AP
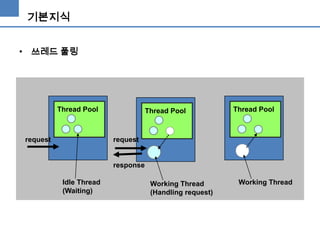
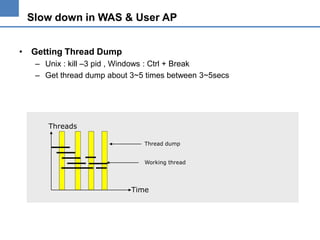
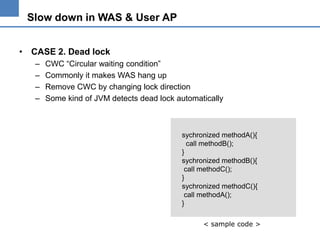
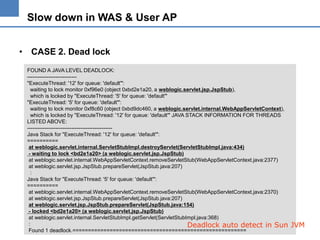
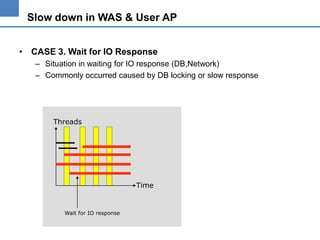
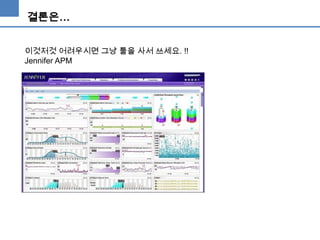
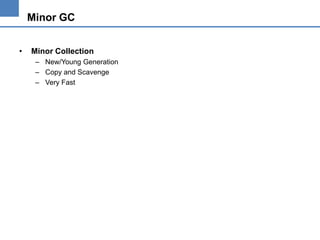
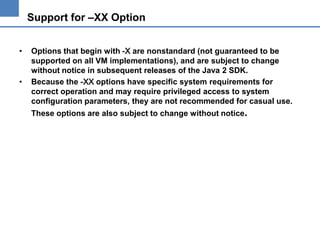
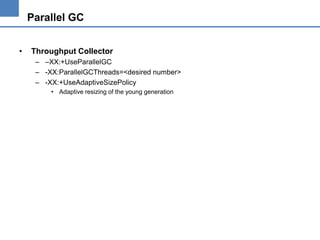
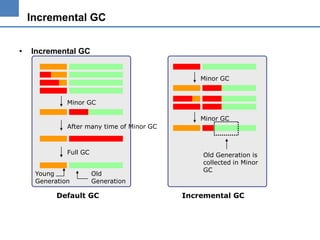
• CASE 3. Wait for IO Response
"ExecuteThread: '42' for queue: 'default'" daemon prio=5 tid=0x3504b0 nid=0x34 runnable [0x9607e000..0x9607fc68]
at java.net.SocketInputStream.socketRead(Native Method)
at java.net.SocketInputStream.read(SocketInputStream.java:85)
at oracle.net.ns.Packet.receive(Unknown Source)
at oracle.net.ns.NetInputStream.getNextPacket(Unknown Source)
at oracle.net.ns.NetInputStream.read(Unknown Source)
at oracle.net.ns.NetInputStream.read(Unknown Source)
at oracle.net.ns.NetInputStream.read(Unknown Source)
at oracle.jdbc.ttc7.MAREngine.unmarshalUB1(MAREngine.java:730)
at oracle.jdbc.ttc7.MAREngine.unmarshalSB1(MAREngine.java:702)
at oracle.jdbc.ttc7.Oall7.receive(Oall7.java:373)
at oracle.jdbc.ttc7.TTC7Protocol.doOall7(TTC7Protocol.java:1427)
at oracle.jdbc.ttc7.TTC7Protocol.fetch(TTC7Protocol.java:911)
at oracle.jdbc.driver.OracleStatement.doExecuteQuery(OracleStatement.java:1948)
at oracle.jdbc.driver.OracleStatement.doExecuteWithTimeout(OracleStatement.java:2137)
at oracle.jdbc.driver.OraclePreparedStatement.executeUpdate(OraclePreparedStatement.java:404)
at oracle.jdbc.driver.OraclePreparedStatement.executeQuery(OraclePreparedStatement.java:344)
at weblogic.jdbc.pool.PreparedStatement.executeQuery(PreparedStatement.java:51)
at weblogic.jdbc.rmi.internal.PreparedStatementImpl.executeQuery(PreparedStatementImpl.java:56)
at weblogic.jdbc.rmi.SerialPreparedStatement.executeQuery(SerialPreparedStatement.java:42)
at com.XXXX 생략
at ……..](https://image.slidesharecdn.com/random-140122083214-phpapp02/85/slide-25-320.jpg)

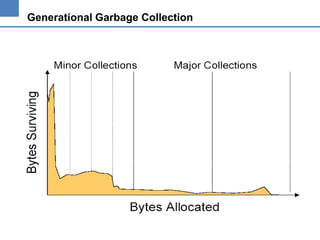
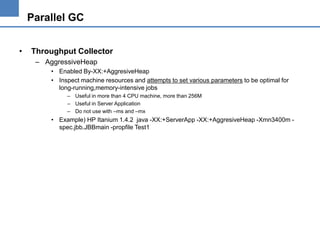
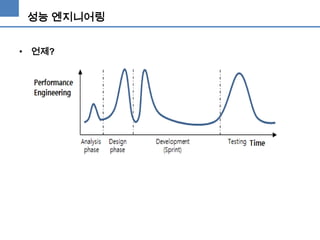
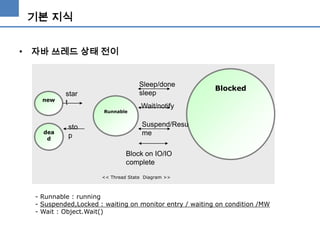
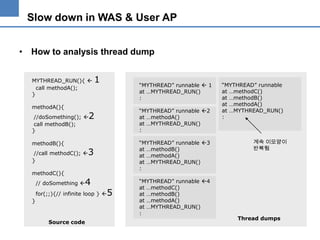
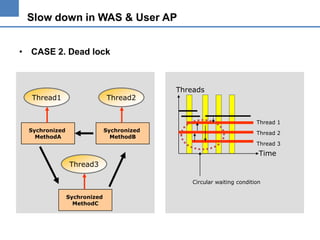
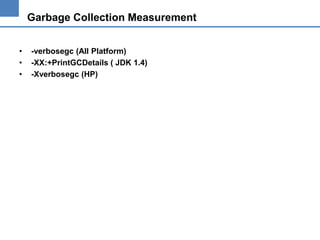
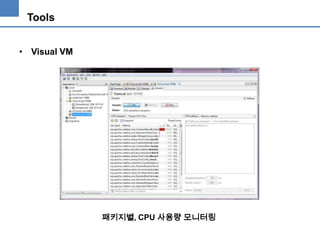
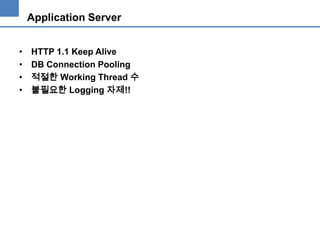
![Incremental GC
•
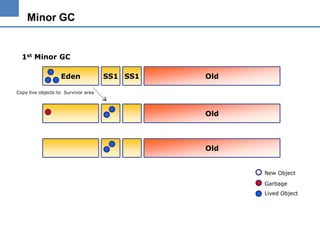
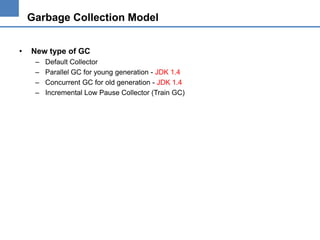
Incremental GC
-client –XX:+PrintGCDetails -Xincgc –ms32m –mx32m
[GC [DefNew: 540K->35K(576K), 0.0053557 secs][Train: 3495K->3493K(32128K), 0.0043531 secs] 4036K>3529K(32704K), 0.0099856 secs]
[GC [DefNew: 547K->64K(576K), 0.0048216 secs][Train: 3529K->3540K(32128K), 0.0058683 secs] 4041K>3604K(32704K), 0.0109779 secs]
[GC [DefNew: 575K->64K(576K), 0.0164904 secs] 4116K->3670K(32704K), 0.0169019 secs]
[GC [DefNew: 576K->64K(576K), 0.0057541 secs][Train: 3671K->3651K(32128K), 0.0051286 secs] 4182K>3715K(32704K), 0.0113042 secs]
[GC [DefNew: 575K->56K(576K), 0.0114559 secs] 4227K->3745K(32704K), 0.0191390 secs]
[Full GC [Train MSC: 3689K->3280K(32128K), 0.0909523 secs] 4038K->3378K(32704K), 0.0910213 secs]
[GC [DefNew: 502K->64K(576K), 0.0173220 secs][Train: 3329K->3329K(32128K), 0.0066279 secs] 3782K>3393K(32704K), 0.0325125 secs
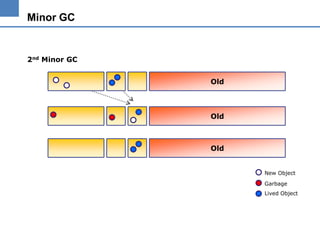
Minor GC
Young Generation GC
Old Generation GC in Minor GC Time
Sun JVM 1.4.1 in Windows OS
Full GC](https://image.slidesharecdn.com/random-140122083214-phpapp02/85/slide-51-320.jpg)
![Garbage Collection Measurement
•
-verbosegc
[GC 40549K->20909K(64768K), 0.0484179 secs]
[GC 41197K->21405K(64768K), 0.0411095 secs]
[GC 41693K->22995K(64768K), 0.0846190 secs]
[GC 43283K->23672K(64768K), 0.0492838 secs]
[Full GC 43960K->1749K(64768K), 0.1452965 secs]
[GC 22037K->2810K(64768K), 0.0310949 secs]
[GC 23098K->3657K(64768K), 0.0469624 secs]
[GC 23945K->4847K(64768K), 0.0580108 secs]
GC Time
Total Heap Size
Heap size after GC
Heap size before GC
Full GC](https://image.slidesharecdn.com/random-140122083214-phpapp02/85/slide-53-320.jpg)
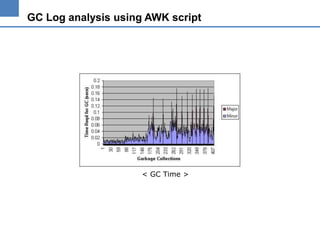
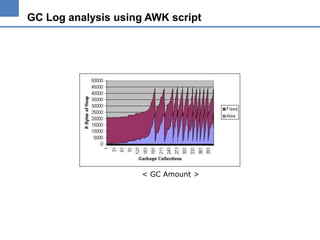
![GC Log analysis using AWK script
•
Awk script
BEGIN{
printf("MinortMajortAlivetFreen");
}
{
if( substr($0,1,4) == "[GC "){
split($0,array," ");
printf("%st0.0t",array[3])
}
split(array[2],barray,"K")
before=barray[1]
after=substr(barray[2],3)
reclaim=before-after
printf("%st%sn",after,reclaim)
if( substr($0,1,9) == "[Full GC "){
split($0,array," ");
printf("0.0t%st",array[4])
split(array[3],barray,"K")
before = barray[1]
after = substr(barray[2],3)
reclaim = before - after
printf("%st%sn",after,reclaim)
}
}
next;
gc.awk
※ Usage
% awk –f gc.awk gc.log
Minor
Major
Alive
0.0484179 0.0
20909
0.0411095 0.0
21405
0.0846190 0.0
22995
0.0492838 0.0
23672
0.0
0.1452965 1749
0.0310949 0.0
2810
0.0469624 0.0
3657
0.0580108 0.0
4847
gc.log
Freed
19640
19792
18698
19611
42211
19227
19441
19098](https://image.slidesharecdn.com/random-140122083214-phpapp02/85/slide-54-320.jpg)
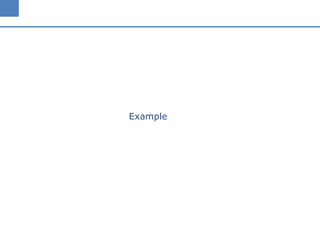
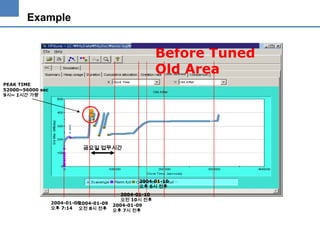
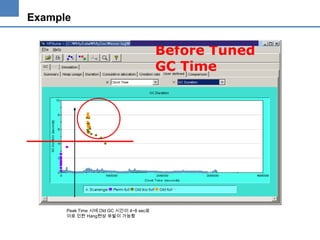
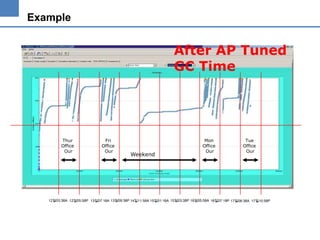


The document discusses performance tuning of Java applications. It covers identifying bottlenecks in Java applications, techniques for performance engineering like defining problems, breaking down into sections, isolating issues and finding bottlenecks. It also provides examples of common bottlenecks like lock contention, deadlocks and waiting for I/O responses. Specific cases discussed include threads waiting for locks, circular waiting conditions causing hangs, and threads blocked waiting for database or network responses.


![[수정본] 우아한 객체지향](https://cdn.slidesharecdn.com/ss_thumbnails/woowahan-oo-190624161343-thumbnail.jpg?width=640&height=640&fit=bounds)


![[오픈소스컨설팅] EFK Stack 소개와 설치 방법](https://cdn.slidesharecdn.com/ss_thumbnails/elasticstack-210712042246-thumbnail.jpg?width=640&height=640&fit=bounds)