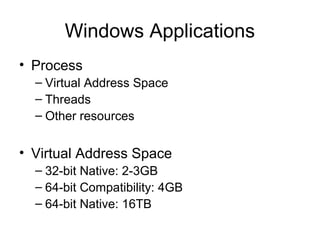
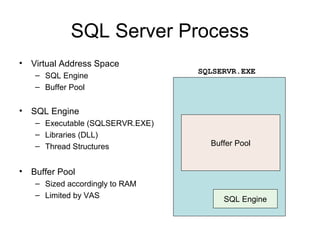
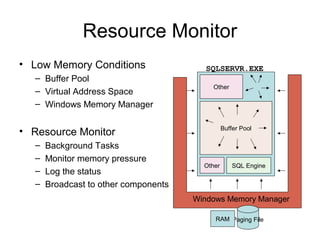
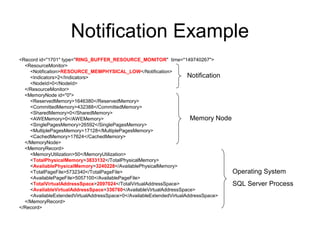
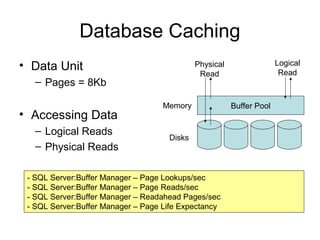
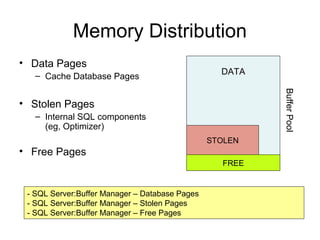
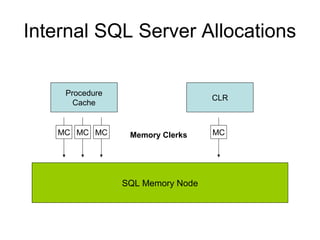
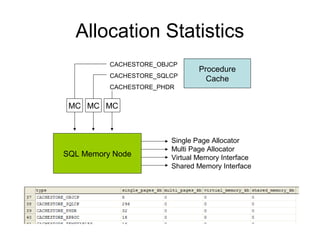
SQL Server 2005
Memory Management
Lesson 1
• Description
– Operating System and SQL Server
• Learning Goals:
– Physical Memory (RAM)
– Virtual Address Space (VAS)
– Interaction between SQL Server and
Operating System
– Resource monitor
Windows Operating System
• Windows Memory Manager
– Abstracts the concept of memory to the applications
– Switches data from RAM to Paging File or vice-versa
• Trimming Memory
• Different Platform Versions
– 32/64-bit Implementations
Windows Applications
• Process
– Virtual Address Space
– Threads
– Other resources
• Virtual Address Space
– 32-bit Native: 2-3GB
– 64-bit Compatibility: 4GB
– 64-bit Native: 16TB
SQL Server Process
• Virtual Address Space
– SQL Engine
– Buffer Pool
• SQL Engine
– Executable (SQLSERVR.EXE)
– Libraries (DLL)
– Thread Structures
• Buffer Pool
– Sized accordingly to RAM
– Limited by VAS
SQLSERVR.EXE
Buffer Pool
SQL Engine
Resource Monitor
• Low Memory Conditions
– Buffer Pool
– Virtual Address Space
– Windows Memory Manager
• Resource Monitor
– Background Tasks
– Monitor memory pressure
– Log the status
– Broadcast to other components
SQLSERVR.EXE
Buffer Pool
SQL Engine
Other
Other
Paging FileRAM
Windows Memory Manager
Notification Example
<Record id="1701" type="RING_BUFFER_RESOURCE_MONITOR" time="149740267">
<ResourceMonitor>
<Notification>RESOURCE_MEMPHYSICAL_LOW</Notification>
<Indicators>2</Indicators>
<NodeId>0</NodeId>
</ResourceMonitor>
<MemoryNode id="0">
<ReservedMemory>1646380</ReservedMemory>
<CommittedMemory>432388</CommittedMemory>
<SharedMemory>0</SharedMemory>
<AWEMemory>0</AWEMemory>
<SinglePagesMemory>26592</SinglePagesMemory>
<MultiplePagesMemory>17128</MultiplePagesMemory>
<CachedMemory>17624</CachedMemory>
</MemoryNode>
<MemoryRecord>
<MemoryUtilization>50</MemoryUtilization>
<TotalPhysicalMemory>3833132</TotalPhysicalMemory>
<AvailablePhysicalMemory>3240228</AvailablePhysicalMemory>
<TotalPageFile>5732340</TotalPageFile>
<AvailablePageFile>5057100</AvailablePageFile>
<TotalVirtualAddressSpace>2097024</TotalVirtualAddressSpace>
<AvailableVirtualAddressSpace>336760</AvailableVirtualAddressSpace>
<AvailableExtendedVirtualAddressSpace>0</AvailableExtendedVirtualAddressSpace>
</MemoryRecord>
</Record>
Notification
Memory Node
Operating System
SQL Server Process
Lesson 2
• Description
– Buffer Pool and Database Caching
– Memory Clerks Concepts
• Objectives
– Check the performance related to Buffer Pool
– Identify memory dedicated for database cache
– Extend the database cache with AWE
– Identify the memory usage by components
– Find who is stealing memory from Buffer Pool
Database Caching
• Data Unit
– Pages = 8Kb
• Accessing Data
– Logical Reads
– Physical Reads
- SQL Server:Buffer Manager – Page Lookups/sec
- SQL Server:Buffer Manager – Page Reads/sec
- SQL Server:Buffer Manager – Readahead Pages/sec
- SQL Server:Buffer Manager – Page Life Expectancy
Disks
Buffer PoolMemory
Physical
Read
Logical
Read
Buffer Pool Size
• Configuration
– Minimum and Maximum Limits
• Static Memory Management
– Define a fixed amount of memory
• Dynamic Memory Management
– SQL Server dynamically adjust the amount of memory used
- SQL Server:Buffer Manager – Total Pages
- SQL Server:Buffer Manager – Target Pages
Memory Distribution
• Data Pages
– Cache Database Pages
• Stolen Pages
– Internal SQL components
(eg, Optimizer)
• Free Pages
- SQL Server:Buffer Manager – Database Pages
- SQL Server:Buffer Manager – Stolen Pages
- SQL Server:Buffer Manager – Free Pages
STOLEN
FREE
DATA
BufferPool
Buffer Pool Extension
• AWE
– Going beyond VAS
– Only used for Data
Cache
• Comparison
– 3GB x AWE
– Can I use both
together?
STOLEN
FREE
DATA
SQL Server
Operating System
2GB
8GB
Aging Buffers
• Two purposes:
– Tries to keep a minimum number of free
buffers (freeing dirty buffers requires I/O)
– Keeps enough physical memory free on the
machine to avoid paging
• Sweeps across BUFs to “age” them
• Many things that it can’t remove
Demo
• Who’s using my memory?
Internal SQL Server Allocations
Procedure
Cache
CLR
SQL Memory Node
MC MCMC MCMemory Clerks
Allocation Statistics
SQL Memory Node
MC MCMC
Single Page Allocator
Multi Page Allocator
Virtual Memory Interface
Shared Memory Interface
CACHESTORE_OBJCP
CACHESTORE_SQLCP
CACHESTORE_PHDR
Procedure
Cache
Memory Allocation
SQL Memory Node
Single Page Allocator
Multi Page Allocator
Virtual Memory Interface
Shared Memory Interface
SQLSERVR.EXE
Buffer Pool
SQL Engine
Demo
• Who’s stolen my memory?
• CLR consuming memory
• SQL Plans growing
ENDThe following slides have ideas for
the next workshop update
Lesson 3
• Description
– Memory Clerks Concepts
• Objectives
– Understand the concept of Memory Clerks
– Identify the memory usage by components
– Find who is stealing memory from Buffer Pool
Memory Clerk
• Allocates the memory as needed
• React differently to Memory Pressure
• Sys.dm_os_memory_clerks
MEMORY
CLERK
Resource Monitor
Controlling Memory Usage
• Specifics Types
– Custom Memory Clerk
– Cache and User Store
– Object Store
CUSTOM
MEMORY
CLERK
CACHE
STORE
USER
STORE
OBJECT
STORE
Custom Memory Clerk
• Each Memory Clerk implements the action
to the notification
• Examples
– General
– CLR
– Full Text
Object Store
• Free half of the entries
• sys.dm_os_memory_pools
Cache and User Store
• Remove the cheapest items
• Use Clock hands algorithm
• sys.dm_os_memory_cache_counters
Clock Hand
• External
– Resource Monitor
• Internal
– Internal Limits / Boundaries (INTERNAL)
• sys.dm_os_memory_cache_clock_hand
Memory Broker

SQL 2005 Memory Module

  • 1.
  • 2.
    Lesson 1 • Description –Operating System and SQL Server • Learning Goals: – Physical Memory (RAM) – Virtual Address Space (VAS) – Interaction between SQL Server and Operating System – Resource monitor
  • 3.
    Windows Operating System •Windows Memory Manager – Abstracts the concept of memory to the applications – Switches data from RAM to Paging File or vice-versa • Trimming Memory • Different Platform Versions – 32/64-bit Implementations
  • 4.
    Windows Applications • Process –Virtual Address Space – Threads – Other resources • Virtual Address Space – 32-bit Native: 2-3GB – 64-bit Compatibility: 4GB – 64-bit Native: 16TB
  • 5.
    SQL Server Process •Virtual Address Space – SQL Engine – Buffer Pool • SQL Engine – Executable (SQLSERVR.EXE) – Libraries (DLL) – Thread Structures • Buffer Pool – Sized accordingly to RAM – Limited by VAS SQLSERVR.EXE Buffer Pool SQL Engine
  • 6.
    Resource Monitor • LowMemory Conditions – Buffer Pool – Virtual Address Space – Windows Memory Manager • Resource Monitor – Background Tasks – Monitor memory pressure – Log the status – Broadcast to other components SQLSERVR.EXE Buffer Pool SQL Engine Other Other Paging FileRAM Windows Memory Manager
  • 7.
    Notification Example <Record id="1701"type="RING_BUFFER_RESOURCE_MONITOR" time="149740267"> <ResourceMonitor> <Notification>RESOURCE_MEMPHYSICAL_LOW</Notification> <Indicators>2</Indicators> <NodeId>0</NodeId> </ResourceMonitor> <MemoryNode id="0"> <ReservedMemory>1646380</ReservedMemory> <CommittedMemory>432388</CommittedMemory> <SharedMemory>0</SharedMemory> <AWEMemory>0</AWEMemory> <SinglePagesMemory>26592</SinglePagesMemory> <MultiplePagesMemory>17128</MultiplePagesMemory> <CachedMemory>17624</CachedMemory> </MemoryNode> <MemoryRecord> <MemoryUtilization>50</MemoryUtilization> <TotalPhysicalMemory>3833132</TotalPhysicalMemory> <AvailablePhysicalMemory>3240228</AvailablePhysicalMemory> <TotalPageFile>5732340</TotalPageFile> <AvailablePageFile>5057100</AvailablePageFile> <TotalVirtualAddressSpace>2097024</TotalVirtualAddressSpace> <AvailableVirtualAddressSpace>336760</AvailableVirtualAddressSpace> <AvailableExtendedVirtualAddressSpace>0</AvailableExtendedVirtualAddressSpace> </MemoryRecord> </Record> Notification Memory Node Operating System SQL Server Process
  • 8.
    Lesson 2 • Description –Buffer Pool and Database Caching – Memory Clerks Concepts • Objectives – Check the performance related to Buffer Pool – Identify memory dedicated for database cache – Extend the database cache with AWE – Identify the memory usage by components – Find who is stealing memory from Buffer Pool
  • 9.
    Database Caching • DataUnit – Pages = 8Kb • Accessing Data – Logical Reads – Physical Reads - SQL Server:Buffer Manager – Page Lookups/sec - SQL Server:Buffer Manager – Page Reads/sec - SQL Server:Buffer Manager – Readahead Pages/sec - SQL Server:Buffer Manager – Page Life Expectancy Disks Buffer PoolMemory Physical Read Logical Read
  • 10.
    Buffer Pool Size •Configuration – Minimum and Maximum Limits • Static Memory Management – Define a fixed amount of memory • Dynamic Memory Management – SQL Server dynamically adjust the amount of memory used - SQL Server:Buffer Manager – Total Pages - SQL Server:Buffer Manager – Target Pages
  • 11.
    Memory Distribution • DataPages – Cache Database Pages • Stolen Pages – Internal SQL components (eg, Optimizer) • Free Pages - SQL Server:Buffer Manager – Database Pages - SQL Server:Buffer Manager – Stolen Pages - SQL Server:Buffer Manager – Free Pages STOLEN FREE DATA BufferPool
  • 12.
    Buffer Pool Extension •AWE – Going beyond VAS – Only used for Data Cache • Comparison – 3GB x AWE – Can I use both together? STOLEN FREE DATA SQL Server Operating System 2GB 8GB
  • 13.
    Aging Buffers • Twopurposes: – Tries to keep a minimum number of free buffers (freeing dirty buffers requires I/O) – Keeps enough physical memory free on the machine to avoid paging • Sweeps across BUFs to “age” them • Many things that it can’t remove
  • 14.
  • 15.
    Internal SQL ServerAllocations Procedure Cache CLR SQL Memory Node MC MCMC MCMemory Clerks
  • 16.
    Allocation Statistics SQL MemoryNode MC MCMC Single Page Allocator Multi Page Allocator Virtual Memory Interface Shared Memory Interface CACHESTORE_OBJCP CACHESTORE_SQLCP CACHESTORE_PHDR Procedure Cache
  • 17.
    Memory Allocation SQL MemoryNode Single Page Allocator Multi Page Allocator Virtual Memory Interface Shared Memory Interface SQLSERVR.EXE Buffer Pool SQL Engine
  • 18.
    Demo • Who’s stolenmy memory? • CLR consuming memory • SQL Plans growing
  • 19.
    ENDThe following slideshave ideas for the next workshop update
  • 20.
    Lesson 3 • Description –Memory Clerks Concepts • Objectives – Understand the concept of Memory Clerks – Identify the memory usage by components – Find who is stealing memory from Buffer Pool
  • 21.
    Memory Clerk • Allocatesthe memory as needed • React differently to Memory Pressure • Sys.dm_os_memory_clerks MEMORY CLERK Resource Monitor
  • 22.
    Controlling Memory Usage •Specifics Types – Custom Memory Clerk – Cache and User Store – Object Store CUSTOM MEMORY CLERK CACHE STORE USER STORE OBJECT STORE
  • 23.
    Custom Memory Clerk •Each Memory Clerk implements the action to the notification • Examples – General – CLR – Full Text
  • 24.
    Object Store • Freehalf of the entries • sys.dm_os_memory_pools
  • 25.
    Cache and UserStore • Remove the cheapest items • Use Clock hands algorithm • sys.dm_os_memory_cache_counters
  • 26.
    Clock Hand • External –Resource Monitor • Internal – Internal Limits / Boundaries (INTERNAL) • sys.dm_os_memory_cache_clock_hand
  • 27.

Editor's Notes

  • #4 Operating System Abstract the concept of memory to the applications – Windows uses Physical Memory (RAM) and Paging File (Pagefile.sys file). Both of them are valid storage to maintain user data while system is up and working. In fact, Windows abstracts the “memory concept” and provides a generic memory to the application – this is called Virtual Memory. The applications are unable to tell whether they are using Physical Memory or Paging File. This implementation has clear advantages: Applications can use more than the total of Physical Memory installed in the machine Windows can move the data with little access from the Memory to the Paging file Switches data from RAM to Paging File or vice-versa – One of Windows Memory Manager goals is to ensure optimum physical memory usage among the applications. Thus, Windows attempts to use all Physical Memory (RAM) whenever possible. If the machine has plenty of memory, then Windows give Physical Memory to most of the applications. Using RAM instead of Paging File will boost application performance. Since RAM is such a precious resource, Windows attempts to page memory to the Paging File when the memory has little usage. When an application needs to use a memory portion that has been paged to disk, the Memory Manager loads the data back into memory from the disk. Demo: In order to illustrate how much Physical Memory each application is using, we can show up Task Manager. Windows Task Manager -&amp;gt; Process Tab -&amp;gt; See all the processes running, and ensure the column “Mem Usage” is included. The “Mem Usage” column corresponds to the amount of Physical Memory allocated to each process, but it doesn’t count memory in Paging File. Open up Notepad, and see how much memory is being consumed (In my machine, it uses 3,140K). After that, minimize Notepad window and see that this number dropped (eg, 400K). Every time an application is minimized, its memory in RAM is paged out to Paging File. Trimming Memory – As said before, Windows always tries to give Physical Memory to the application. What happens when the machine runs out of physical memory? Windows starts looking for memory with little usage, and paged this memory out to disk until it has a good amount of memory available again. This process is called “trimming”. Thus, Windows reacts to low memory condition by trimming memory from applications based on the usage. It is interesting to notice that Windows cannot be too aggressive in the trimming process. Example: It isn’t healthy to keep paging out the memory if only 128MB is in use, and there is still 786MB left. Windows has to balance the memory usage and the trimming process, and it achieves this goal by keeping the minimum amount of free physical memory available. What Windows considers as an ideal amount of free physical memory? In Windows 2000, this value ranges from 4-10MB, and when the amount of free memory falls below it then trimming takes place. However, one should not rely on these numbers because they aren’t documented and might changed along the time (Eg, a Service Pack can change this behavior). In Windows 2003, the algorithm to decide the ideal amount of free physical memory changed, and it isn’t the same 4-10MB range. The good thing is that Windows 2003 provides an API that allows an application to receive notifications of when the machine is running out of memory. This allows applications such as SQL Server to adjust its internal structures, giving the opportunity to return the memory to OS. This mechanism does help improving the memory management. Versions – Windows runs in different platform versions. Depending on the platform, the some restrictions may apply. 32-bit Platform (x86): Windows Memory Manager normally uses 32-bit pointers to map the memory. This allows the Operating System to address a maximum of 4GB of memory. Even though it shouldn’t be a problem for desktop machines, it is a problem for servers. Due to a platform limitation, Windows 32-bit is limited to see only 4GB with 32-bit pointers. However, there is a switch (/PAE) to enable Windows to use larger pointers, and consequently to address more memory. PAE switch can be set in c:\boot.ini file, and it should be turned on whenever the server has more than 4GB. If this flag isn’t enabled, then the upper 4GB limit applies even if the machine has more memory installed. 64-bit Platform (x64 and Itanium): Windows Memory Manager uses 64-bit pointers and it has no such restriction as the 32-bit platform. In 64-bit world, there is no need to use PAE flag. Windows 2003 Enterprise Edition SP1 is limited to 1TB. Except for the limit thresholds, the general Windows Memory Management characteristics are very similar.
  • #5 Windows Applications One responsibility of Windows is to provide protection to the applications. Each application is composed of one or more processes. In order to understand what exactly this protection means, we will first define what is a process. One can think process as being represented by a standalone EXE running. For example, SQL Server is a service and it runs under SQLSERVR.EXE process. One step to enforce protection is by giving a private Virtual Memory to each process. This mechanism guarantees that one process is unable to have direct access to the memory of another process. Instead of saying “private Virtual Memory”, we will be using the word “Virtual Address Space”. Process – Each process will have its own Virtual Address Space as well as threads (that cannot be shared with another process). Thus, each process has its own resources and it doesn’t need to depend on the other processes. The Operating System is able to watch all the processes, and it will be responsible for managing the resources. Virtual Address Space – Virtual Address Space (VAS) is the memory space supplied by the Operating System to an application, and the its size depends on the platform. 32-bit Application running on Windows 32-bit – Virtual Address Space is limited to 4GB total, and it is split into two regions: Kernel Mode and User Mode. The former contains the critical functionalities of the Operating System core (eg, communication with the hardware devices), and it occupies 2GB. The rest of VAS is left to the process itself. This is also called User Mode Address Space, and it goes from the memory range 0 – 2GB. In this space, it’s loaded the executable file and DLL libraries. It is possible to increase the size of the User Mode Address Space with the flag /3GB (Windows 2000 or later) and /USERVA (Windows 2003 or later). There are known drawbacks though – In order to keep the total of 4GB, increasing the User Mode Address Space will shrink the Kernel Mode Address Space. Notice: Virtual Address Space is always limited to 4GB for 32-bit application. A common mistake is to think the flag /PAE change this behavior. The flag /PAE keeps VAS size untouched, and it only affects the way the Kernel sees the Physical Memory. 32-bit Application running on Windows 64-bit – It is possible to run 32-bit applications in a 64-bit machine. People refer to it as running application in WoW Mode. Since the Kernel runs on 64-bit, it doesn’t need to occupy the same VAS as the 32-bit application. This means that the whole 4GB VAS is available as User Mode Address Space, and there is no need to use /3GB. Notice: There is no way to extend Virtual Address Space beyond 4GB for 32-bit application running in WoW Mode. 64-bit Application running on Windows 64-bit – Process will have 16TB of VAS.
  • #6 SQL Server Process Virtual Address Space – SQL Server runs as SQLSERVR.EXE process with its own Virtual Address Space. In the service startup, you should normally see SQL Engine and Buffer Pool inside this space. In case of a server with several SQL Server Instances, it’s expected to see one SQLSERVR.EXE process for each of the instances. SQL Engine – There is no strict definition for “SQL Engine”. In this context, we are referring to: Executable image (SQLSERVR.EXE) DLL Libraries (NTDLL.DLL, KERNEL32.DLL, ADVAPI32.DLL, USER32.DLL, etc) Thread Structures (Eg., thread stack) Other resources needed for SQL Server process SQL Engine consume from 30-60MB depending on the components loaded. In most of the dedicated SQL Servers, this represents a small amount of memory and shouldn’t be a concern. Buffer Pool – This is one of the main components of SQL Server and it corresponds to the database cache. So instead of posting an I/O operation to the disk, data is looked up from the cache in memory. The goal is to use as much memory as possible to have optimum cache performance. However, it is not possible to keep growing the cache indefinitely. The resources that normally limit the Buffer Pool size are listed below. Physical Memory (RAM) Available – Buffer Pool keeps growing while there is Physical Memory (RAM) available. Although the allocation rate can be more aggressive, it can never over allocate memory beyond to what is available. Otherwise, Windows Memory Manager would start the trimming process, causing catastrophic results to the performance. Instead of paging out memory from Buffer Pool to disk, SQL Server prefers freeing memory by shrinking the cache size. Virtual Address Space (VAS) Available – In 32-bit platform, it is quite common to see a large amount of Physical Memory than does not fit in the User Address Space (2GB). Running out of VAS puts SQL Server process under a critical situation, and unexpected errors could randomly occur. For example, Linked Server failures, access violation in Extended Procedures, SQL Engines unable to create threads, errors to generate dump files, slow backup performance. That’s why Buffer Pool cannot allocate the entire Virtual Address Space, and it has to leave some VAS available. The default value is 384MB, but it can be adjusted according the the formula below. MemToLeave = MemReserved + (NumThreads * 0.5MB), where NumThreads = &amp;lt;the total number of worker threads configured for SQL Server&amp;gt; MemReserved = 256MB, but it can be changed with the parameter -g in SQL Startup This mechanism allows Buffer Pool to reserve huge blocks of memory to store cached data, and it also guarantees a healthy amount of Virtual Address Space left (MemToLeave) to the respective consumers. In general, Virtual Address Space is rarely an issue for 32-machines with less than 2GB. In 64-bit platform, Virtual Address Space addresses up to 16TB and doesn’t limit Buffer Pool in general.
  • #7 Resource Monitor Low Memory Conditions – Memory issue may crop up from different sources, which makes it difficult to handle it. From an general perspective, the issues are related to the Buffer Pool, Virtual Address Space and Windows Memory Manager. Buffer Pool – The database caching mechanism needs to grow Buffer Pool to improve the response time, but there is no space left to accomplish it. Virtual Address Space – Different components fails when trying to use memory outside of Buffer Pool, because there is no Virtual Address Space available. Windows Memory Manager – Operating System is about to start the trimming process in order to balance the amount of physical memory. At this moment, SQL Server has to discard memory to prevent being paged out to disk. Resource Monitor – SQL Server creates background tasks to maintain a healthy amount of memory. Resource Monitor tasks perform periodic checks and listen to OS notification to see if memory is low. When a memory pressure is detected, a message is logged in the “ring buffer” with the corresponding state. The ring buffer is a good place to store the last events occurred in Resource Monitor, and it helps the DBA in a later troubleshooting. The memory pressure message is also broadcasted to SQL Engine, so all internal SQL components have a chance to reduce their memory consumption.
  • #8 Notification Example
  • #10 Database Caching Buffer Pool is one of the main components inside SQL Server, and it plays a critical role in the memory management tasks. The concept of Buffer Pool hasn’t changed from SQL Server 2000 behavior, and most of concepts learned during this lesson also apply to SQL Server 2000. Data Unit – Buffer Pool works with 8-kb pages. This means that 1 read operation corresponds to 8Kb, and 100 reads correspond to 800Kb. Accessing Data –Buffer Pool abstracts the physical data location, and provides caching functionalities. Since all data accessed go through this mechanism, Buffer Pool is able to decide which data will be stored in cache to boost performance for frequently used objects. When a query runs, it doesn’t have the notion of data locality, it simply requests the page from the Buffer Pool. There are two different types of accesses: Logical Read – Data requested are already present in the cache. Since it only involves memory accesses, the response time is optimum. Physical Read – Data requested are not in cache, so it has to be looked up from the database files. This turns down to a disk I/O operation, which is more expensive than a memory access. Once the I/O operation is completed, the request is satisfied and data are stored in cache for later accesses. How to monitor Buffer Pool? – It is important to make sure Buffer Pool is achieving its goal of caching data properly. The easiest way to see Buffer Pool performance is through Performance Monitor. SQL Server:Buffer Manager – Page Lookups/sec counts the number of pages that were requested in that second. This includes both Logical and Physical Reads. In general, this number doesn’t tell much alone. You should normally compare it with the other performance counters. SQL Server:Buffer Manager – Page Reads/sec and SQL Server:Buffer Manager – Readahead Pages/sec correspond to the I/O operations posted to the disks. You will normally want to sum these counters up to see the total number of pages gathered with physical reads, and then see if SQL Server is driving high disk utilization. It is also possible to divide this number by Page Lookups, which gives the “cache hit ratio”. SQL Server:Buffer Manager – Page Life Expectancy tells how much time a page is expected to be in the cache until it is removed. The behavior changed from SQL Server 2000, and this counter says how many seconds passed since the last attempt to remove some pages out of the cache. Low numbers usually means that pages stay in memory for little time. Thus, it is important to make sure this number never gets consistently low. Usually you multiply the counters “Page Lookups/sec”, “Page Reads/sec” and “Readahead Pages/sec” by 8Kb, and then it gives the total amount of data requested in SQL Server. Tips Most of the time it is useless to watch Page Lookups/sec alone. This number may vary a lot, and won’t tell anything to you. You will want to keep both Page Reads/sec and Readahead Pages/sec in a low threshold. This means that SQL Server won’t stress the disk subsystem. The counter Readahead Pages/sec corresponds to pages retrieved using Table/Index Scans. Unless the server is running heavy reports, it is usually a good opportunity to find resource consuming queries and add appropriate indexes. The counter Pages Writes/sec is usually something done in the background, so there shouldn’t be a concern Every time the counter Page Life Expectancy drops to a lower number, it means some pages are being removed. If this counter keeps close to zero for a long time, it is a clear sign of memory pressure. If both Page Reads/sec and Readahead Pages/sec keep in zero, then Buffer Pool is in the optimum performance and adding memory will not increase the performance related to the database caching. DMV -- how many pages in the buffer pool by database and page type. select db_name(database_id), page_type, count(page_id)as number_pages from sys.dm_os_buffer_descriptors where database_id !=32767 group by database_id, page_type order by database_id -- how many pages in the buffer pool by database select db_name(database_id), count(page_id)as number_pages from sys.dm_os_buffer_descriptors where database_id !=32767 group by database_id order by database_id
  • #11 Buffer Pool Size Configuration – It is possible to set up the minimum and maximum limits for the total size of Buffer Pool. This is achieved through sp_configure by using the parameters “Min Server Memory” and “Max Server Memory”. It can be changed at any time with no need to restart the server. SQL Server Memory Manager operates in two different ways. Static Memory Management – SQL Server uses a fixed amount of memory as defined in sp_configure parameters. When DBA sets it up, both “Min Server Memory” and “Max Server Memory” parameters are configured to the same value. Dynamic Memory Management – Buffer Pool size varies in the range set by “Min Server Memory” and “Max Server Memory” parameters. SQL Server always tries to achieve the “Max Server Memory” unless it receives a notification of memory pressure. The dynamic memory management allows a better resource utilization between SQL Server and Operating System. However, it is always important to keep monitoring the external memory pressure notifications in RING_BUFFER_RESOURCE_MONITOR. If it receives notifications all the time, then it indicates that “Max Server Memory” is set too high. Notice: The buffer pool does not immediately acquire the amount of memory specified in “Min Server Memory”. The buffer pool starts with only the memory required to initialize. As the Database Engine workload increases, it keeps acquiring the memory required to support the workload. The buffer pool does not free any of the acquired memory until it reaches the amount specified in “Min Server Memory”. Once “Min Server Memory” is reached, the buffer pool then uses the standard algorithm to acquire and free memory as needed. The only difference is that the buffer pool never drops its memory allocation below the level specified in “Min Server Memory”. (MSONLY – Depending on the configuration, SQL Server may use different API’s during its startup and it might allocate all the memory at once. If the later happens, then “Min Server Memory” will be honor. This happens when AWE is in use or if it is a 64-bit server) How to monitor Buffer Pool Size? In order to maximize database caching, it is recommended to have Buffer Pool using most of physical memory. SQL Server:Buffer Manager – Total Pages corresponds to the total number of 8-Kb pages consumed by Buffer Pool. The correct way to check the amount of memory is by looking at this counter rather than Task Manager – notice that Task Manager might report wrong values for SQL Server because it reports the “process working set”. SQL Server:Buffer Manager – Target Pages is the ideal size for Buffer Pool calculated by SQL Server. When calculating this number, SQL Server evaluates the amount of Physical Memory (RAM) and Virtual Address Space (VAS). Target pages also reacts to memory pressure. For example, when SQL Server is under memory pressure, the ideal buffer size ( “Target Pages”) decreases accordingly. Afterwards SQL Server will decrease memory consumption until “Total Pages” reaches “Target Pages”. Tips Both Target Pages and Total Pages should obey the limits set up by “Min Server Memory” and “Max Server Memory” parameters In a dedicated SQL Server machine, Target Pages should be close to the amount of Physical Memory (RAM) or to the “Max Server Memory” parameter. The counter Target Pages is normally limited by Virtual Address Space in 32-bit machines with more than 2GB of memory. Because of it you’ll normally see Target Pages at 208000 pages, or 336000 pages in case /3GB is enabled. If Target Pages is consistently decreasing over time, it indicates an external memory pressure. This does affect SQL Server performance. If Total Pages is lower than Target Pages, it means that SQL Server hasn’t even allocated all the memory yet. At this moment, adding more memory to SQL Server won’t increase Buffer Pool performance. The larger Buffer Pool is, the more effective the database caching is.
  • #12 BPool Memory Distribution Data Pages – Buffer Pool consumes as much memory as it is allowed, and this memory will be primarily used for caching Data Pages. There are times that Buffer Pool performance isn’t good, even though it had already achieved its maximum size (Total = Target pages). At this moment, there is no room left to grow and the internal Buffer Pool mechanism will start discarding pages with little usage. Stolen Pages – SQL memory manager relies on Buffer Pool to provide memory allocation to internal components as well. For example, the components below request memory from Buffer Pool. Connection Procedure Cache SQL Optimizer In order to satisfy these requests, Buffer Pool internally uses its own 8Kb Pages. The pages just allocated became unusable for database caching, and are considered as stolen pages. Thus, the term “stolen pages” corresponds to pages that are already assigned to some component until it is released. Free Pages – SQL Server has to keep a minimum amount of free pages available. These pages will be used for further requests, meanwhile a background task will free up more pages. How to monitor Buffer Pool Size? The goal of looking into Buffer Pool memory distribution is to tell whether Buffer Pool is being mainly used for database caching. There are certain cases that internal SQL Server components stole most of pages available, and then it leaves a small amount of memory to Data Pages. SQL Server:Buffer Manager – Database Pages – This shows the number of pages for database caching. SQL Server:Buffer Manager – Stolen Pages – This shows the number of pages stolen SQL Server:Buffer Manager – Free Pages – This shows the number of free pages Tips You’ll normally want to compare the counters Database Pages and Total Pages, and make sure Buffer Pool is mainly used for database caching SQL Server might show up Free Pages varying between 100-5000, and this is a normal behavior A high number of Free pages indicates the server has plenty of memory, and adding physical memory won’t improve database caching performance Having a high number of Stolen Pages does not necessarily mean a problem. If a server needs a huge Procedure Cache or a large amount of memory for Query Execution, then it will consume Stolen Pages. The next step is to investigate the memory distribution among the Memory Clerks.
  • #13 Buffer Pool Extension In 32-bit servers, it is common to run into lack of Virtual Address Space because processes are bounded to 4GB. However, Windows API exposes a mechanism called Address Windowing Extensions (AWE). SQL Server takes advantage of this API in order to go beyond the Virtual Address Space limit. The discussion in this slide doesn’t apply to 64-bit environment because the Virtual Address Space is much larger. AWE – Address Windowing Extensions (AWE) is a mechanism of memory management to allow applications to address more memory than the 4 GB that is available through standard 32-bit addressing. AWE lets applications acquire physical memory, and then dynamically map views of this memory to the 32-bit address space. Using AWE does have an additional overhead compared to the plain memory in 64-bit environments, but storing data is still faster in AWE rather than in disk. In order to take advantage of AWE and perform direct allocations of physical memory, the service account used by SQL Server needs to have the “Lock Pages in Memory” privilege. Differently from its previous version, SQL Server 2005 allows the server to be configured with Dynamic Memory Management. This also requires the server to be running on Windows 2003, which has several enhancements in AWE mechanism – In Windows 2000, such a dynamic usage of AWE would be prohibitive due to the high costs. Comparison – Standard 32-bit addresses can map a maximum of 4 GB of memory. The standard address spaces of 32-bit Microsoft Windows NT® 4.0 and Windows 2000 processes are therefore limited to 4-GB. By default, 2 GB is reserved for the operating system, and 2 GB is made available to the application. When to use /3GB or AWE? /3GB alone doesn’t allow SQL Server to see more than 3GB of physical memory /3GB increases the Virtual Address Space. Procedure Cache will take advantage of this setting since it uses Stolen Pages. Enabling /3GB will consume additional Kernel Resource such as Page Table Entries (PTE) Machines with more than 16GB cannot use /3GB due to lack of PTE AWE allow SQL Server to use more than 4GB of memory The impact of AWE over the number of PTE is low Procedure Cache doesn’t get a direct benefit from AWE because AWE is used only for data pages Mapping/Unmapping pages have additional overhead Can I use both together? Yes. If you want to use more than 4GB and also have a larger Virtual Address Space, then you should use AWE and 3GB at the same time. However, this indicates the server should be migrated to 64-bit.
  • #14 Aging Buffers SQL Server 2005 manages the buffer pool using a least recently used algorithm. Worker threads can age buffers out of cache. SQL Server also has dedicated thread/s called the lazywriter which help manage the buffer pool. The lazywriter process sleeps for an interval of time. When it is restarted, it checks the size of the free buffer list. If the free buffer list is below a certain point (dependent on the size of the cache) the lazywriter process scans the buffer cache to reclaim unused pages and write dirty pages that have a reference count of 0 to make them available to new data pages, or for use by one of the memory managers. The lazywriter process also deallocates an object if the memory manager requires memory and all available memory is currently in use and the age field for the object is 0. Buffers with any of these attributes can not be removed: Any buffer which is currently latched—this means somebody is currently reading/modifying the page. A buffer indicating that an IO is in progress. A buffer indicating it is a page from a table/index which was pinned via DBCC PINTABLE. Dirty buffers whose corresponding log records have not been written to disk. Remember that SQL Server maintains a write-ahead log, and the log pages must be flushed to disk before the associated data page(s) affected to ensure the ability to recover. Buffers without the BUF_ONLRU bit set (buffers stolen to be used for procedure cache may have this, but other stolen buffers will not) A “reference count” (i.e., cost) greater than zero after dividing the current reference count by four. Once the lazywriter finds an eligible buffer, it checks whether the buffer is dirty. If it isn’t, it can simply be unhashed and freed; otherwise an asynchronous write is posted so the buffer can be freed up later. On systems with AWE enabled, the buffer might be unmapped (even if it is dirty) from the address space rather than being freed. The lazywriter always checks 16 buffers at a time. Once sufficient free buffers are available it goes to sleep until the next check a second later. If it must resume its search for free buffers, it starts off at the point that it last stopped. When it reaches the end of the BUF array, it “wraps” back around to the beginning and starts over. This is why it is sometimes referred to as a clock, “sweeping” around through the buffers in a cyclical fashion. If the system is running with AWE enabled, the lazywriter works aggressively to limit the count of stolen buffers to 75% of the address space.
  • #15 Perfmon
  • #16 Internal SQL Server Allocations SQL Server components such as Procedure Cache and CLR Hosting request memory from SQL Server Memory Manager. In order to keep track of the amount of memory allocated, the components have to go through a “Memory Clerk”. For example, Procedure Cache uses distinct Memory Clerks depending on the data to be cached – memory for Object Plans is acquired from a Memory Clerk, whereas AdHoc Plans comes from another one. There isn’t a fixed relationship between the components and Memory Clerks. One component may use several Memory Clerks, and some other memory clerks are shared among different components. Memory Clerk maintains statistics information about how much memory has been allocated, and will also receive notification about memory shortages. The notifications are broadcasted by Resource Monitor to all Memory Clerks, and that is a warning that server is under memory pressure. Each memory clerk will implement the appropriate action to these notifications. Eg, Scheduler can reduce the number of threads, CLR will start Garbage Collector, Buffer Pool will release AWE pages, Cache Store will use Clock Hand algorithm to remove unused entries, and some may even ignore the notification.
  • #17 Allocation Statistics Examples of Memory Clerk types: CACHESTORE_OBJCP CACHESTORE_SQLCP CACHESTORE_PHDR CACHESTORE_XPROC Procedure cache, for example, uses these memory clerks to cache data. The advantage of having Memory Clerk is that they will have an appropriate reaction when the machine is out of memory. Internally SQL Node has different methods to serve memory. Single Page Allocator Multi Page Allocator Virtual Memory Interface Shared Memory Interface If you want to find out how much memory a specific Memory Clerk is using, then you should sum up the memory allocated from each method. The query below shows which Memory Clerk are consuming most of the memory. SELECT type MemoryClerk, sum( single_pages_kb + multi_pages_kb + virtual_memory_committed_kb + shared_memory_committed_kb ) total_kb FROM sys.dm_os_memory_clerks GROUP BY type ORDER BY total_kb DESC
  • #18 Memory Allocation Single Page Allocator is a method to allocate memory from Buffer Pool. Because of it the memory allocated has always 8Kb (page size), and the page is marked as Stolen in Buffer Pool. Multi Page Allocator uses SQL Node to allocate block of memory greater than 8Kb, and these allocations come outside from Buffer Pool. This is the common way to allocate more than 8Kb. Virtual Memory interface allows a component to allocate large amount of memory through Windows API. The allocated memory always falls off Buffer Pool. In general, internal components use Virtual Memory to allocate a large chunk of data and then provide its own memory management on it. Shared Memory Interface allows the component to reuse a memory block that is already in use, instead of allocating a new block. Few components use it. MEMORYCLERK_SQLBUFFERPOOL – This Memory Clerk corresponds to Buffer Pool. It uses memory allocated through Virtual Memory interface – check both Reserved and Committed columns. Buffer Pool also listens for Resource Monitor notifications, and it will react appropriately when there is an External Memory Pressure. This Memory Clerk has another interesting behavior – it serves pages to Single Page Allocator requests, and mark the pages as stolen. The query below shows how to calculate the number of stolen pages per Memory Clerk. SELECT type MemoryClerk, sum( single_pages_kb ) stolen_kb FROM sys.dm_os_memory_clerks GROUP BY type ORDER BY stolen_kb DESC Outside from Buffer Pool – All allocations for Multi Page Allocator, Virtual Memory Interface and Shared Memory interface don’t go to Buffer Pool. In 32-bit machines, Buffer Pool normally occupies all the Virtual Address Space and leaves some space to the other components. Sometimes this space is referred as Memory To Reserve. Use the query below to see which component is using most of Memory To Reserve space. SELECT type MemoryClerk, sum( multi_pages_kb + virtual_memory_committed_kb + shared_memory_committed_kb ) OutsideBP_kb FROM sys.dm_os_memory_clerks WHERE type &amp;lt;&amp;gt; &amp;apos;MEMORYCLERK_SQLBUFFERPOOL&amp;apos; GROUP BY type ORDER BY OutsideBP_kb DESC Unfortunately, direct memory allocation performed without using Memory Clerks will not show up in this list. This normally happens with Extended Stored Procedures or third party DLL’s loaded in SQL Server process.
  • #19 select type,sum(single_pages_kb + multi_pages_kb + virtual_memory_committed_kb) memsize from sys.dm_os_memory_clerks group by type order by memsize desc select * from sys.dm_os_memory_clerks where type=&amp;apos;CACHESTORE_SQLCP&amp;apos; select * from sys.dm_os_memory_cache_hash_tables where type=&amp;apos;CACHESTORE_SQLCP&amp;apos; select * from sys.dm_os_memory_cache_clock_hands where type=&amp;apos;CACHESTORE_SQLCP&amp;apos; select * from sys.dm_os_ring_buffers where ring_buffer_type=&amp;apos;RING_BUFFER_RESOURCE_MONITOR&amp;apos; and timestamp&amp;gt;4670856 select type,sum(single_pages_kb + multi_pages_kb + virtual_memory_committed_kb) memsize from sys.dm_os_memory_clerks group by type order by memsize desc declare @i int declare @str nvarchar(max) set @i = 100000 while 1=1 begin set @str = cast(@i as nvarchar) set @str = N&amp;apos;sp_executesql N&amp;apos;&amp;apos;select 1 from pubs..authors (NOLOCK) where 1=2 &amp;apos; + space(2000) + &amp;apos;-- &amp;apos; + @str + N&amp;apos;&amp;apos;&amp;apos;&amp;apos; set @i = @i + 1 exec (@str) print @str -- waitfor delay &amp;apos;0:0:1&amp;apos; end select * from syscacheobjects
  • #22 All notifications from resource monitor Custom memory clerk
  • #25 Sys.dm_os_memory_pools