SlideShare a Scribd company logo
Southern Company

1st Quarter 2007 Earnings

       March 31, 2007

                     Contents
   Press Release                       1
   Business Outlook                    4
   Financial Highlights                7
   Significant Factors Affecting EPS   7
   Analysis of Consolidated Earnings   8
   Kilowatt-Hour Sales                 8
   Financial Overview                  9
News


Media Contact:         Terri Cohilas
                       404-506-5333 or 1-866-506-5333
                       media@southerncompany.com
                       www.southerncompany.com

Investor Relations Contact:
                    Glen Kundert
                    404-506-5135
                       gakunder2@southernco.com

                                                                     April 26, 2007


                 Population growth and robust economy drive
                  Southern Company’s first quarter earnings
ATLANTA – Southern Company today reported first quarter earnings of $338.7 million,
or 45 cents a share, compared with $261.6 million, or 35 cents a share, in the same period
a year ago.

“The population growth in the Southeast is a reflection of our robust regional economy.
Economic development in the Southeast is strong, the job market is vibrant, income
levels have increased, and our housing market is outperforming the nation as a whole,”
said David M. Ratcliffe, Southern Company chairman, president and CEO.

The result for the company has been increases in residential and commercial customers
and electricity usage. Southern Company has added 70,000 customers since the end of
the first quarter in 2006, a 1.7 percent increase. Total kilowatt-hour sales to Southern
Company’s customers in the Southeast, including wholesale sales, grew 6.7 percent in the
first quarter, compared with the previous year. These positive earnings drivers were offset
in part by higher interest costs.

“We maintain our commitment to deliver superior service to customers and excellent
results to shareholders. We’re excited about the growth in our region and we’re
committed to investing in our infrastructure to ensure that we maintain high reliability.
We’re also meeting increasing demand with cleaner electricity by installing new
environmental controls at our facilities. And, we’re working hard to keep our costs to
customers well below the national average,” Ratcliffe said.
Excluding the financial impact of the synthetic fuel business, first quarter earnings per
share were 41 cents, compared with 34 cents in the first quarter of 2006.

Revenues for the first quarter were $3.41 billion, compared with $3.06 billion in the same
period a year ago, an 11.3 percent increase.

Kilowatt-hour sales to retail customers in Southern Company’s four-state service area
increased 3.3 percent in the first quarter, compared with 2006. Residential electricity use
increased 6.4 percent. Electricity use by commercial customers increased 5.1 percent,
while industrial sales decreased 1.0 percent.

With 4.3 million customers and more than 42,000 megawatts of generating capacity,
Atlanta-based Southern Company (NYSE: SO) is the premier energy company serving
the Southeast, one of America’s fastest-growing regions. A leading U.S. producer of
electricity, Southern Company owns electric utilities in four states and a growing
competitive generation company, as well as fiber optics and wireless communications.
Southern Company brands are known for excellent customer service, high reliability and
retail electric prices that are significantly below the national average. Southern Company
has been listed the top ranking U.S. electric service provider in customer satisfaction for
seven consecutive years by the American Customer Satisfaction Index (ACSI). Visit our
Web site at www.southerncompany.com.

Forward Looking Statements Note:
Certain information contained in this release is forward-looking information based on current
expectations and plans that involve risks and uncertainties. Forward-looking information
includes, among other things, statements concerning results of operations, customer and
economic growth, capital investments, retail rates and Southern Company’s strategies. Southern
Company cautions that there are certain factors that can cause actual results to differ materially
from the forward-looking information that has been provided. The reader is cautioned not to put
undue reliance on this forward-looking information, which is not a guarantee of future
performance and is subject to a number of uncertainties and other factors, many of which are
outside the control of Southern Company; accordingly, there can be no assurance that such
suggested results will be realized. The following factors, in addition to those discussed in
Southern Company’s Annual Report on Form 10-K for the year ended Dec. 31, 2006, and
subsequent securities filings, could cause results to differ materially from management
expectations as suggested by such forward-looking information: the impact of recent and future
federal and state regulatory change, including legislative and regulatory initiatives regarding
deregulation and restructuring of the electric utility industry and implementation of the Energy
Policy Act of 2005, and also changes in environmental, tax and other laws and regulations to
which Southern Company and its subsidiaries are subject, as well as changes in application of
existing laws and regulations; current and future litigation, regulatory investigations,
proceedings or inquiries, including the pending EPA civil actions against certain Southern
Company subsidiaries, FERC matters, IRS audits and Mirant-related matters; the effects, extent
and timing of the entry of additional competition in the markets in which Southern Company’s
subsidiaries operate; variations in demand for electricity, including those relating to weather, the
general economy and population and business growth (and declines); available sources and costs
of fuels; ability to control costs; investment performance of Southern Company’s employee
benefit plans; advances in technology; state and federal rate regulations and the impact of
pending and future rate cases and negotiations, including rate actions relating to fuel and storm
restoration cost recovery; the performance of projects undertaken by the non-utility businesses
and the success of efforts to invest in and develop new opportunities; fluctuations in the level of
oil prices; the level of production, if any, by the synthetic fuel operations at Carbontronics
Synfuels Investors LP and Alabama Fuel Products LLC for fiscal year 2007; internal
restructuring or other restructuring options that may be pursued; potential business strategies,
including acquisitions or dispositions of assets or businesses, which cannot be assured to be
completed or beneficial to Southern Company or its subsidiaries; the ability of counterparties of
Southern Company and its subsidiaries to make payments as and when due; the ability to obtain
new short- and long-term contracts with neighboring utilities; the direct or indirect effect on
Southern Company’s business resulting from terrorist incidents and the threat of terrorist
incidents; interest rate fluctuations and financial market conditions and the results of financing
efforts, including Southern Company’s and its subsidiaries’ credit ratings; the ability of Southern
Company and its subsidiaries to obtain additional generating capacity at competitive prices;
catastrophic events such as fires, earthquakes, floods, hurricanes, pandemic health events such as
an avian influenza or other similar occurrences; the direct or indirect effects on Southern
Company’s business resulting from incidents similar to the August 2003 power outage in the
Northeast; and the effect of accounting pronouncements issued periodically by standard-setting
bodies. Southern Company and its subsidiaries expressly disclaim any obligation to update any
forward-looking information.

                                               ###
Page   4

                      2007 Business Outlook

           Financial Goals                                         Our Focus in 2007
Earnings Per Share Growth –                      Near term:
Regular, predictable, sustainable;
                                                    Georgia Power retail rate case
average 5% over the long term, with
                                                    Capital projects, including a $4.6 billion
annual growth within a 4-6% range
                                                    environmental construction program over
2007 Guidance, ex-synfuel: $2.13 to $2.18
                                                    the next 3 years
 ($2.18 to $2.25, including synfuel)
                                                 On-going and Long term:
Return on Equity - Top quartile of
electric utilities                                  Continued industry-leading reliability and
                                                    customer satisfaction, while maintaining
Dividend Growth – Since 2005,
                                                    our low retail prices relative to the
annual growth of approximately 4%.
                                                    national average
Long-term growth consistent with a
                                                    Meeting increased energy demand with
targeted dividend payout ratio range of
                                                    the best economic and environmental
70-75%
                                                    choices
Financial Integrity – Achieve an
                                                    Continuing to deliver on our value
attractive risk-adjusted return, supported
                                                    proposition: superior risk-adjusted total
by a low-risk business model, sound
                                                    shareholder return
financial policy, and a stable 'A' credit
rating


    Our Major Businesses                               How We Do Business
Our Four Traditional Operating
                                                                 SouthernStyle
Companies
                                                                        Unquestionable Trust
   Alabama Power, Georgia Power, Gulf
                                                                        Superior Performance
   Power, Mississippi Power
   Over 4.3 million retail electric                                     Total Commitment
   customers with expected customer
   growth of 1.7% and 2.0% territorial
   demand growth
                                               Constructive
   Over 35,000 MW of nameplate                                              Healthy Capital
                                                Regulation                    Spending
   generation capacity
                                                          Customers
   Over 4,300 MW of capacity under
   long-term wholesale contracts
Southern Power Company                                        High Reliability
                                                                Low Prices
   Over 6,700 MW of gas-fired,                                High Customer
   generation capacity                                         Satisfaction

   Near-term construction projects
   include new units at plants Franklin,
   Oleander and Stanton


        See caution regarding forward-looking statements on page six of this document
Page     5

                        2007 Business Outlook
                          Financial Information

                              Forecast Data (in billions)
                                 ‘07-‘09       Capital Expenditures                      ‘07-‘09
Sources of Cash                                New Generation                               $0.7
Net Operating Cash Flow           $11.0        Fossil/Hydro Retrofits                           1.0
Common Equity                        1.5       Environmental                                    4.6
Net Debt and Preferred               4.6       Nuclear Fuel & Retrofits                         0.7
     Total Sources                $17.1        Transmission                                     1.5
                                               Distribution                                     2.3
Uses of Cash                                   Other/General                                    0.6
Capital Expenditures              $13.2               Traditional Operating Cos           $11.4
Common Dividends                     3.9       Southern Power                                   1.6
     Total Uses                   $17.1        Other                                            0.2
                                                      Total                               $13.2


Senior Unsecured       Alabama      Georgia     Gulf      Mississippi     Southern      Southern
 Credit Ratings         Power       Power      Power        Power          Power        Company
      S&P                A            A           A            A           BBB+            A-
    Moody’s              A2           A2         A2            A1          Baa1           A3
      Fitch              A+           A+          A            AA-         BBB+            A


                   2006 Key Metrics (unaudited, in millions)

                                      Total          Net           Return on      Operating
                                    Revenues       Income          Avg Equity     Cash Flow
Traditional Operating Cos            $13,920          $1,462          13.5%          $2,549
Southern Company                     $14,356          $1,573          14.3%          $2,820
                                       Total          Total           Total          Common
                                      Assets          Debt          Pref Stock        Equity
Traditional Operating Cos            $38,825       $12,440            $744           $11,303
Southern Company                     $42,858       $15,861            $744           $11,371


        See caution regarding forward-looking statements on page six of this document
Page   6
Caution Regarding Forward-Looking Statements

       The information contained in this 2007 Business Outlook is forward-looking information
based on current expectations and plans that involve risks and uncertainties. Southern Company
cautions that there are certain factors that can cause actual results to differ materially from the
forward-looking information that has been provided. The reader is cautioned not to put undue
reliance on this forward-looking information, which is not a guarantee of future performance and is
subject to a number of uncertainties and other factors, many of which are outside of the control of
Southern Company; accordingly, there can be no assurance that such suggested results will be
realized.

         The following factors, in addition to those discussed in Southern Company’s Annual Report
on Form 10-K for the year ended December 31, 2006, and subsequent securities filings, could
cause actual results to differ materially from management expectations as suggested by such
forward-looking information: the impact of recent and future federal and state regulatory change,
including legislative and regulatory initiatives regarding deregulation and restructuring of the
electric utility industry and implementation of the Energy Policy Act of 2005, and also changes in
environmental, tax and other laws and regulations to which Southern Company and its subsidiaries
are subject, as well as changes in application of existing laws and regulations; current and future
litigation, regulatory investigations, proceedings or inquiries, including the pending EPA civil actions
against certain Southern Company subsidiaries, FERC matters, IRS audits and Mirant-related
matters; the effects, extent and timing of the entry of additional competition in the markets in
which Southern Company’s subsidiaries operate; variations in demand for electricity, including
those relating to weather, the general economy and population and business growth (and
declines); available sources and costs of fuels; ability to control costs; investment performance of
Southern Company’s employee benefit plans; advances in technology; state and federal rate
regulations and the impact of pending and future rate cases and negotiations, including rate
actions relating to fuel and storm restoration cost recovery; the performance of projects
undertaken by the non-utility businesses and the success of efforts to invest in and develop new
opportunities; fluctuations in the level of oil prices; the level of production, if any, by the synthetic
fuel operations at Carbontronics Synfuels Investors LP and Alabama Fuel Products LLC for fiscal
year 2007; internal restructuring or other restructuring options that may be pursued; potential
business strategies, including acquisitions or dispositions of assets or businesses, which cannot be
assured to be completed or beneficial to Southern Company or its subsidiaries; the ability of
counterparties of Southern Company and its subsidiaries to make payments as and when due; the
ability to obtain new short- and long-term contracts with neighboring utilities; the direct or indirect
effect on Southern Company’s business resulting from terrorist incidents and the threat of terrorist
incidents; interest rate fluctuations and financial market conditions and the results of financing
efforts, including Southern Company’s and its subsidiaries’ credit ratings; the ability of Southern
Company and its subsidiaries to obtain additional generating capacity at competitive prices;
catastrophic events such as fires, earthquakes, floods, hurricanes, pandemic health events such as
an avian influenza, or other similar occurrences; the direct or indirect effects on Southern
Company’s business resulting from incidents similar to the August 2003 power outage in the
Northeast; and the effect of accounting pronouncements issued periodically by standard-setting
bodies. Southern Company and its subsidiaries expressly disclaim any obligation to update any
forward-looking information.
Page 7
                                    Southern Company
                                    Financial Highlights
                         (In Millions of Dollars Except Earnings Per Share)

                                                             3 Months Ended March
                                                               2007        2006
                                                             (Notes)      (Notes)
Consolidated Earnings–As Reported
(See Notes)
                                                            $     285      $      242
 Traditional Operating Companies
 Southern Power                                                    32              20
   Total                                                          317             262
 Synthetic Fuels                                                   28               8
 Leasing Business                                                   1               6
                                                                   (7)            (14)
 Parent Company and Other
                                                            $     339      $      262
 Net Income - As Reported
                                                                 0.45      $     0.35
                                                            $
 Basic Earnings Per Share - (See Notes)

                                                            $    3,409     $     3,063
 Operating Revenues
                                                                   750             742
 Average Shares Outstanding (in millions)
                                                                   752             742
 End of Period Shares Outstanding (in millions)

                                                             3 Months Ended March
                                                               2007        2006
Consolidated Earnings–Excluding Synfuels
(See Notes)
                                                            $     339      $      262
 Net Income - As Reported
                                                                  (28)             (8)
 Less: Synthetic Fuels
                                                            $     311      $      254
 Net Income–Excluding Synthetic Fuels


                                                            $    0.41      $     0.34
 Basic Earnings Per Share–Excluding Synfuels


                           Significant Factors Impacting EPS
                                                             3 Months Ended March
                                                               2007        2006                Change

                                                            $    0.45            0.35      $     0.10
                                                                           $
Consolidated Earnings–As Reported
(See Notes)
 Significant Factors:
                                                                                                 0.05
 Traditional Operating Companies
                                                                                                 0.02
 Southern Power
                                                                                                 0.03
 Synthetic Fuels
                                                                                                (0.01)
 Leasing
                                                                                                 0.01
 Parent Company and Other
                                                                                           $     0.10
  Total–As Reported


                                                             3 Months Ended March
                                                               2007        2006                Change

                                                            $    0.41            0.34      $     0.07
                                                                           $
Consolidated Earnings–Excluding Synfuels
(See Notes)
                                                                                                 0.10
 Total–As Reported
                                                                                                (0.03)
 Less: Synthetic Fuels
                                                                                           $     0.07
  Total–Excluding Synthetic Fuels

  Notes
  - For the first quarters 2007 and 2006, diluted earnings per share was less than 1 cent.
  - Tax credits associated with Southern Company's synthetic fuel investments expire December 31, 2007
    and will not contribute to Southern Company's earnings and earnings per share after 2007.
  - Certain prior year data has been reclassified to conform with current year presentation.
  - Information contained in this report is subject to audit and adjustments. Certain classifications may be different
    from final results published in the Form 10-Q.
Southern Company
                                                                                         Page 8
                       Analysis of Consolidated Earnings
                                  (In Millions of Dollars)

                                                         3 Months Ended March
                                                  2007            2006        Change
Income Account-
Retail Revenue                                                  $     2,471      $      273
                                              $      2,744
Wholesale Revenue                                                       415              66
                                                       481
Other Electric Revenues                                                 111              10
                                                       121
Non-regulated Operating Revenues                                         66              (3)
                                                        63
Total Revenues                                                        3,063             346
                                                     3,409
Fuel and Purchased Power                                              1,153             228
                                                     1,381
Non-fuel O & M                                                          846               2
                                                       848
Depreciation and Amortization                                           299               7
                                                       306
Taxes Other Than Income Taxes                                           175               8
                                                       183
Total Operating Expenses                                              2,473             245
                                                     2,718
Operating Income                                                        590             101
                                                       691
Other Income, net                                                        (4)             36
                                                        32
Interest Charges and Dividends                                          216              12
                                                       228
Income Taxes                                                            108              48
                                                       156
                                              $                 $        262     $        77
                                                       339
NET INCOME (See Notes)


                                 Kilowatt-Hour Sales
                                   (In Millions of KWHs)

                                                       3 Months Ended March
As Reported (See Notes)                           2007          2006        Change
Kilowatt-Hour Sales-
                                                   48,286            45,270            6.7%
   Total Sales

                                                   38,040            36,821            3.3%
   Total Retail Sales-
                                                   12,464            11,716            6.4%
    Residential
                                                   12,276            11,682            5.1%
    Commercial
                                                   13,060            13,187           -1.0%
    Industrial
                                                      240               236            1.6%
    Other

                                                   10,246             8,449           21.3%
   Total Wholesale Sales


   Notes
   - Certain prior year data has been reclassified to conform with current year presentation.
   - Information contained in this report is subject to audit and adjustments and certain
     classifications may be different from final results published in the Form 10-Q.
Page 9
                             Southern Company
                             Financial Overview
                               (In Millions of Dollars)

                                                            3 Months Ended March
                                                         2007       2006   % Change

Consolidated –
 Operating Revenues                                  $ 3,409      $ 3,063         11.3%
 Earnings Before Income Taxes                            494          370         33.7%
 Net Income                                          $   339      $   262         29.5%

Alabama Power –
 Operating Revenues                                  $ 1,197      $ 1,073         11.6%
 Earnings Before Income Taxes                            196          142         38.3%
 Net Income Available to Common                      $   115      $    82         39.9%

Georgia Power –
 Operating Revenues                                  $ 1,657      $ 1,584           4.6%
 Earnings Before Income Taxes                            203          214          -5.0%
 Net Income Available to Common                      $   131      $   132          -0.5%

Gulf Power –
 Operating Revenues                                  $     296    $    263        12.6%
 Earnings Before Income Taxes                               31          21        48.7%
 Net Income Available to Common                      $      19    $     12        52.1%

Mississippi Power –
 Operating Revenues                                  $     257    $    209        22.9%
 Earnings Before Income Taxes                               32          25        29.9%
 Net Income Available to Common                      $      20    $     15        28.5%

Southern Power –
 Operating Revenues                                  $     192    $    140        37.7%
 Earnings Before Income Taxes                               54          32        64.8%
 Net Income Available to Common                      $      32    $     20        61.0%

 Notes
 - Certain prior year data has been reclassified to conform with current year presentation
 - Information contained in this report is subject to audit and adjustments and certain
   classifications may be different from final results published in the Form 10-Q.

More Related Content

What's hot

QTS Q4 2020 Earnings Presentation
QTS Q4 2020 Earnings PresentationQTS Q4 2020 Earnings Presentation
QTS Q4 2020 Earnings Presentation
Kelly Michael
 
Earnings executive commentary 3 q 2017
Earnings executive commentary 3 q 2017Earnings executive commentary 3 q 2017
Earnings executive commentary 3 q 2017
franklinresources
 
AES 50th Annual EEI Financial Conference
AES 50th Annual EEI Financial ConferenceAES 50th Annual EEI Financial Conference
AES 50th Annual EEI Financial Conference
AES_BigSky
 
Q1 16 operations report - final
Q1 16 operations report - finalQ1 16 operations report - final
Q1 16 operations report - final
EnLinkMidstreamLLC
 
Wolfe Power & Gas Leaders Presentation
Wolfe Power & Gas Leaders PresentationWolfe Power & Gas Leaders Presentation
Wolfe Power & Gas Leaders Presentation
AES_BigSky
 
AES Q2 2016 Financial Review
AES Q2 2016 Financial Review AES Q2 2016 Financial Review
AES Q2 2016 Financial Review
AES_BigSky
 
Investor roadshow presentation may 2017 final
Investor roadshow presentation  may 2017 finalInvestor roadshow presentation  may 2017 final
Investor roadshow presentation may 2017 final
TrueBlueInc
 
Investor Day Presentation
Investor Day PresentationInvestor Day Presentation
Investor Day Presentation
Investor_Meredith
 
Pfizer Q2 2017 Earnings Charts
Pfizer Q2 2017 Earnings ChartsPfizer Q2 2017 Earnings Charts
Pfizer Q2 2017 Earnings Charts
pfizer_ir
 
Access Midstream Partners Investor Presentation - July 2013
Access Midstream Partners Investor Presentation - July 2013 Access Midstream Partners Investor Presentation - July 2013
Access Midstream Partners Investor Presentation - July 2013
Kprelosky
 
11 03-17 eei final
11 03-17 eei final11 03-17 eei final
11 03-17 eei final
AES_BigSky
 
AES Q1 2016 Financial Review FINAL
AES Q1 2016 Financial Review FINALAES Q1 2016 Financial Review FINAL
AES Q1 2016 Financial Review FINAL
AES_BigSky
 
.integrysgroup company update
.integrysgroup company update.integrysgroup company update
.integrysgroup company updatefinance26
 
06 26-16 jpm energy conference final
06 26-16 jpm energy conference final06 26-16 jpm energy conference final
06 26-16 jpm energy conference final
AES_BigSky
 
Evercore Investor Presentation
Evercore Investor PresentationEvercore Investor Presentation
Evercore Investor Presentation
Evercore Investor Relations
 
Wrk mar 2017 investor presentation final
Wrk mar 2017 investor presentation finalWrk mar 2017 investor presentation final
Wrk mar 2017 investor presentation final
ir_westrock
 
Q2 presentation v2
Q2 presentation v2Q2 presentation v2
Q2 presentation v2
Corning_Owens
 
August Investor Presentation
August Investor PresentationAugust Investor Presentation
August Investor Presentation
Devon Energy Corporation
 
dte_1Q2007ER
dte_1Q2007ERdte_1Q2007ER
dte_1Q2007ERfinance41
 
Tds annual meeting of shareholders final
Tds annual meeting of shareholders finalTds annual meeting of shareholders final
Tds annual meeting of shareholders final
TelephoneDataSystems
 

What's hot (20)

QTS Q4 2020 Earnings Presentation
QTS Q4 2020 Earnings PresentationQTS Q4 2020 Earnings Presentation
QTS Q4 2020 Earnings Presentation
 
Earnings executive commentary 3 q 2017
Earnings executive commentary 3 q 2017Earnings executive commentary 3 q 2017
Earnings executive commentary 3 q 2017
 
AES 50th Annual EEI Financial Conference
AES 50th Annual EEI Financial ConferenceAES 50th Annual EEI Financial Conference
AES 50th Annual EEI Financial Conference
 
Q1 16 operations report - final
Q1 16 operations report - finalQ1 16 operations report - final
Q1 16 operations report - final
 
Wolfe Power & Gas Leaders Presentation
Wolfe Power & Gas Leaders PresentationWolfe Power & Gas Leaders Presentation
Wolfe Power & Gas Leaders Presentation
 
AES Q2 2016 Financial Review
AES Q2 2016 Financial Review AES Q2 2016 Financial Review
AES Q2 2016 Financial Review
 
Investor roadshow presentation may 2017 final
Investor roadshow presentation  may 2017 finalInvestor roadshow presentation  may 2017 final
Investor roadshow presentation may 2017 final
 
Investor Day Presentation
Investor Day PresentationInvestor Day Presentation
Investor Day Presentation
 
Pfizer Q2 2017 Earnings Charts
Pfizer Q2 2017 Earnings ChartsPfizer Q2 2017 Earnings Charts
Pfizer Q2 2017 Earnings Charts
 
Access Midstream Partners Investor Presentation - July 2013
Access Midstream Partners Investor Presentation - July 2013 Access Midstream Partners Investor Presentation - July 2013
Access Midstream Partners Investor Presentation - July 2013
 
11 03-17 eei final
11 03-17 eei final11 03-17 eei final
11 03-17 eei final
 
AES Q1 2016 Financial Review FINAL
AES Q1 2016 Financial Review FINALAES Q1 2016 Financial Review FINAL
AES Q1 2016 Financial Review FINAL
 
.integrysgroup company update
.integrysgroup company update.integrysgroup company update
.integrysgroup company update
 
06 26-16 jpm energy conference final
06 26-16 jpm energy conference final06 26-16 jpm energy conference final
06 26-16 jpm energy conference final
 
Evercore Investor Presentation
Evercore Investor PresentationEvercore Investor Presentation
Evercore Investor Presentation
 
Wrk mar 2017 investor presentation final
Wrk mar 2017 investor presentation finalWrk mar 2017 investor presentation final
Wrk mar 2017 investor presentation final
 
Q2 presentation v2
Q2 presentation v2Q2 presentation v2
Q2 presentation v2
 
August Investor Presentation
August Investor PresentationAugust Investor Presentation
August Investor Presentation
 
dte_1Q2007ER
dte_1Q2007ERdte_1Q2007ER
dte_1Q2007ER
 
Tds annual meeting of shareholders final
Tds annual meeting of shareholders finalTds annual meeting of shareholders final
Tds annual meeting of shareholders final
 

Viewers also liked

The Visual Marketing Attracts Thousands of Followers
The Visual Marketing Attracts Thousands of FollowersThe Visual Marketing Attracts Thousands of Followers
The Visual Marketing Attracts Thousands of Followers
lukjaya1
 
Onhruush gerin daalgabar
Onhruush gerin daalgabarOnhruush gerin daalgabar
Onhruush gerin daalgabarenhmaa95
 
Press release blackhacknewark
Press release blackhacknewarkPress release blackhacknewark
Press release blackhacknewark
FEMWORKS
 
Lure collection #140-#184
Lure collection #140-#184Lure collection #140-#184
Lure collection #140-#184alexwetzler77
 
Iipcc 2012 ip valuation
Iipcc 2012 ip valuationIipcc 2012 ip valuation
Iipcc 2012 ip valuation
Asia Pacific Cloud Apps Alliance
 
Mis datos
Mis datosMis datos
Mis datosedumont
 
Onhruush gerin daalgabar
Onhruush gerin daalgabarOnhruush gerin daalgabar
Onhruush gerin daalgabarenhmaa95
 

Viewers also liked (7)

The Visual Marketing Attracts Thousands of Followers
The Visual Marketing Attracts Thousands of FollowersThe Visual Marketing Attracts Thousands of Followers
The Visual Marketing Attracts Thousands of Followers
 
Onhruush gerin daalgabar
Onhruush gerin daalgabarOnhruush gerin daalgabar
Onhruush gerin daalgabar
 
Press release blackhacknewark
Press release blackhacknewarkPress release blackhacknewark
Press release blackhacknewark
 
Lure collection #140-#184
Lure collection #140-#184Lure collection #140-#184
Lure collection #140-#184
 
Iipcc 2012 ip valuation
Iipcc 2012 ip valuationIipcc 2012 ip valuation
Iipcc 2012 ip valuation
 
Mis datos
Mis datosMis datos
Mis datos
 
Onhruush gerin daalgabar
Onhruush gerin daalgabarOnhruush gerin daalgabar
Onhruush gerin daalgabar
 

Similar to southern 2008 1st

southern 2006 4th
southern 2006 4thsouthern 2006 4th
southern 2006 4thfinance17
 
southern 2008 2nd
southern 2008 2ndsouthern 2008 2nd
southern 2008 2ndfinance17
 
southern 2005 1st
southern 2005 1stsouthern 2005 1st
southern 2005 1stfinance17
 
southern 2006 3rd
southern 2006 3rdsouthern 2006 3rd
southern 2006 3rdfinance17
 
southern 2007 4th
southern 2007 4thsouthern 2007 4th
southern 2007 4thfinance17
 
southern 2005 2nd
southern 2005 2ndsouthern 2005 2nd
southern 2005 2ndfinance17
 
southern 2006 1st
southern 2006 1stsouthern 2006 1st
southern 2006 1stfinance17
 
southern 2004 1st
southern 2004 1stsouthern 2004 1st
southern 2004 1stfinance17
 
southern 2004 4th
southern 2004 4thsouthern 2004 4th
southern 2004 4thfinance17
 
southern 2005 4th
southern 2005 4thsouthern 2005 4th
southern 2005 4thfinance17
 
southern 2006 2nd
southern 2006 2ndsouthern 2006 2nd
southern 2006 2ndfinance17
 
southern Earnings Package 2008 1st
southern Earnings Package 2008 1stsouthern Earnings Package 2008 1st
southern Earnings Package 2008 1stfinance17
 
public serviceenterprise group Investor 41508_Izzo
public serviceenterprise group Investor 41508_Izzopublic serviceenterprise group Investor 41508_Izzo
public serviceenterprise group Investor 41508_Izzofinance20
 
southern 2004 2nd
southern 2004 2ndsouthern 2004 2nd
southern 2004 2ndfinance17
 
southern 2003 2nd
southern 2003 2ndsouthern 2003 2nd
southern 2003 2ndfinance17
 
.integrysgroup09/2008_companyupdate
.integrysgroup09/2008_companyupdate.integrysgroup09/2008_companyupdate
.integrysgroup09/2008_companyupdatefinance26
 
energy east EE_AR_2004
energy east EE_AR_2004energy east EE_AR_2004
energy east EE_AR_2004finance40
 
energy east EE_AR_2004
energy east EE_AR_2004energy east EE_AR_2004
energy east EE_AR_2004finance40
 
Evercore ISI Utility CEO Retreat
 Evercore ISI Utility CEO Retreat Evercore ISI Utility CEO Retreat
Evercore ISI Utility CEO Retreat
pinnaclewestcapital
 
southern 2006 Letter to Our Shareholders
southern 2006 Letter to Our Shareholderssouthern 2006 Letter to Our Shareholders
southern 2006 Letter to Our Shareholdersfinance17
 

Similar to southern 2008 1st (20)

southern 2006 4th
southern 2006 4thsouthern 2006 4th
southern 2006 4th
 
southern 2008 2nd
southern 2008 2ndsouthern 2008 2nd
southern 2008 2nd
 
southern 2005 1st
southern 2005 1stsouthern 2005 1st
southern 2005 1st
 
southern 2006 3rd
southern 2006 3rdsouthern 2006 3rd
southern 2006 3rd
 
southern 2007 4th
southern 2007 4thsouthern 2007 4th
southern 2007 4th
 
southern 2005 2nd
southern 2005 2ndsouthern 2005 2nd
southern 2005 2nd
 
southern 2006 1st
southern 2006 1stsouthern 2006 1st
southern 2006 1st
 
southern 2004 1st
southern 2004 1stsouthern 2004 1st
southern 2004 1st
 
southern 2004 4th
southern 2004 4thsouthern 2004 4th
southern 2004 4th
 
southern 2005 4th
southern 2005 4thsouthern 2005 4th
southern 2005 4th
 
southern 2006 2nd
southern 2006 2ndsouthern 2006 2nd
southern 2006 2nd
 
southern Earnings Package 2008 1st
southern Earnings Package 2008 1stsouthern Earnings Package 2008 1st
southern Earnings Package 2008 1st
 
public serviceenterprise group Investor 41508_Izzo
public serviceenterprise group Investor 41508_Izzopublic serviceenterprise group Investor 41508_Izzo
public serviceenterprise group Investor 41508_Izzo
 
southern 2004 2nd
southern 2004 2ndsouthern 2004 2nd
southern 2004 2nd
 
southern 2003 2nd
southern 2003 2ndsouthern 2003 2nd
southern 2003 2nd
 
.integrysgroup09/2008_companyupdate
.integrysgroup09/2008_companyupdate.integrysgroup09/2008_companyupdate
.integrysgroup09/2008_companyupdate
 
energy east EE_AR_2004
energy east EE_AR_2004energy east EE_AR_2004
energy east EE_AR_2004
 
energy east EE_AR_2004
energy east EE_AR_2004energy east EE_AR_2004
energy east EE_AR_2004
 
Evercore ISI Utility CEO Retreat
 Evercore ISI Utility CEO Retreat Evercore ISI Utility CEO Retreat
Evercore ISI Utility CEO Retreat
 
southern 2006 Letter to Our Shareholders
southern 2006 Letter to Our Shareholderssouthern 2006 Letter to Our Shareholders
southern 2006 Letter to Our Shareholders
 

More from finance17

computer sciences equitygrant
computer sciences equitygrantcomputer sciences equitygrant
computer sciences equitygrantfinance17
 
computer sciences By Laws
computer sciences By Lawscomputer sciences By Laws
computer sciences By Lawsfinance17
 
computer sciences Restated
computer sciences Restatedcomputer sciences Restated
computer sciences Restatedfinance17
 
computer sciences Ethics
computer sciences Ethicscomputer sciences Ethics
computer sciences Ethicsfinance17
 
computer sciences Ethics Standards
computer sciences Ethics Standardscomputer sciences Ethics Standards
computer sciences Ethics Standardsfinance17
 
computer sciences Corp Gov Guide lines
computer sciences Corp Gov Guide linescomputer sciences Corp Gov Guide lines
computer sciences Corp Gov Guide linesfinance17
 
computer sciences FY 1997 Q1
computer sciences FY 1997 Q1computer sciences FY 1997 Q1
computer sciences FY 1997 Q1finance17
 
computer sciences FY 1997 Q2
computer sciences FY 1997 Q2computer sciences FY 1997 Q2
computer sciences FY 1997 Q2finance17
 
computer sciences FY 1998 Q1
computer sciences FY 1998 Q1computer sciences FY 1998 Q1
computer sciences FY 1998 Q1finance17
 
computer sciences FY 1998 Q2
computer sciences FY 1998 Q2computer sciences FY 1998 Q2
computer sciences FY 1998 Q2finance17
 
computer sciences FY 1998 Q3
computer sciences FY 1998 Q3computer sciences FY 1998 Q3
computer sciences FY 1998 Q3finance17
 
computer sciences FY 1999 Q1
computer sciences FY 1999 Q1computer sciences FY 1999 Q1
computer sciences FY 1999 Q1finance17
 
computer sciences FY 1999 Q2
computer sciences FY 1999 Q2computer sciences FY 1999 Q2
computer sciences FY 1999 Q2finance17
 
computer sciences FY 1999 Q3
computer sciences FY 1999 Q3computer sciences FY 1999 Q3
computer sciences FY 1999 Q3finance17
 
computer sciences FY 2000 Q1
computer sciences FY 2000 Q1computer sciences FY 2000 Q1
computer sciences FY 2000 Q1finance17
 
computer sciences FY 2000 Q2
computer sciences FY 2000 Q2computer sciences FY 2000 Q2
computer sciences FY 2000 Q2finance17
 
computer sciences FY 2000 Q3
computer sciences FY 2000 Q3computer sciences FY 2000 Q3
computer sciences FY 2000 Q3finance17
 
computer sciences FY 2001 Q1
computer sciences FY 2001 Q1computer sciences FY 2001 Q1
computer sciences FY 2001 Q1finance17
 
computer sciences FY 2001 Q2
computer sciences FY 2001 Q2computer sciences FY 2001 Q2
computer sciences FY 2001 Q2finance17
 
computer sciences FY 2001 Q3
computer sciences FY 2001 Q3computer sciences FY 2001 Q3
computer sciences FY 2001 Q3finance17
 

More from finance17 (20)

computer sciences equitygrant
computer sciences equitygrantcomputer sciences equitygrant
computer sciences equitygrant
 
computer sciences By Laws
computer sciences By Lawscomputer sciences By Laws
computer sciences By Laws
 
computer sciences Restated
computer sciences Restatedcomputer sciences Restated
computer sciences Restated
 
computer sciences Ethics
computer sciences Ethicscomputer sciences Ethics
computer sciences Ethics
 
computer sciences Ethics Standards
computer sciences Ethics Standardscomputer sciences Ethics Standards
computer sciences Ethics Standards
 
computer sciences Corp Gov Guide lines
computer sciences Corp Gov Guide linescomputer sciences Corp Gov Guide lines
computer sciences Corp Gov Guide lines
 
computer sciences FY 1997 Q1
computer sciences FY 1997 Q1computer sciences FY 1997 Q1
computer sciences FY 1997 Q1
 
computer sciences FY 1997 Q2
computer sciences FY 1997 Q2computer sciences FY 1997 Q2
computer sciences FY 1997 Q2
 
computer sciences FY 1998 Q1
computer sciences FY 1998 Q1computer sciences FY 1998 Q1
computer sciences FY 1998 Q1
 
computer sciences FY 1998 Q2
computer sciences FY 1998 Q2computer sciences FY 1998 Q2
computer sciences FY 1998 Q2
 
computer sciences FY 1998 Q3
computer sciences FY 1998 Q3computer sciences FY 1998 Q3
computer sciences FY 1998 Q3
 
computer sciences FY 1999 Q1
computer sciences FY 1999 Q1computer sciences FY 1999 Q1
computer sciences FY 1999 Q1
 
computer sciences FY 1999 Q2
computer sciences FY 1999 Q2computer sciences FY 1999 Q2
computer sciences FY 1999 Q2
 
computer sciences FY 1999 Q3
computer sciences FY 1999 Q3computer sciences FY 1999 Q3
computer sciences FY 1999 Q3
 
computer sciences FY 2000 Q1
computer sciences FY 2000 Q1computer sciences FY 2000 Q1
computer sciences FY 2000 Q1
 
computer sciences FY 2000 Q2
computer sciences FY 2000 Q2computer sciences FY 2000 Q2
computer sciences FY 2000 Q2
 
computer sciences FY 2000 Q3
computer sciences FY 2000 Q3computer sciences FY 2000 Q3
computer sciences FY 2000 Q3
 
computer sciences FY 2001 Q1
computer sciences FY 2001 Q1computer sciences FY 2001 Q1
computer sciences FY 2001 Q1
 
computer sciences FY 2001 Q2
computer sciences FY 2001 Q2computer sciences FY 2001 Q2
computer sciences FY 2001 Q2
 
computer sciences FY 2001 Q3
computer sciences FY 2001 Q3computer sciences FY 2001 Q3
computer sciences FY 2001 Q3
 

Recently uploaded

How to get verified on Coinbase Account?_.docx
How to get verified on Coinbase Account?_.docxHow to get verified on Coinbase Account?_.docx
How to get verified on Coinbase Account?_.docx
Buy bitget
 
how to sell pi coins in South Korea profitably.
how to sell pi coins in South Korea profitably.how to sell pi coins in South Korea profitably.
how to sell pi coins in South Korea profitably.
DOT TECH
 
what is a pi whale and how to access one.
what is a pi whale and how to access one.what is a pi whale and how to access one.
what is a pi whale and how to access one.
DOT TECH
 
Exploring Abhay Bhutada’s Views After Poonawalla Fincorp’s Collaboration With...
Exploring Abhay Bhutada’s Views After Poonawalla Fincorp’s Collaboration With...Exploring Abhay Bhutada’s Views After Poonawalla Fincorp’s Collaboration With...
Exploring Abhay Bhutada’s Views After Poonawalla Fincorp’s Collaboration With...
beulahfernandes8
 
how to sell pi coins on Binance exchange
how to sell pi coins on Binance exchangehow to sell pi coins on Binance exchange
how to sell pi coins on Binance exchange
DOT TECH
 
BYD SWOT Analysis and In-Depth Insights 2024.pptx
BYD SWOT Analysis and In-Depth Insights 2024.pptxBYD SWOT Analysis and In-Depth Insights 2024.pptx
BYD SWOT Analysis and In-Depth Insights 2024.pptx
mikemetalprod
 
US Economic Outlook - Being Decided - M Capital Group August 2021.pdf
US Economic Outlook - Being Decided - M Capital Group August 2021.pdfUS Economic Outlook - Being Decided - M Capital Group August 2021.pdf
US Economic Outlook - Being Decided - M Capital Group August 2021.pdf
pchutichetpong
 
how to sell pi coins on Bitmart crypto exchange
how to sell pi coins on Bitmart crypto exchangehow to sell pi coins on Bitmart crypto exchange
how to sell pi coins on Bitmart crypto exchange
DOT TECH
 
APP I Lecture Notes to students 0f 4the year
APP I  Lecture Notes  to students 0f 4the yearAPP I  Lecture Notes  to students 0f 4the year
APP I Lecture Notes to students 0f 4the year
telilaalilemlem
 
The secret way to sell pi coins effortlessly.
The secret way to sell pi coins effortlessly.The secret way to sell pi coins effortlessly.
The secret way to sell pi coins effortlessly.
DOT TECH
 
655264371-checkpoint-science-past-papers-april-2023.pdf
655264371-checkpoint-science-past-papers-april-2023.pdf655264371-checkpoint-science-past-papers-april-2023.pdf
655264371-checkpoint-science-past-papers-april-2023.pdf
morearsh02
 
This assessment plan proposal is to outline a structured approach to evaluati...
This assessment plan proposal is to outline a structured approach to evaluati...This assessment plan proposal is to outline a structured approach to evaluati...
This assessment plan proposal is to outline a structured approach to evaluati...
lamluanvan.net Viết thuê luận văn
 
Chương 6. Ancol - phenol - ether (1).pdf
Chương 6. Ancol - phenol - ether (1).pdfChương 6. Ancol - phenol - ether (1).pdf
Chương 6. Ancol - phenol - ether (1).pdf
va2132004
 
when will pi network coin be available on crypto exchange.
when will pi network coin be available on crypto exchange.when will pi network coin be available on crypto exchange.
when will pi network coin be available on crypto exchange.
DOT TECH
 
how to swap pi coins to foreign currency withdrawable.
how to swap pi coins to foreign currency withdrawable.how to swap pi coins to foreign currency withdrawable.
how to swap pi coins to foreign currency withdrawable.
DOT TECH
 
USDA Loans in California: A Comprehensive Overview.pptx
USDA Loans in California: A Comprehensive Overview.pptxUSDA Loans in California: A Comprehensive Overview.pptx
USDA Loans in California: A Comprehensive Overview.pptx
marketing367770
 
Empowering the Unbanked: The Vital Role of NBFCs in Promoting Financial Inclu...
Empowering the Unbanked: The Vital Role of NBFCs in Promoting Financial Inclu...Empowering the Unbanked: The Vital Role of NBFCs in Promoting Financial Inclu...
Empowering the Unbanked: The Vital Role of NBFCs in Promoting Financial Inclu...
Vighnesh Shashtri
 
The Evolution of Non-Banking Financial Companies (NBFCs) in India: Challenges...
The Evolution of Non-Banking Financial Companies (NBFCs) in India: Challenges...The Evolution of Non-Banking Financial Companies (NBFCs) in India: Challenges...
The Evolution of Non-Banking Financial Companies (NBFCs) in India: Challenges...
beulahfernandes8
 
how can i use my minded pi coins I need some funds.
how can i use my minded pi coins I need some funds.how can i use my minded pi coins I need some funds.
how can i use my minded pi coins I need some funds.
DOT TECH
 
What price will pi network be listed on exchanges
What price will pi network be listed on exchangesWhat price will pi network be listed on exchanges
What price will pi network be listed on exchanges
DOT TECH
 

Recently uploaded (20)

How to get verified on Coinbase Account?_.docx
How to get verified on Coinbase Account?_.docxHow to get verified on Coinbase Account?_.docx
How to get verified on Coinbase Account?_.docx
 
how to sell pi coins in South Korea profitably.
how to sell pi coins in South Korea profitably.how to sell pi coins in South Korea profitably.
how to sell pi coins in South Korea profitably.
 
what is a pi whale and how to access one.
what is a pi whale and how to access one.what is a pi whale and how to access one.
what is a pi whale and how to access one.
 
Exploring Abhay Bhutada’s Views After Poonawalla Fincorp’s Collaboration With...
Exploring Abhay Bhutada’s Views After Poonawalla Fincorp’s Collaboration With...Exploring Abhay Bhutada’s Views After Poonawalla Fincorp’s Collaboration With...
Exploring Abhay Bhutada’s Views After Poonawalla Fincorp’s Collaboration With...
 
how to sell pi coins on Binance exchange
how to sell pi coins on Binance exchangehow to sell pi coins on Binance exchange
how to sell pi coins on Binance exchange
 
BYD SWOT Analysis and In-Depth Insights 2024.pptx
BYD SWOT Analysis and In-Depth Insights 2024.pptxBYD SWOT Analysis and In-Depth Insights 2024.pptx
BYD SWOT Analysis and In-Depth Insights 2024.pptx
 
US Economic Outlook - Being Decided - M Capital Group August 2021.pdf
US Economic Outlook - Being Decided - M Capital Group August 2021.pdfUS Economic Outlook - Being Decided - M Capital Group August 2021.pdf
US Economic Outlook - Being Decided - M Capital Group August 2021.pdf
 
how to sell pi coins on Bitmart crypto exchange
how to sell pi coins on Bitmart crypto exchangehow to sell pi coins on Bitmart crypto exchange
how to sell pi coins on Bitmart crypto exchange
 
APP I Lecture Notes to students 0f 4the year
APP I  Lecture Notes  to students 0f 4the yearAPP I  Lecture Notes  to students 0f 4the year
APP I Lecture Notes to students 0f 4the year
 
The secret way to sell pi coins effortlessly.
The secret way to sell pi coins effortlessly.The secret way to sell pi coins effortlessly.
The secret way to sell pi coins effortlessly.
 
655264371-checkpoint-science-past-papers-april-2023.pdf
655264371-checkpoint-science-past-papers-april-2023.pdf655264371-checkpoint-science-past-papers-april-2023.pdf
655264371-checkpoint-science-past-papers-april-2023.pdf
 
This assessment plan proposal is to outline a structured approach to evaluati...
This assessment plan proposal is to outline a structured approach to evaluati...This assessment plan proposal is to outline a structured approach to evaluati...
This assessment plan proposal is to outline a structured approach to evaluati...
 
Chương 6. Ancol - phenol - ether (1).pdf
Chương 6. Ancol - phenol - ether (1).pdfChương 6. Ancol - phenol - ether (1).pdf
Chương 6. Ancol - phenol - ether (1).pdf
 
when will pi network coin be available on crypto exchange.
when will pi network coin be available on crypto exchange.when will pi network coin be available on crypto exchange.
when will pi network coin be available on crypto exchange.
 
how to swap pi coins to foreign currency withdrawable.
how to swap pi coins to foreign currency withdrawable.how to swap pi coins to foreign currency withdrawable.
how to swap pi coins to foreign currency withdrawable.
 
USDA Loans in California: A Comprehensive Overview.pptx
USDA Loans in California: A Comprehensive Overview.pptxUSDA Loans in California: A Comprehensive Overview.pptx
USDA Loans in California: A Comprehensive Overview.pptx
 
Empowering the Unbanked: The Vital Role of NBFCs in Promoting Financial Inclu...
Empowering the Unbanked: The Vital Role of NBFCs in Promoting Financial Inclu...Empowering the Unbanked: The Vital Role of NBFCs in Promoting Financial Inclu...
Empowering the Unbanked: The Vital Role of NBFCs in Promoting Financial Inclu...
 
The Evolution of Non-Banking Financial Companies (NBFCs) in India: Challenges...
The Evolution of Non-Banking Financial Companies (NBFCs) in India: Challenges...The Evolution of Non-Banking Financial Companies (NBFCs) in India: Challenges...
The Evolution of Non-Banking Financial Companies (NBFCs) in India: Challenges...
 
how can i use my minded pi coins I need some funds.
how can i use my minded pi coins I need some funds.how can i use my minded pi coins I need some funds.
how can i use my minded pi coins I need some funds.
 
What price will pi network be listed on exchanges
What price will pi network be listed on exchangesWhat price will pi network be listed on exchanges
What price will pi network be listed on exchanges
 

southern 2008 1st

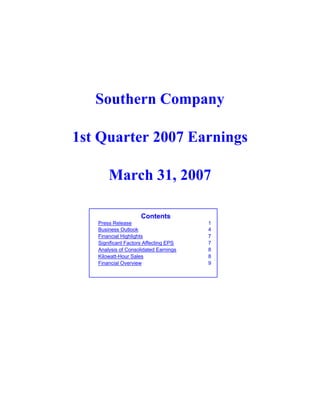
  • 1. Southern Company 1st Quarter 2007 Earnings March 31, 2007 Contents Press Release 1 Business Outlook 4 Financial Highlights 7 Significant Factors Affecting EPS 7 Analysis of Consolidated Earnings 8 Kilowatt-Hour Sales 8 Financial Overview 9
  • 2. News Media Contact: Terri Cohilas 404-506-5333 or 1-866-506-5333 media@southerncompany.com www.southerncompany.com Investor Relations Contact: Glen Kundert 404-506-5135 gakunder2@southernco.com April 26, 2007 Population growth and robust economy drive Southern Company’s first quarter earnings ATLANTA – Southern Company today reported first quarter earnings of $338.7 million, or 45 cents a share, compared with $261.6 million, or 35 cents a share, in the same period a year ago. “The population growth in the Southeast is a reflection of our robust regional economy. Economic development in the Southeast is strong, the job market is vibrant, income levels have increased, and our housing market is outperforming the nation as a whole,” said David M. Ratcliffe, Southern Company chairman, president and CEO. The result for the company has been increases in residential and commercial customers and electricity usage. Southern Company has added 70,000 customers since the end of the first quarter in 2006, a 1.7 percent increase. Total kilowatt-hour sales to Southern Company’s customers in the Southeast, including wholesale sales, grew 6.7 percent in the first quarter, compared with the previous year. These positive earnings drivers were offset in part by higher interest costs. “We maintain our commitment to deliver superior service to customers and excellent results to shareholders. We’re excited about the growth in our region and we’re committed to investing in our infrastructure to ensure that we maintain high reliability. We’re also meeting increasing demand with cleaner electricity by installing new environmental controls at our facilities. And, we’re working hard to keep our costs to customers well below the national average,” Ratcliffe said.
  • 3. Excluding the financial impact of the synthetic fuel business, first quarter earnings per share were 41 cents, compared with 34 cents in the first quarter of 2006. Revenues for the first quarter were $3.41 billion, compared with $3.06 billion in the same period a year ago, an 11.3 percent increase. Kilowatt-hour sales to retail customers in Southern Company’s four-state service area increased 3.3 percent in the first quarter, compared with 2006. Residential electricity use increased 6.4 percent. Electricity use by commercial customers increased 5.1 percent, while industrial sales decreased 1.0 percent. With 4.3 million customers and more than 42,000 megawatts of generating capacity, Atlanta-based Southern Company (NYSE: SO) is the premier energy company serving the Southeast, one of America’s fastest-growing regions. A leading U.S. producer of electricity, Southern Company owns electric utilities in four states and a growing competitive generation company, as well as fiber optics and wireless communications. Southern Company brands are known for excellent customer service, high reliability and retail electric prices that are significantly below the national average. Southern Company has been listed the top ranking U.S. electric service provider in customer satisfaction for seven consecutive years by the American Customer Satisfaction Index (ACSI). Visit our Web site at www.southerncompany.com. Forward Looking Statements Note: Certain information contained in this release is forward-looking information based on current expectations and plans that involve risks and uncertainties. Forward-looking information includes, among other things, statements concerning results of operations, customer and economic growth, capital investments, retail rates and Southern Company’s strategies. Southern Company cautions that there are certain factors that can cause actual results to differ materially from the forward-looking information that has been provided. The reader is cautioned not to put undue reliance on this forward-looking information, which is not a guarantee of future performance and is subject to a number of uncertainties and other factors, many of which are outside the control of Southern Company; accordingly, there can be no assurance that such suggested results will be realized. The following factors, in addition to those discussed in Southern Company’s Annual Report on Form 10-K for the year ended Dec. 31, 2006, and subsequent securities filings, could cause results to differ materially from management expectations as suggested by such forward-looking information: the impact of recent and future federal and state regulatory change, including legislative and regulatory initiatives regarding deregulation and restructuring of the electric utility industry and implementation of the Energy Policy Act of 2005, and also changes in environmental, tax and other laws and regulations to which Southern Company and its subsidiaries are subject, as well as changes in application of existing laws and regulations; current and future litigation, regulatory investigations, proceedings or inquiries, including the pending EPA civil actions against certain Southern Company subsidiaries, FERC matters, IRS audits and Mirant-related matters; the effects, extent and timing of the entry of additional competition in the markets in which Southern Company’s subsidiaries operate; variations in demand for electricity, including those relating to weather, the general economy and population and business growth (and declines); available sources and costs of fuels; ability to control costs; investment performance of Southern Company’s employee benefit plans; advances in technology; state and federal rate regulations and the impact of pending and future rate cases and negotiations, including rate actions relating to fuel and storm
  • 4. restoration cost recovery; the performance of projects undertaken by the non-utility businesses and the success of efforts to invest in and develop new opportunities; fluctuations in the level of oil prices; the level of production, if any, by the synthetic fuel operations at Carbontronics Synfuels Investors LP and Alabama Fuel Products LLC for fiscal year 2007; internal restructuring or other restructuring options that may be pursued; potential business strategies, including acquisitions or dispositions of assets or businesses, which cannot be assured to be completed or beneficial to Southern Company or its subsidiaries; the ability of counterparties of Southern Company and its subsidiaries to make payments as and when due; the ability to obtain new short- and long-term contracts with neighboring utilities; the direct or indirect effect on Southern Company’s business resulting from terrorist incidents and the threat of terrorist incidents; interest rate fluctuations and financial market conditions and the results of financing efforts, including Southern Company’s and its subsidiaries’ credit ratings; the ability of Southern Company and its subsidiaries to obtain additional generating capacity at competitive prices; catastrophic events such as fires, earthquakes, floods, hurricanes, pandemic health events such as an avian influenza or other similar occurrences; the direct or indirect effects on Southern Company’s business resulting from incidents similar to the August 2003 power outage in the Northeast; and the effect of accounting pronouncements issued periodically by standard-setting bodies. Southern Company and its subsidiaries expressly disclaim any obligation to update any forward-looking information. ###
  • 5. Page 4 2007 Business Outlook Financial Goals Our Focus in 2007 Earnings Per Share Growth – Near term: Regular, predictable, sustainable; Georgia Power retail rate case average 5% over the long term, with Capital projects, including a $4.6 billion annual growth within a 4-6% range environmental construction program over 2007 Guidance, ex-synfuel: $2.13 to $2.18 the next 3 years ($2.18 to $2.25, including synfuel) On-going and Long term: Return on Equity - Top quartile of electric utilities Continued industry-leading reliability and customer satisfaction, while maintaining Dividend Growth – Since 2005, our low retail prices relative to the annual growth of approximately 4%. national average Long-term growth consistent with a Meeting increased energy demand with targeted dividend payout ratio range of the best economic and environmental 70-75% choices Financial Integrity – Achieve an Continuing to deliver on our value attractive risk-adjusted return, supported proposition: superior risk-adjusted total by a low-risk business model, sound shareholder return financial policy, and a stable 'A' credit rating Our Major Businesses How We Do Business Our Four Traditional Operating SouthernStyle Companies Unquestionable Trust Alabama Power, Georgia Power, Gulf Superior Performance Power, Mississippi Power Over 4.3 million retail electric Total Commitment customers with expected customer growth of 1.7% and 2.0% territorial demand growth Constructive Over 35,000 MW of nameplate Healthy Capital Regulation Spending generation capacity Customers Over 4,300 MW of capacity under long-term wholesale contracts Southern Power Company High Reliability Low Prices Over 6,700 MW of gas-fired, High Customer generation capacity Satisfaction Near-term construction projects include new units at plants Franklin, Oleander and Stanton See caution regarding forward-looking statements on page six of this document
  • 6. Page 5 2007 Business Outlook Financial Information Forecast Data (in billions) ‘07-‘09 Capital Expenditures ‘07-‘09 Sources of Cash New Generation $0.7 Net Operating Cash Flow $11.0 Fossil/Hydro Retrofits 1.0 Common Equity 1.5 Environmental 4.6 Net Debt and Preferred 4.6 Nuclear Fuel & Retrofits 0.7 Total Sources $17.1 Transmission 1.5 Distribution 2.3 Uses of Cash Other/General 0.6 Capital Expenditures $13.2 Traditional Operating Cos $11.4 Common Dividends 3.9 Southern Power 1.6 Total Uses $17.1 Other 0.2 Total $13.2 Senior Unsecured Alabama Georgia Gulf Mississippi Southern Southern Credit Ratings Power Power Power Power Power Company S&P A A A A BBB+ A- Moody’s A2 A2 A2 A1 Baa1 A3 Fitch A+ A+ A AA- BBB+ A 2006 Key Metrics (unaudited, in millions) Total Net Return on Operating Revenues Income Avg Equity Cash Flow Traditional Operating Cos $13,920 $1,462 13.5% $2,549 Southern Company $14,356 $1,573 14.3% $2,820 Total Total Total Common Assets Debt Pref Stock Equity Traditional Operating Cos $38,825 $12,440 $744 $11,303 Southern Company $42,858 $15,861 $744 $11,371 See caution regarding forward-looking statements on page six of this document
  • 7. Page 6 Caution Regarding Forward-Looking Statements The information contained in this 2007 Business Outlook is forward-looking information based on current expectations and plans that involve risks and uncertainties. Southern Company cautions that there are certain factors that can cause actual results to differ materially from the forward-looking information that has been provided. The reader is cautioned not to put undue reliance on this forward-looking information, which is not a guarantee of future performance and is subject to a number of uncertainties and other factors, many of which are outside of the control of Southern Company; accordingly, there can be no assurance that such suggested results will be realized. The following factors, in addition to those discussed in Southern Company’s Annual Report on Form 10-K for the year ended December 31, 2006, and subsequent securities filings, could cause actual results to differ materially from management expectations as suggested by such forward-looking information: the impact of recent and future federal and state regulatory change, including legislative and regulatory initiatives regarding deregulation and restructuring of the electric utility industry and implementation of the Energy Policy Act of 2005, and also changes in environmental, tax and other laws and regulations to which Southern Company and its subsidiaries are subject, as well as changes in application of existing laws and regulations; current and future litigation, regulatory investigations, proceedings or inquiries, including the pending EPA civil actions against certain Southern Company subsidiaries, FERC matters, IRS audits and Mirant-related matters; the effects, extent and timing of the entry of additional competition in the markets in which Southern Company’s subsidiaries operate; variations in demand for electricity, including those relating to weather, the general economy and population and business growth (and declines); available sources and costs of fuels; ability to control costs; investment performance of Southern Company’s employee benefit plans; advances in technology; state and federal rate regulations and the impact of pending and future rate cases and negotiations, including rate actions relating to fuel and storm restoration cost recovery; the performance of projects undertaken by the non-utility businesses and the success of efforts to invest in and develop new opportunities; fluctuations in the level of oil prices; the level of production, if any, by the synthetic fuel operations at Carbontronics Synfuels Investors LP and Alabama Fuel Products LLC for fiscal year 2007; internal restructuring or other restructuring options that may be pursued; potential business strategies, including acquisitions or dispositions of assets or businesses, which cannot be assured to be completed or beneficial to Southern Company or its subsidiaries; the ability of counterparties of Southern Company and its subsidiaries to make payments as and when due; the ability to obtain new short- and long-term contracts with neighboring utilities; the direct or indirect effect on Southern Company’s business resulting from terrorist incidents and the threat of terrorist incidents; interest rate fluctuations and financial market conditions and the results of financing efforts, including Southern Company’s and its subsidiaries’ credit ratings; the ability of Southern Company and its subsidiaries to obtain additional generating capacity at competitive prices; catastrophic events such as fires, earthquakes, floods, hurricanes, pandemic health events such as an avian influenza, or other similar occurrences; the direct or indirect effects on Southern Company’s business resulting from incidents similar to the August 2003 power outage in the Northeast; and the effect of accounting pronouncements issued periodically by standard-setting bodies. Southern Company and its subsidiaries expressly disclaim any obligation to update any forward-looking information.
  • 8. Page 7 Southern Company Financial Highlights (In Millions of Dollars Except Earnings Per Share) 3 Months Ended March 2007 2006 (Notes) (Notes) Consolidated Earnings–As Reported (See Notes) $ 285 $ 242 Traditional Operating Companies Southern Power 32 20 Total 317 262 Synthetic Fuels 28 8 Leasing Business 1 6 (7) (14) Parent Company and Other $ 339 $ 262 Net Income - As Reported 0.45 $ 0.35 $ Basic Earnings Per Share - (See Notes) $ 3,409 $ 3,063 Operating Revenues 750 742 Average Shares Outstanding (in millions) 752 742 End of Period Shares Outstanding (in millions) 3 Months Ended March 2007 2006 Consolidated Earnings–Excluding Synfuels (See Notes) $ 339 $ 262 Net Income - As Reported (28) (8) Less: Synthetic Fuels $ 311 $ 254 Net Income–Excluding Synthetic Fuels $ 0.41 $ 0.34 Basic Earnings Per Share–Excluding Synfuels Significant Factors Impacting EPS 3 Months Ended March 2007 2006 Change $ 0.45 0.35 $ 0.10 $ Consolidated Earnings–As Reported (See Notes) Significant Factors: 0.05 Traditional Operating Companies 0.02 Southern Power 0.03 Synthetic Fuels (0.01) Leasing 0.01 Parent Company and Other $ 0.10 Total–As Reported 3 Months Ended March 2007 2006 Change $ 0.41 0.34 $ 0.07 $ Consolidated Earnings–Excluding Synfuels (See Notes) 0.10 Total–As Reported (0.03) Less: Synthetic Fuels $ 0.07 Total–Excluding Synthetic Fuels Notes - For the first quarters 2007 and 2006, diluted earnings per share was less than 1 cent. - Tax credits associated with Southern Company's synthetic fuel investments expire December 31, 2007 and will not contribute to Southern Company's earnings and earnings per share after 2007. - Certain prior year data has been reclassified to conform with current year presentation. - Information contained in this report is subject to audit and adjustments. Certain classifications may be different from final results published in the Form 10-Q.
  • 9. Southern Company Page 8 Analysis of Consolidated Earnings (In Millions of Dollars) 3 Months Ended March 2007 2006 Change Income Account- Retail Revenue $ 2,471 $ 273 $ 2,744 Wholesale Revenue 415 66 481 Other Electric Revenues 111 10 121 Non-regulated Operating Revenues 66 (3) 63 Total Revenues 3,063 346 3,409 Fuel and Purchased Power 1,153 228 1,381 Non-fuel O & M 846 2 848 Depreciation and Amortization 299 7 306 Taxes Other Than Income Taxes 175 8 183 Total Operating Expenses 2,473 245 2,718 Operating Income 590 101 691 Other Income, net (4) 36 32 Interest Charges and Dividends 216 12 228 Income Taxes 108 48 156 $ $ 262 $ 77 339 NET INCOME (See Notes) Kilowatt-Hour Sales (In Millions of KWHs) 3 Months Ended March As Reported (See Notes) 2007 2006 Change Kilowatt-Hour Sales- 48,286 45,270 6.7% Total Sales 38,040 36,821 3.3% Total Retail Sales- 12,464 11,716 6.4% Residential 12,276 11,682 5.1% Commercial 13,060 13,187 -1.0% Industrial 240 236 1.6% Other 10,246 8,449 21.3% Total Wholesale Sales Notes - Certain prior year data has been reclassified to conform with current year presentation. - Information contained in this report is subject to audit and adjustments and certain classifications may be different from final results published in the Form 10-Q.
  • 10. Page 9 Southern Company Financial Overview (In Millions of Dollars) 3 Months Ended March 2007 2006 % Change Consolidated – Operating Revenues $ 3,409 $ 3,063 11.3% Earnings Before Income Taxes 494 370 33.7% Net Income $ 339 $ 262 29.5% Alabama Power – Operating Revenues $ 1,197 $ 1,073 11.6% Earnings Before Income Taxes 196 142 38.3% Net Income Available to Common $ 115 $ 82 39.9% Georgia Power – Operating Revenues $ 1,657 $ 1,584 4.6% Earnings Before Income Taxes 203 214 -5.0% Net Income Available to Common $ 131 $ 132 -0.5% Gulf Power – Operating Revenues $ 296 $ 263 12.6% Earnings Before Income Taxes 31 21 48.7% Net Income Available to Common $ 19 $ 12 52.1% Mississippi Power – Operating Revenues $ 257 $ 209 22.9% Earnings Before Income Taxes 32 25 29.9% Net Income Available to Common $ 20 $ 15 28.5% Southern Power – Operating Revenues $ 192 $ 140 37.7% Earnings Before Income Taxes 54 32 64.8% Net Income Available to Common $ 32 $ 20 61.0% Notes - Certain prior year data has been reclassified to conform with current year presentation - Information contained in this report is subject to audit and adjustments and certain classifications may be different from final results published in the Form 10-Q.