The corporate presentation outlines Solaris Resources Inc.'s ongoing projects focused on copper exploration in the Americas, particularly the Warintza project in Ecuador, which has significant mineral resource estimates. Forward-looking statements are provided regarding development activities and potential outcomes, tempered by risks and uncertainties inherent in the mining industry. The document emphasizes the company's strategic partnerships, management expertise, and community engagement, which are crucial for advancing its projects and achieving regulatory compliance.
![8
TSX: SLS; NYSE: SLSR
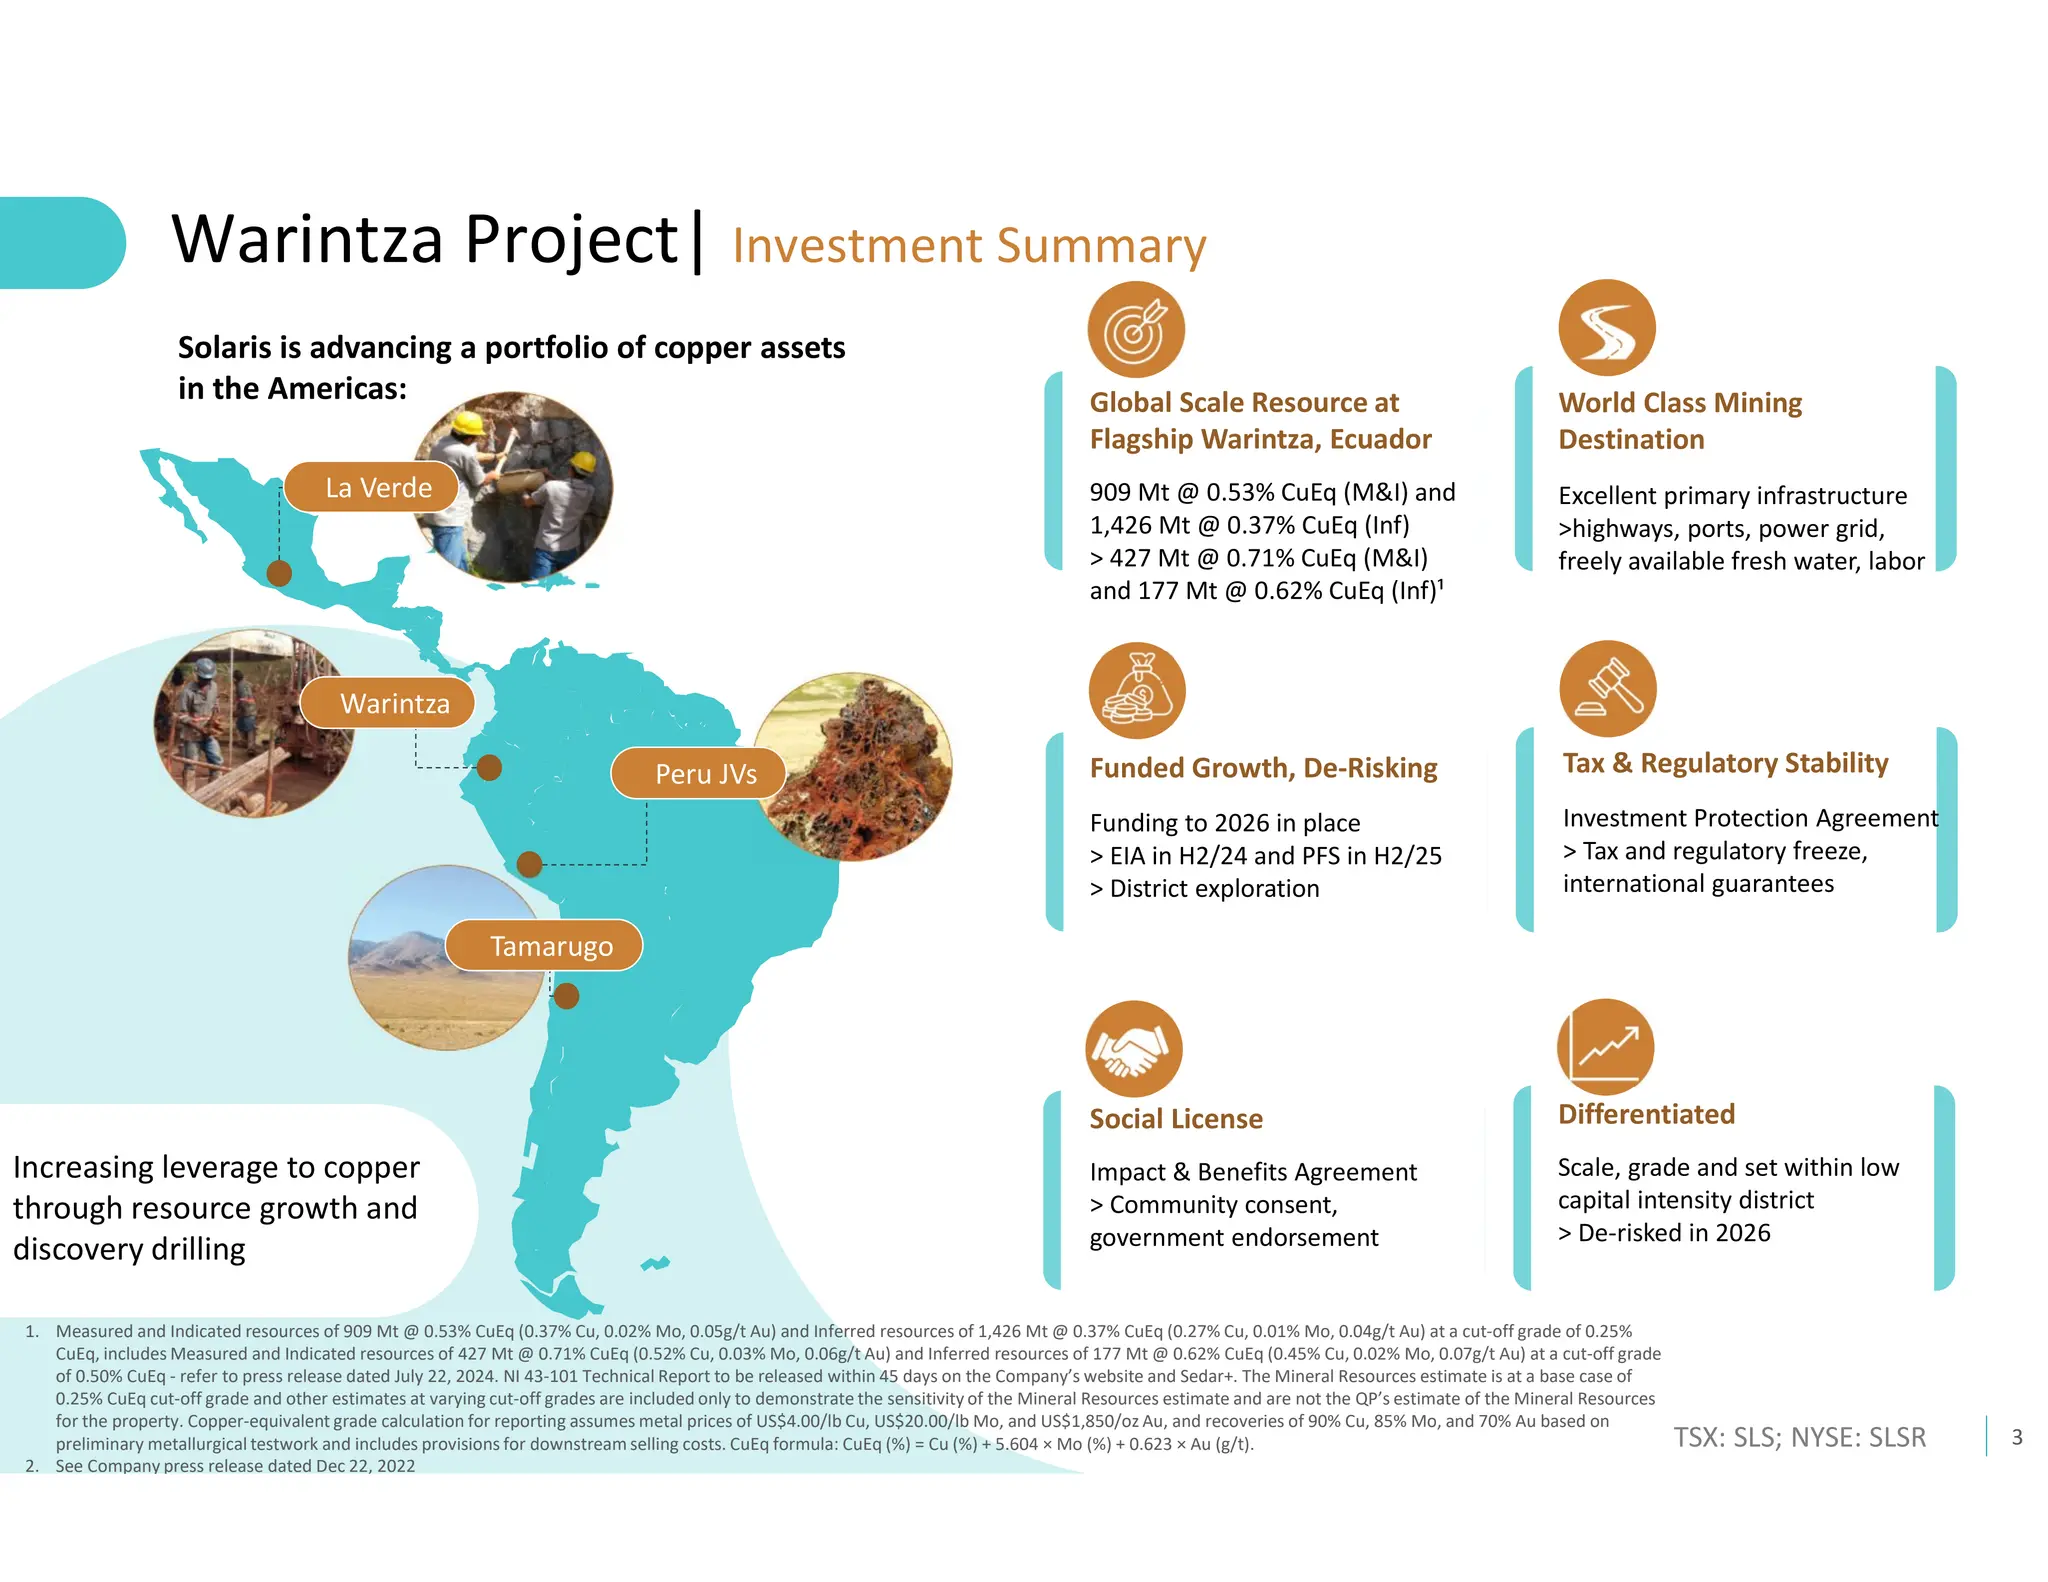
Ecuador | World Class Mining Destination
“We are going to promote
legal and responsible mining
to compensate for the gap in
the fiscal”
Daniel Noboa, President
FDN, Mirador enter production in 2019
Tier 1 Deposits
10 Years Continuous
Pro Mining Policy
Left, Right, Centrist governments supported mining
No history of tax hikes, mining bans
Security: Warintza far removed from
issues on coast and Colombian border;
no interruptions to mines in SE Ecuador
>crime rates down 80-90% since Jan
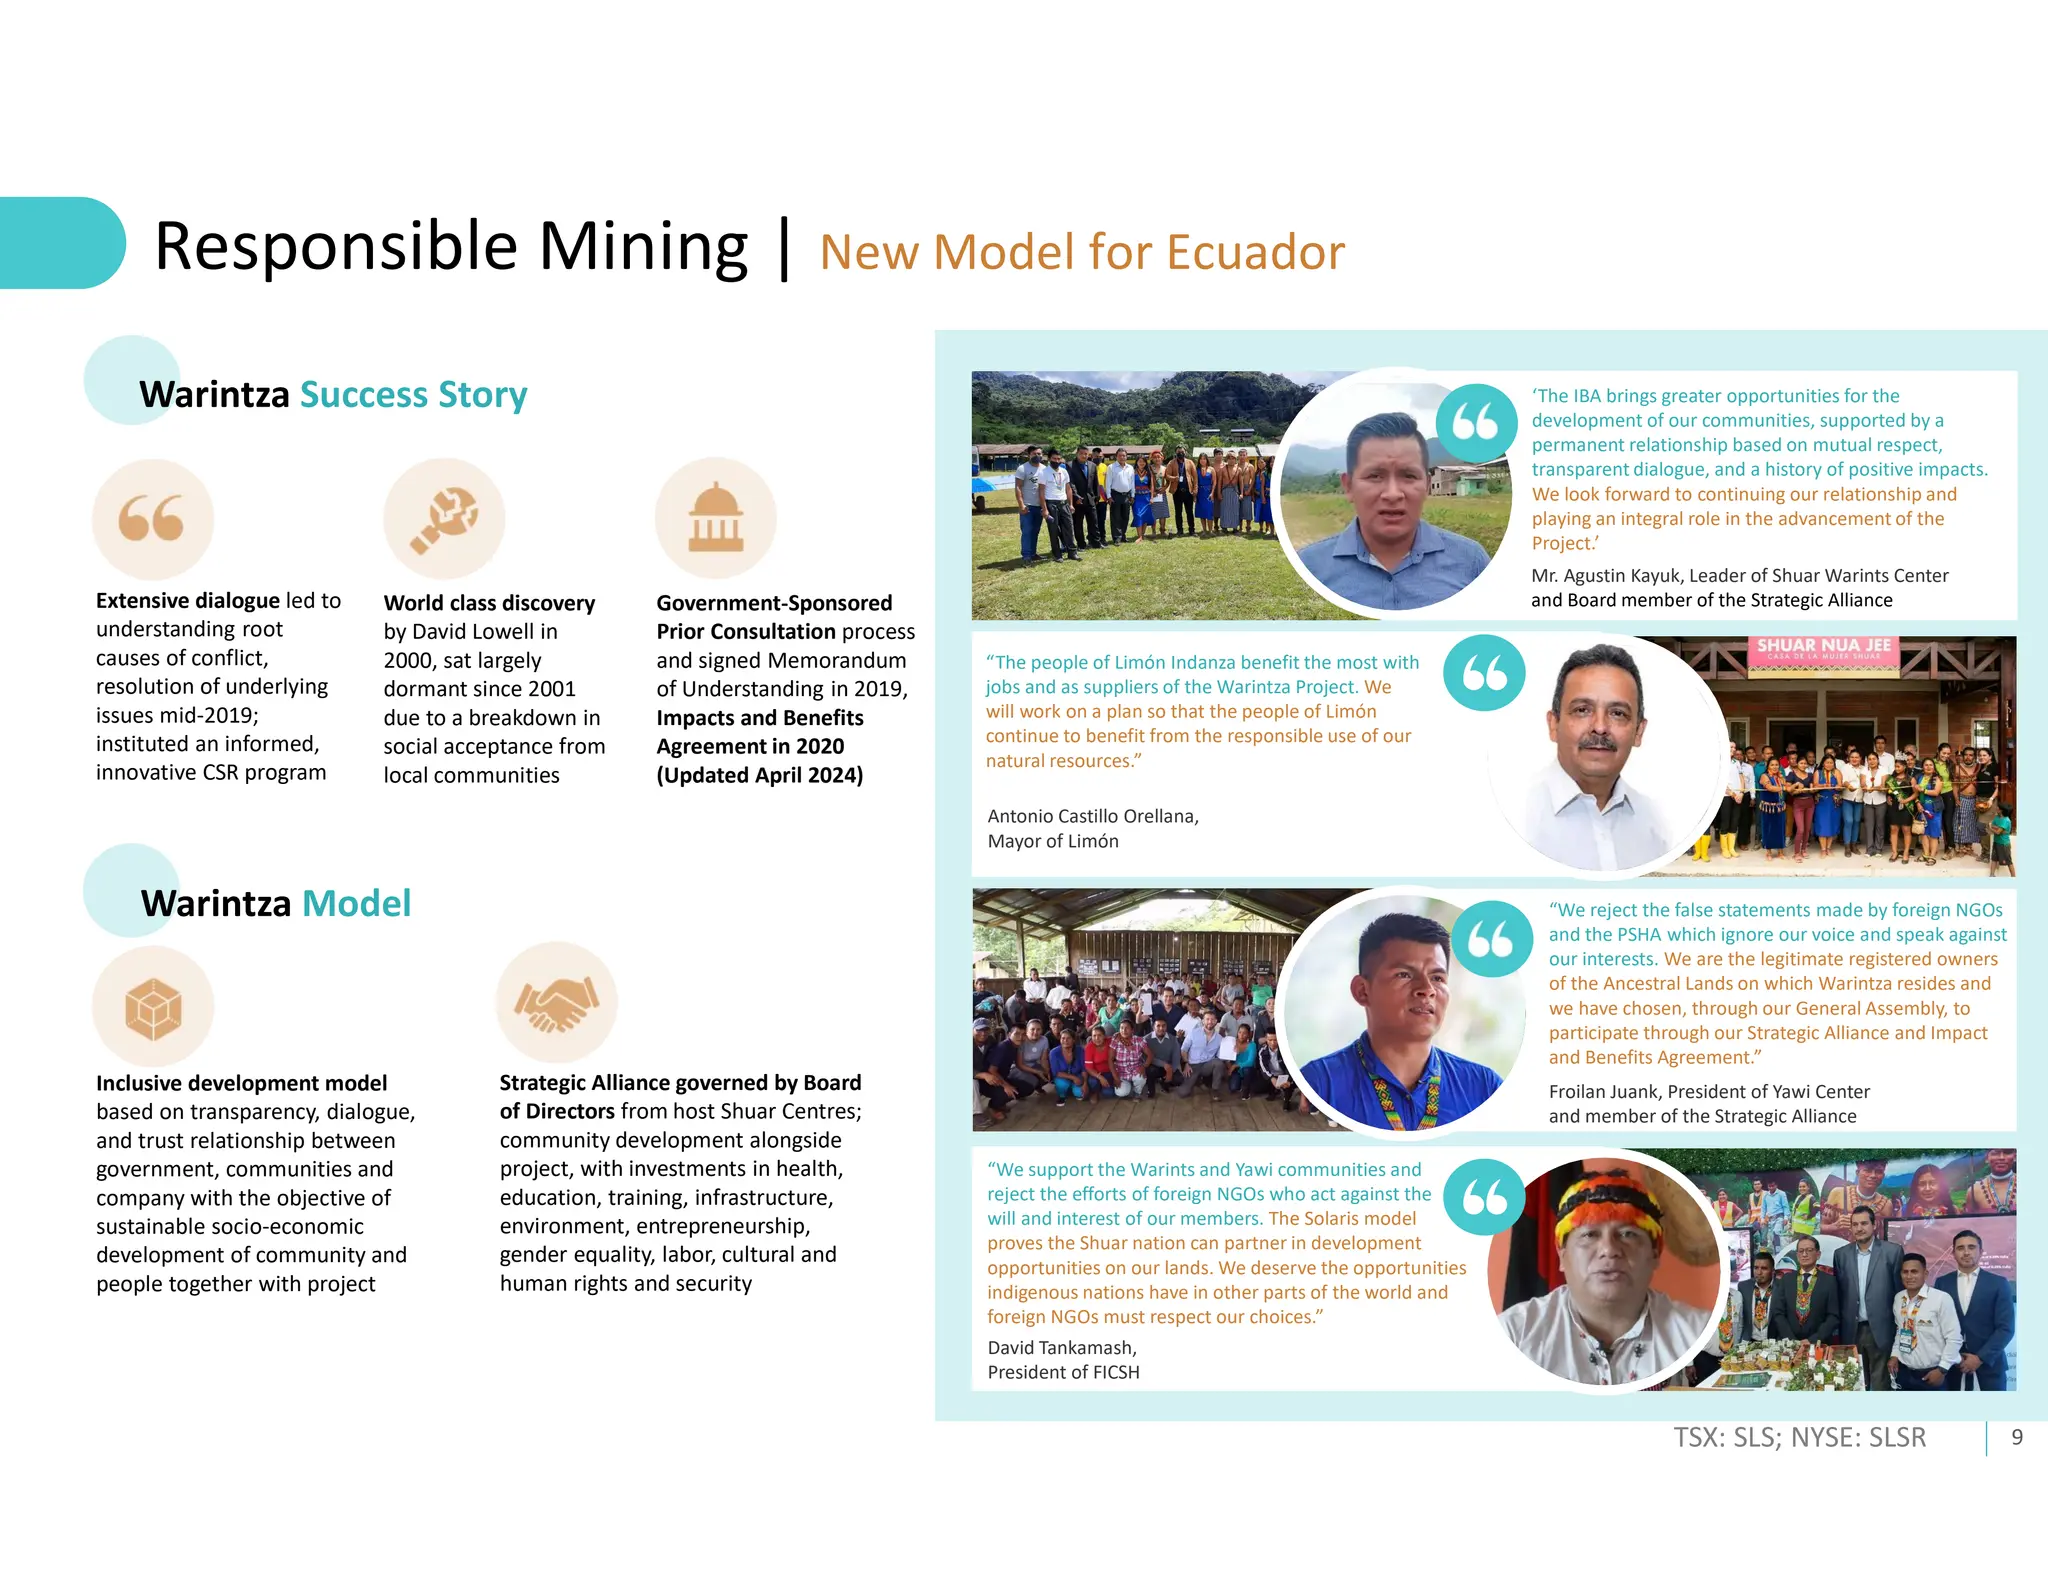
Impact & Benefits Agreement²
>Consent from communities, endorsed by government
Strong Community,
Govt Support
Rapid Permitting
Major projects generally permitted in 1 yr
>New govt KPI = US$ value of permits issued
Tax and regulatory freeze to 2066¹
International security guarantees
Investment
Protection
Agreement
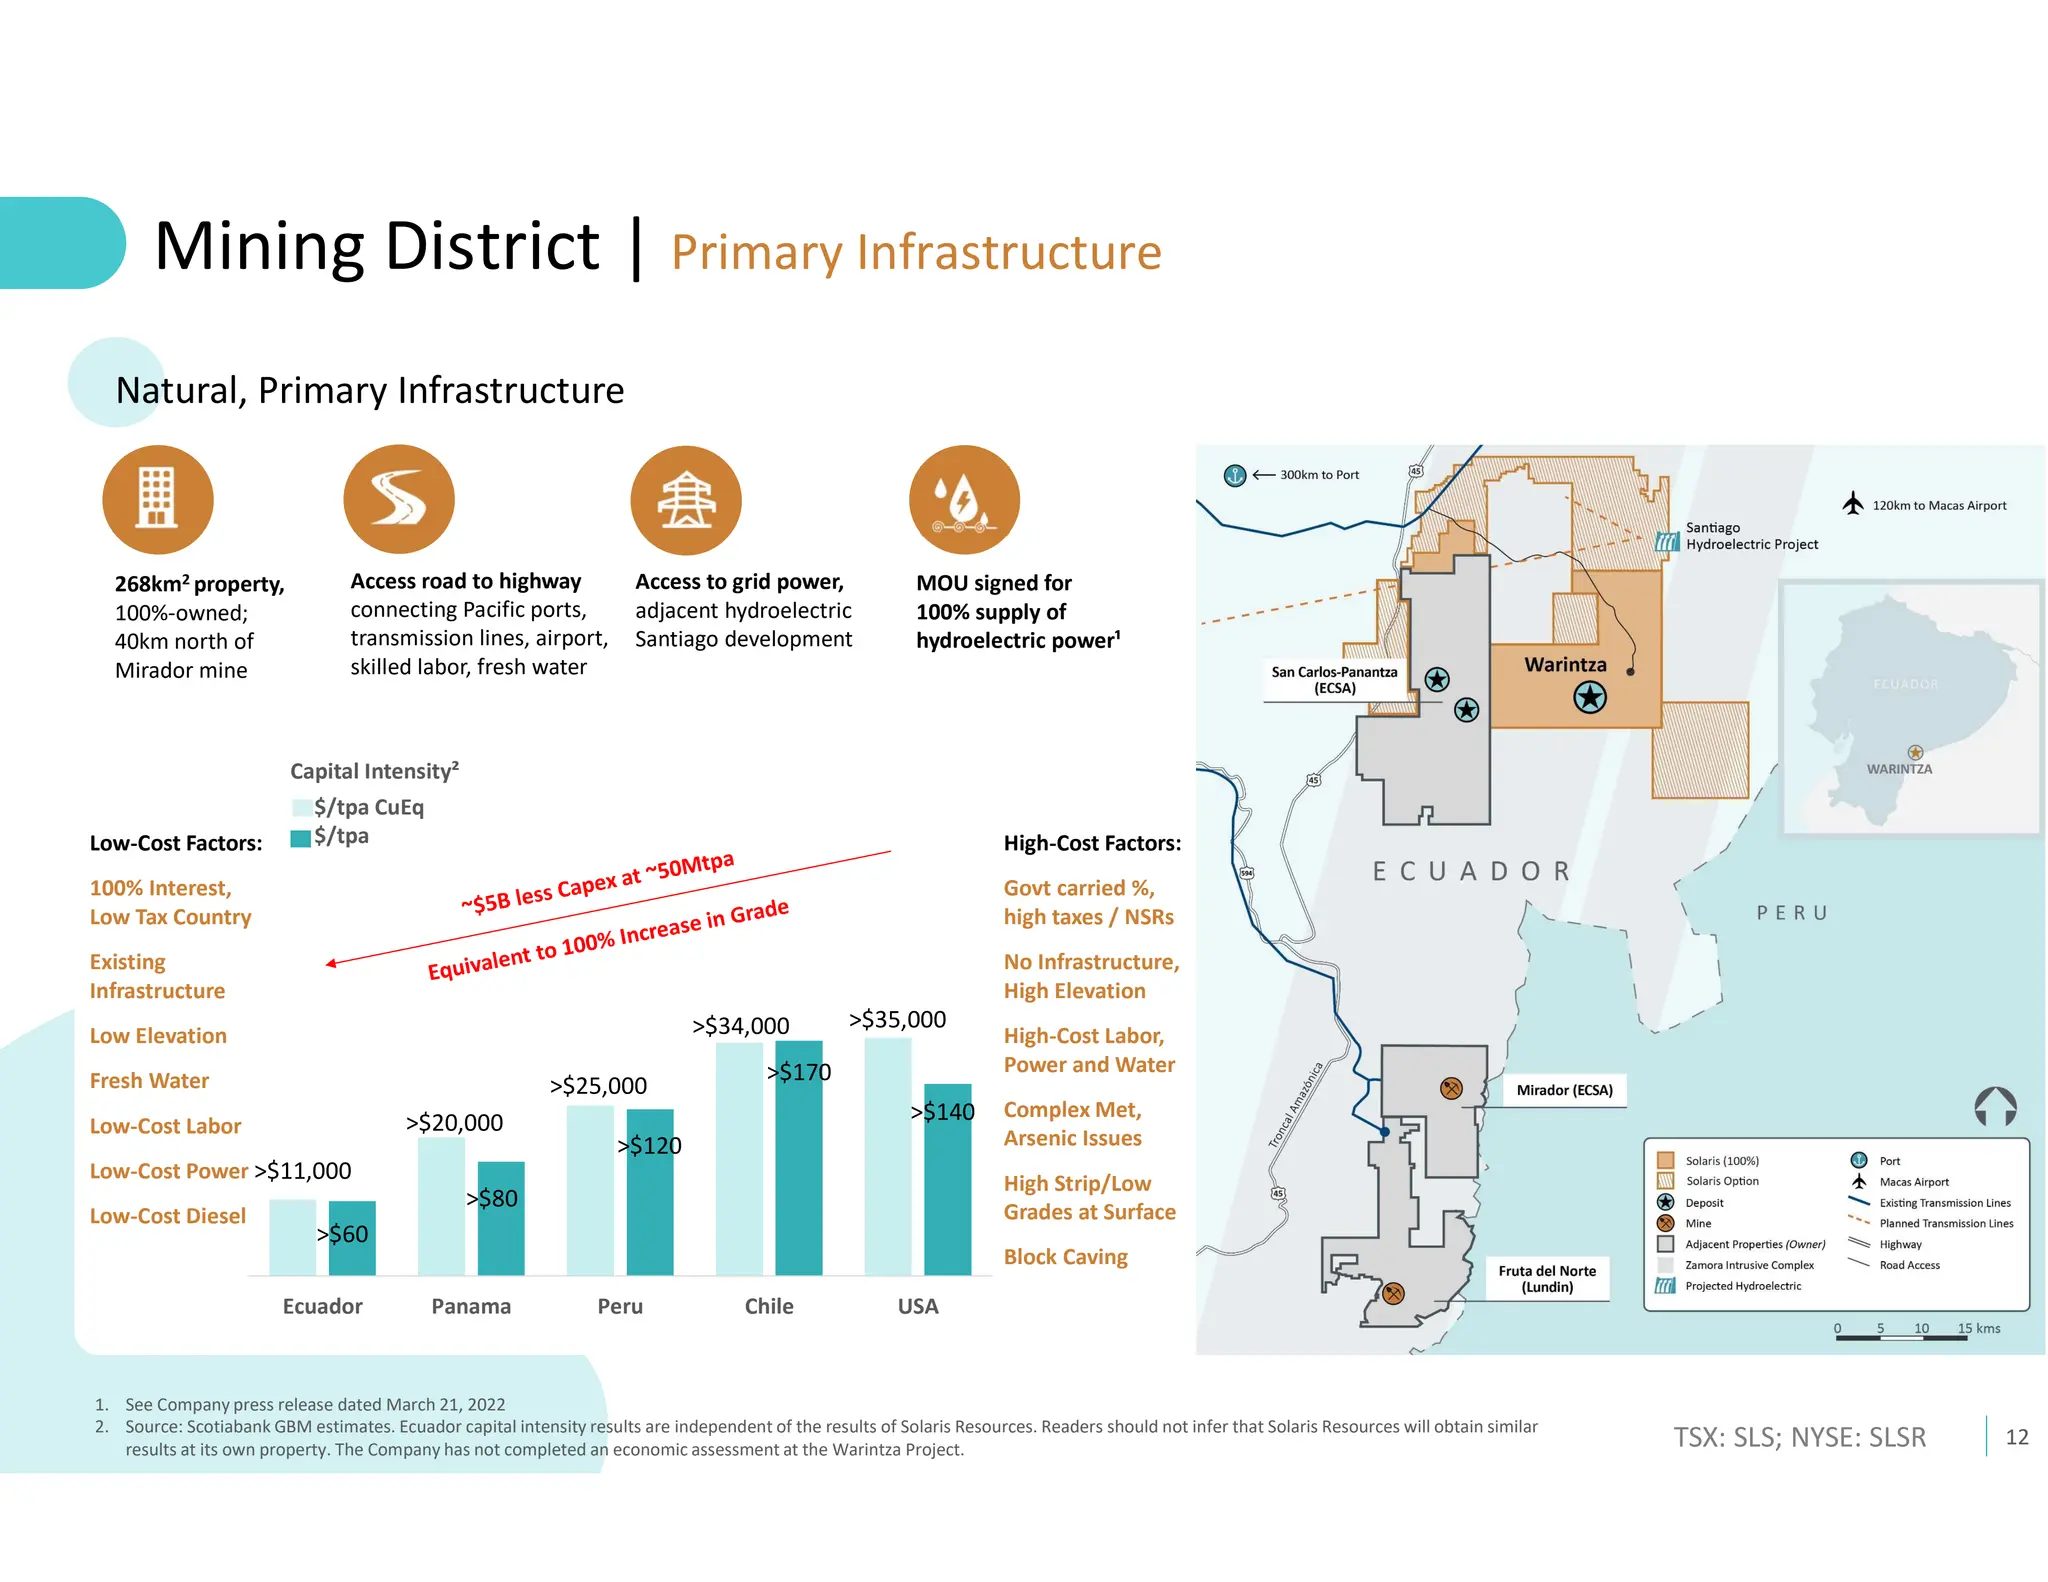
Primary
Infrastructure
Highways, ports, power grid with renewable
energy, freely available fresh water, labor
US dollar, raw material export economy
FTAs with China, US and Canada in progress
USD Economy;
Free Trade
‘I have been able to verify
that [the Company] complies
with legal standards and
provides many benefits to
the population, [which] is
demonstrated through
the social documents
that certify its legality’
Vinicio Cóndor,
Governor of Morona Santiago
Fruta del Norte (Lundin Gold)
Mirador (ECSA)
1. See Company press release dated Dec 22, 2022
2. See Company press release dated Apr 17, 2024](https://image.slidesharecdn.com/solarisresources-july2024-public-240719222510-145fe3fb/75/Solaris-Resources-July-2024-Corporate-Presentation-8-2048.jpg)