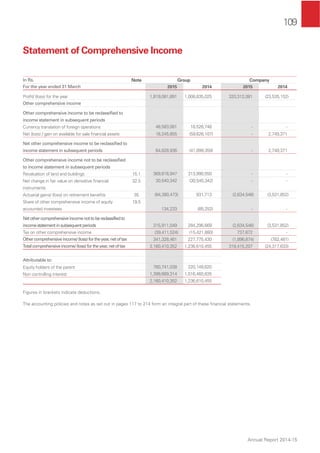
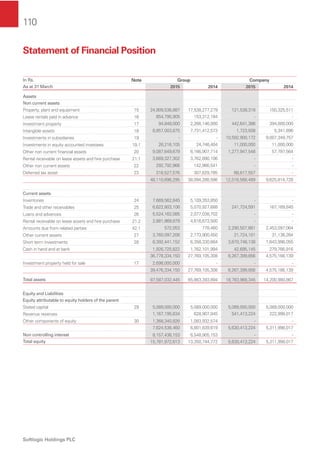
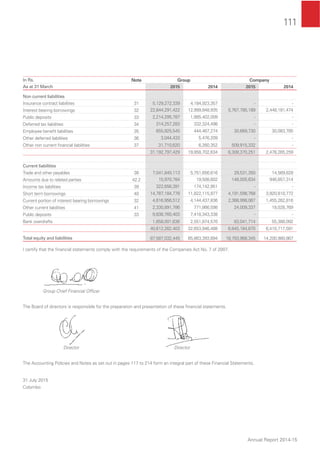
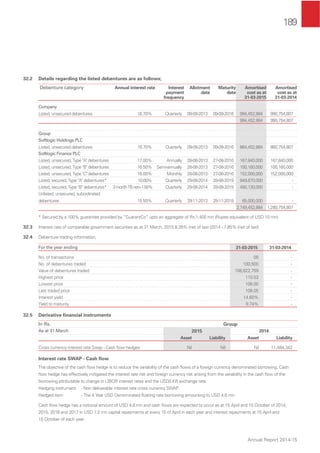
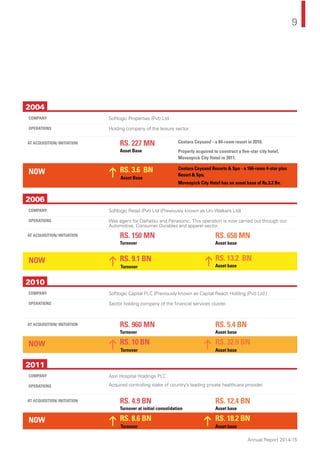
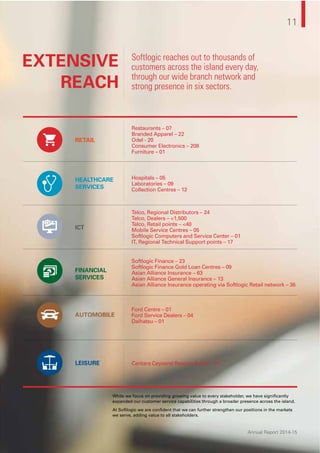
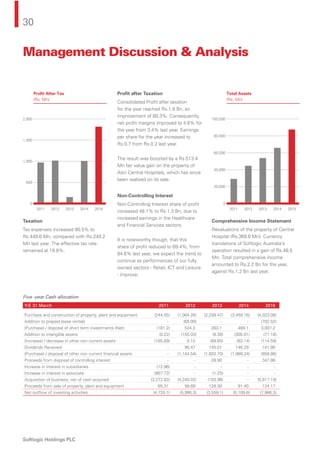
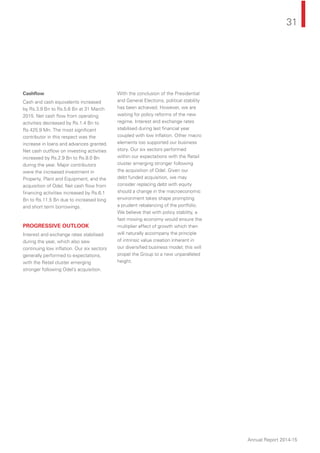
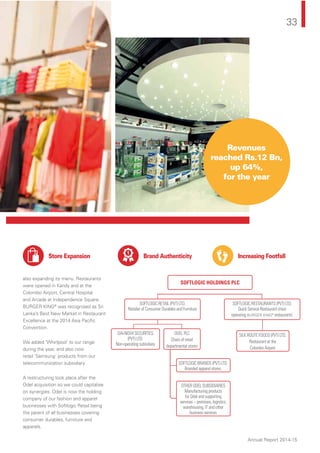
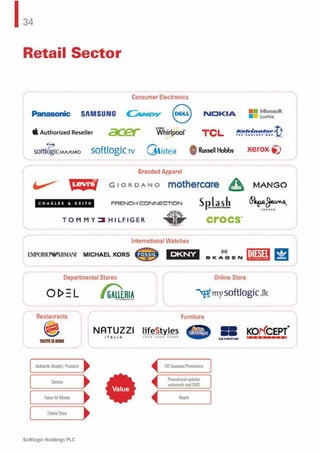
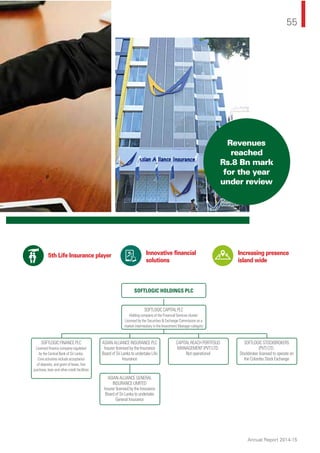
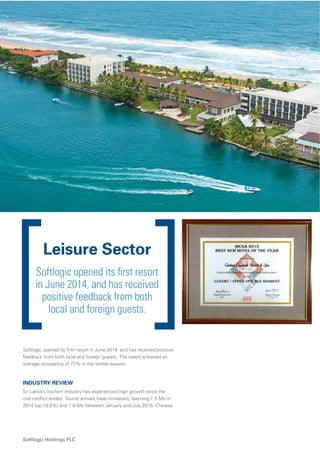
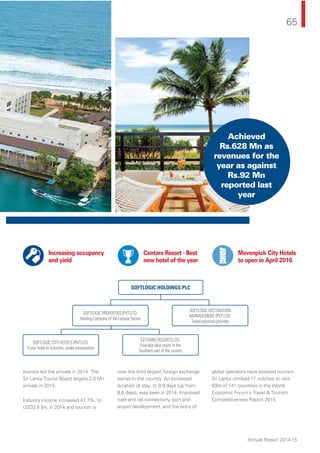
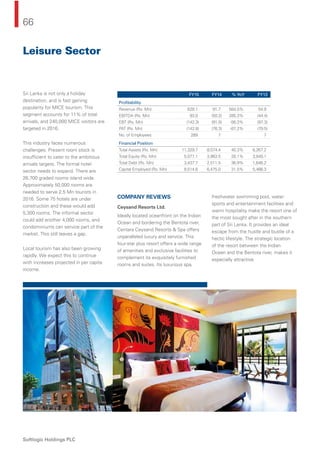
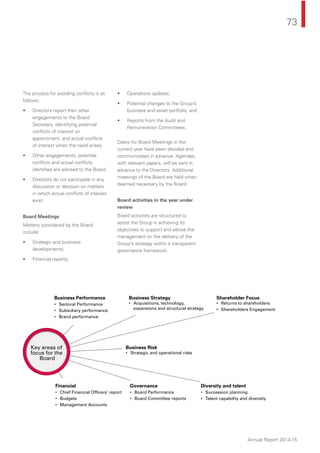
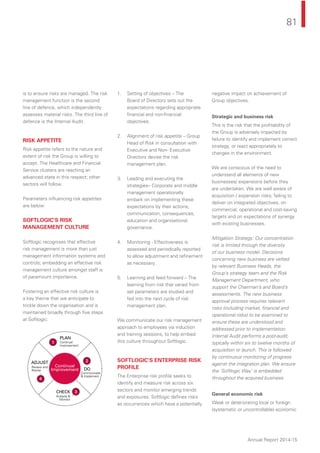
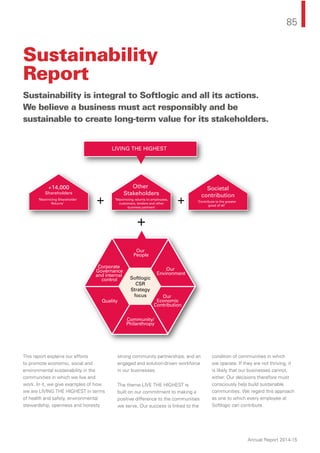
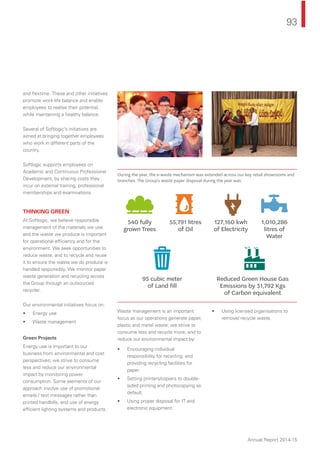
The document provides an overview of Softlogic Holdings PLC, a leading diversified group in Sri Lanka with interests in six business sectors - ICT, Retail, Financial Services, Healthcare Services, Automobiles and Leisure. It discusses Softlogic's vision, core values of integrity, accountability, humility, simplicity, passion and focus on success. The document also highlights some of Softlogic's achievements and developments in 2014/15, including the opening of its first resort Centara Ceysand Resort & Spa, launching an online retail store and introducing new brands like Tommy Hilfiger to Sri Lanka.


![100
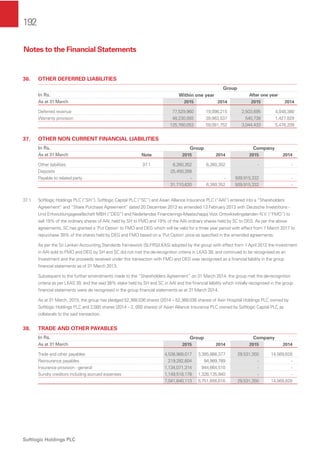
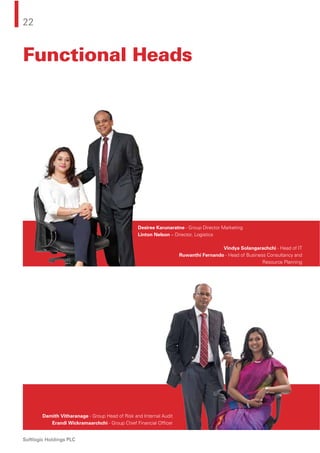
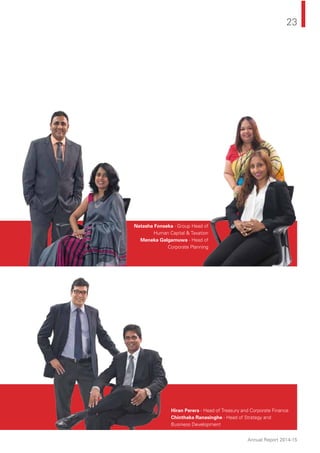
Softlogic Holdings PLC
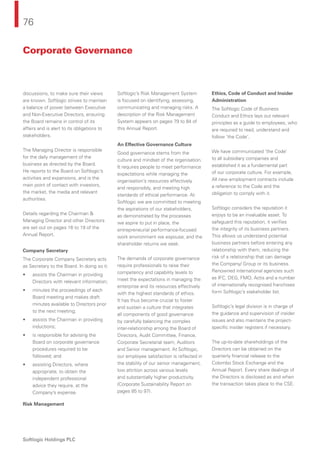
Audit Committee Report
SCOPE
The responsibilities of the Committee
are set forth in the written Terms of
Reference (TOR), a revised version of
which was adopted by the Board on 8
July 2015.
The Committee will not engage directly
with Group companies covered by other
audit committees established under
mandatory regulatory requirements; it
receives briefings on the activities of
these committees as necessary.
COMPOSITION
The Committee was chaired by
Desamanya P D Rodrigo until his
resignation from the Board on 30 June
2014, and thereafter by R A Ebell, who
was appointed a Director on 20 March
2014 and a member of the Committee
on 19 June 2014. Other members of
the Committee are:
Dr. S Selliah
Mr. W M P L De Alwis, PC
Mr. G L H Premaratne (appointed w.e.f.
19 June 2014)
Softlogic Corporate Services (Pvt) Ltd.,
served as Secretary of the Committee up
to 30 June 2014. Mr D Vitharanage, Chief
Risk Officer Chief Internal Auditor (CRO/
CIA) served as Secretary thereafter.
ACTIVITY & FOCUS
The Audit Committee has primarily
focused during the year on its
responsibilities for monitoring:
• integrity of the Company’s and
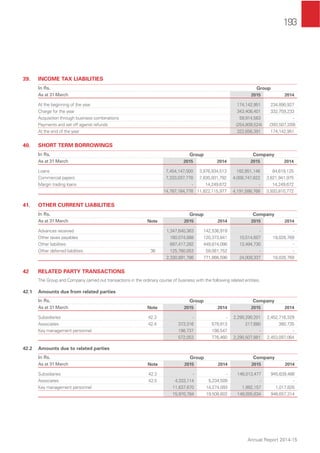
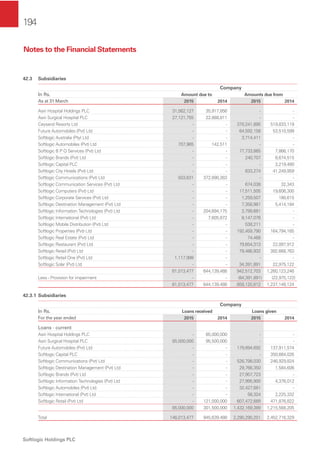
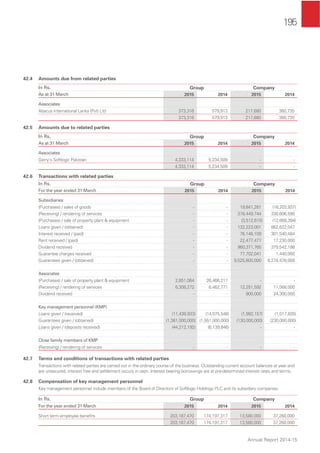
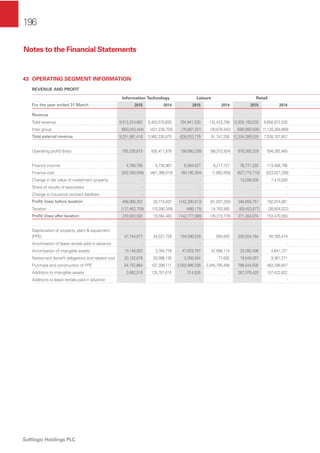
Group’s financial statements,
including the reasonableness of
assertions made in their preparation,
the appropriateness of accounting
policies used and the adequacy of
presentation and disclosures made;
• effectiveness of internal control
over financial reporting;
• the work and performance of the
internal auditors;
• the Company’s relationship with
its External Auditors, auditor
independence and performance, and
the management’s responsiveness
to external audit; and
• procedures in place to examine,
regularly, the Company’s ability to
continue as a going concern in the
foreseeable future.
The Committee meets quarterly to
review and make recommendations
on the quarterly and annual financial
statements before they are considered
and approved by the Board for release
to shareholders and the public. It also
meets at other times to consider
matters arising from its review of the
financial statements and other subjects,
including internal audit findings and
reviews of specific businesses and
change initiatives.
The Committee has reviewed the plan for
reducing the number of External Auditors
deployed across the Group and reassigning
audits to improve audit cohesiveness. It has
also provided inputs in the determination of
KPIs and evaluation of performance of the
CRO / CIA.
MEETINGS & REPORTING
The Committee met fourteen [ 14 ]
times during the year.
Attendance at these meetings has been
as follows:
Name Meetings
attended
Desamanya P D Rodrigo 2 / 2
Mr. R A Ebell 13 / 13
Dr. S Selliah 14 / 14
Mr. W M P L de Alwis, PC 12 / 14
Mr. G L H Premaratne 12 / 14
The Chief Financial Officer attends
all meetings by invitation, and other
members of Senior Management attend
meetings by invitation as required.
The External Auditors attend meetings
by invitation when their presence is
necessary; discussion of their major audit
and review findings is a key component
of those meetings. The Committee
further meets with the External Auditors,
with no members of management
present, to cover contentious matters
and matters they wish to discuss in
confidence with the Committee.
The Committee makes written
reports to the Group Chairman /
Managing Director, for dissemination
to the Board, following each
quarterly meeting at which financial
statements are reviewed prior to
a recommendation being made on
them. These draw attention to matters
requiring consideration and action.
The Committee also briefs the Group
Chairman /Managing Director from time
to time on matters of concern, at ad
hoc meetings or at meetings scheduled
by him with the Non-Executive
Directors.
REAPPOINTMENT OF EXTERNAL
AUDITORS
The Audit Committee has proposed
to the Board of Directors that
the incumbent auditors, Ernst &
Young, Chartered Accountants be
recommended for re-appointment for
the year ending 31 March 2016 at the
upcoming Annual General Meeting.
R A Ebell
Chairman (w.e.f. 1 July 2014)
Audit Committee
31 July 2015](https://image.slidesharecdn.com/d0224a0d-65da-4440-bc53-708e4d79a916-160528111301/85/Softlogic-Holdings-PLC-102-320.jpg)