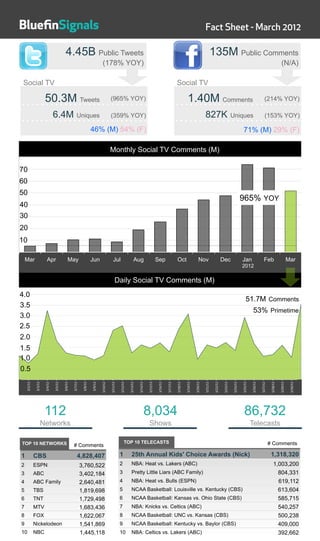
BluefinSignals provides data on social media conversations related to television. Their fact sheet from March 2012 shows that in the previous year there was a 178% increase in public tweets and social TV comments grew 965%. The data breaks down comments by gender and network, and lists the top 10 networks and telecasts by comment volume, such as the 2012 Kids' Choice Awards and NBA games between the Heat and Lakers. A chart shows the growth in monthly social TV comments from March 2012.
This fact sheet provides statistics on social media activity related to television for June 2012. It shows that there were over 4.64 billion public tweets during this period, a 122% increase year-over-year. The NBA Finals games generated the most social media comments, with Game 5 receiving over 6 million comments alone. Overall, ESPN programming generated the most social TV comments that month at over 30 million.
- BluefinSignals fact sheet from February 2012 provides social media analytics on public tweets and comments
- It reported 3.94 billion public tweets in 2012, a 205% increase from the previous year, with 158 million public comments which was a new metric
- The document outlines key metrics on social TV, including 68.6 million tweets about TV (876% increase) and 2.65 million tweets during primetime shows (697% increase)
- Line charts show large monthly and daily increases in social TV comments from 2011 to 2012
- NBC, CBS and TNT had the most total comments, while the Grammys, Super Bowl and Oscars generated the most comments for individual TV shows
BluefinSignals fact sheet from January 2012 shows that in a one year period (YOY):
- Public tweets increased 933% to over 3.9 billion
- Public comments, which were newly tracked, reached 280 million
- Tweets about social TV increased nearly 2,000% to over 68.8 million tweets
- Uniques tweeting about social TV increased over 500% to 12.5 million
- The top networks for social TV comments were FOX, CBS, and NBC
Havas Media Brussels Newsletter December 2011Hugues Rey
The document is a newsletter edition from December 2011 that includes the following sections:
- Media spend from January to October 2011, split by medium and top 20 spenders.
- Cinema section discussing Kinepolis buying Brightfish sales house but it continuing operations.
- TV section on a survey finding additional TV spending leads to 7.5% increased short-term sales and losing TV for a year cuts sales 6%.
- Print section showing declining magazine circulation figures quarterly from 2009 to 2011.
- Growing income inequality in the decades before the 1929 and 2007 crises simultaneously increased demand for credit from the lower/middle classes to maintain living standards and supply of credit from high income groups seeking investment opportunities.
- Inequality and household leverage both sharply increased together in the periods preceding the two crises.
- Earnings of the top decile increased over 40% cumulatively while earnings of the bottom decile decreased over 30% from 1980-2000.
- Debt levels were flat or lower for high income groups but sharply higher for the bottom 95% leading up to the 2007 crisis.
1) Twitter saw a 153% year-over-year increase in public tweets in May 2012, totaling 4.86 billion tweets. Social TV tweets and comments also significantly increased year-over-year.
2) TNT had the most social TV comments of any network in May 2012, totaling over 19 million comments. The NBA game between the Lakers and Thunder generated the most comments of any telecast.
3) Social TV comments continue to grow substantially month-over-month and year-over-year, indicating increased engagement with televised programming on social media platforms.
This fact sheet provides statistics on social TV and public comments on Twitter from April 2012. It shows that the number of public tweets increased 173% year-over-year to 4.62 billion, and social TV tweets increased 924% to 68.9 million. The top networks for social TV comments were ESPN, ABC, TNT, CBS, and NBC.
The top 10 brands in social TV for the week of July 9, 2012.
Each week Bluefin Labs posts to their blog (www.bluefinlabs.com/blog) the top 10 brands whose commercials received the most Tweets. The data includes the week-over-week % change in Tweets and the total potential earned impressions (sum of the followers for each Tweet).
Social TV Data for the 2012 NBA Finals - Bluefin LabsBluefin Labs
Game 5 of the NBA Finals on ABC got a whopping 6.31 million comments in social media, and is the third most talked about telecast in social TV ever, behind this year’s Super Bowl and the Grammy Awards.
The document discusses different approaches to improving social TV analytics: more data, better data, and better algorithms. It argues that more data enables better algorithms and helps create better data, while better data improves algorithms and makes big data more useful. Better algorithms leverage more and better data. The best approach incorporates all three - more data, better data, and better algorithms working together in an iterative, collaborative process.
Presented at ad:tech NYC in November 2011 by Bluefin Labs VP of Sales, Jack Flanagan. This is the winning presentation in the Startup Spotlight competition in the Social Media category.
This presentation details how brands can leverage Social TV data, and specifically, Bluefin's audience segmenting capabilities to reach relevant audience targets.
Social TV Analytics for Broadcasters and Marketers provides an overview of Bluefin Labs and social TV analytics. Bluefin Labs measures social media comments about TV shows, finding huge year-over-year growth in comments for popular reality shows, comedies, and dramas. Bluefin collects TV data from sources like video fingerprinting and closed captioning, along with social media data. This data is analyzed to provide consumer insights, engagement metrics for advertisers, and optimization of promotional placements. Bluefin works with many broadcasters and operators to provide these social TV analytics services.