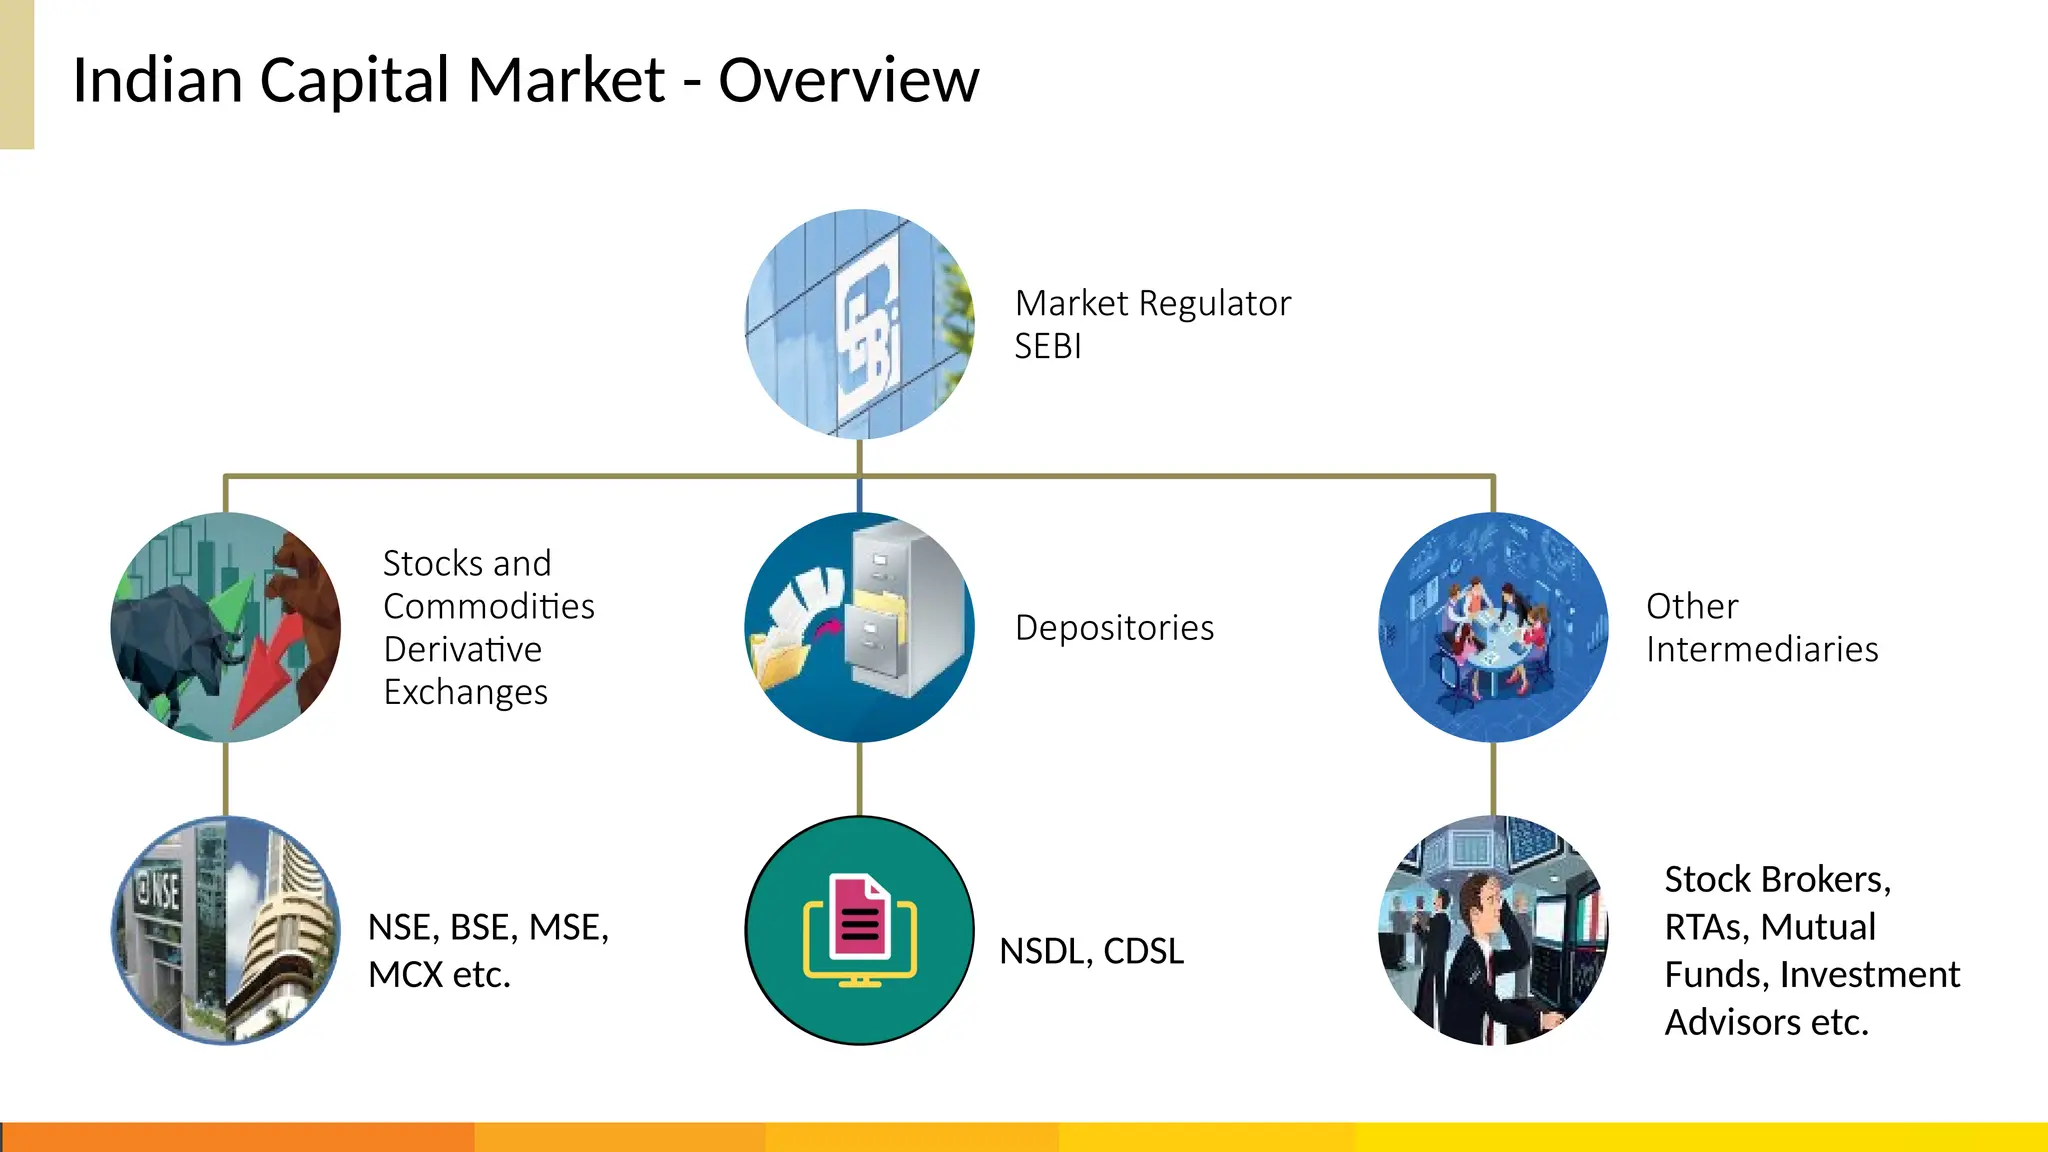
Indian Capital Market- Overview
Market Regulator
SEBI
Stocks and
Commodities
Derivative
Exchanges
Depositories
Other
Intermediaries
NSE, BSE, MSE,
MCX etc.
NSDL, CDSL
Stock Brokers,
RTAs, Mutual
Funds, Investment
Advisors etc.
3.
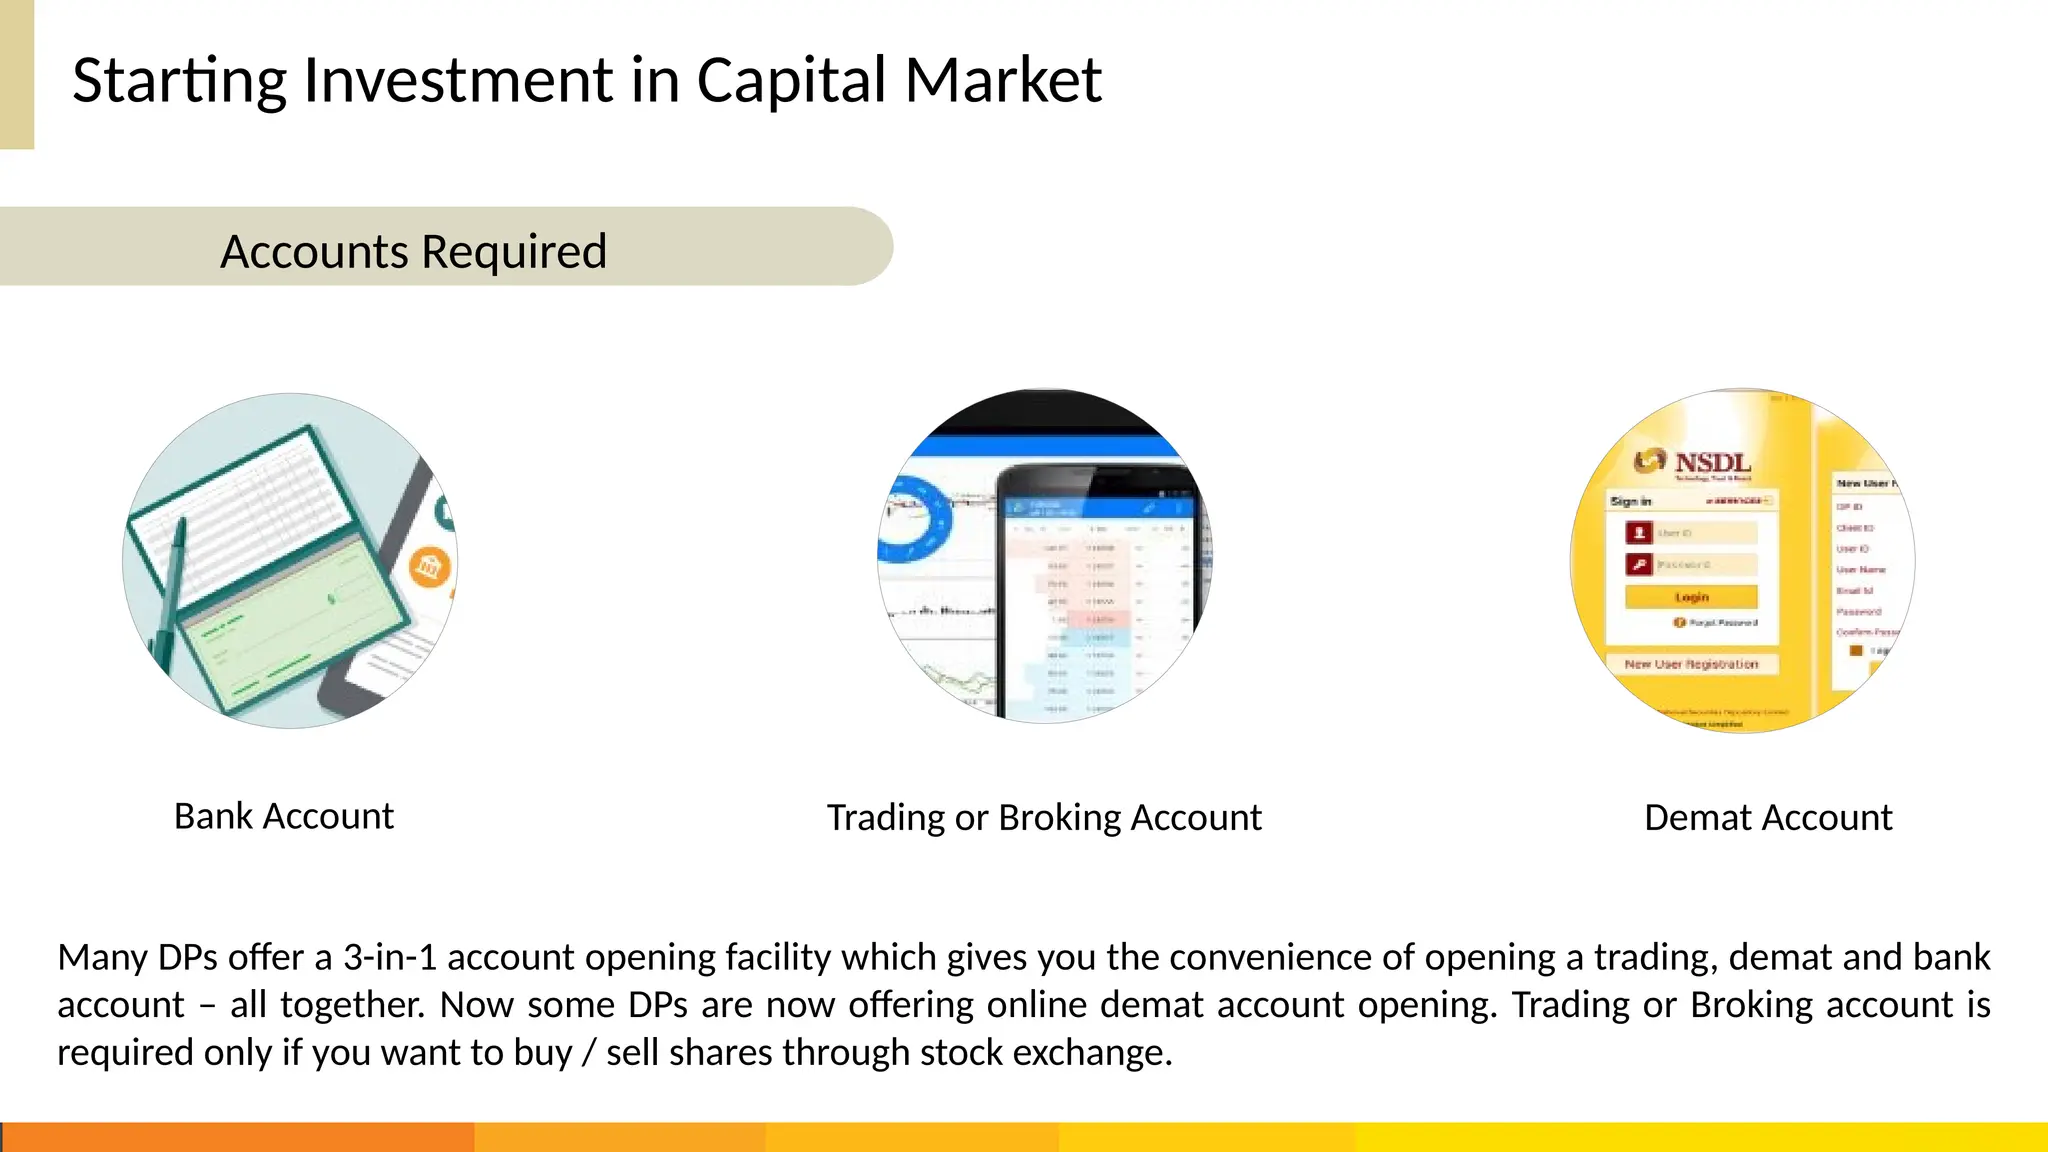
Starting Investment inCapital Market
Bank Account Trading or Broking Account Demat Account
Many DPs offer a 3-in-1 account opening facility which gives you the convenience of opening a trading, demat and bank
account – all together. Now some DPs are now offering online demat account opening. Trading or Broking account is
required only if you want to buy / sell shares through stock exchange.
Accounts Required
4.
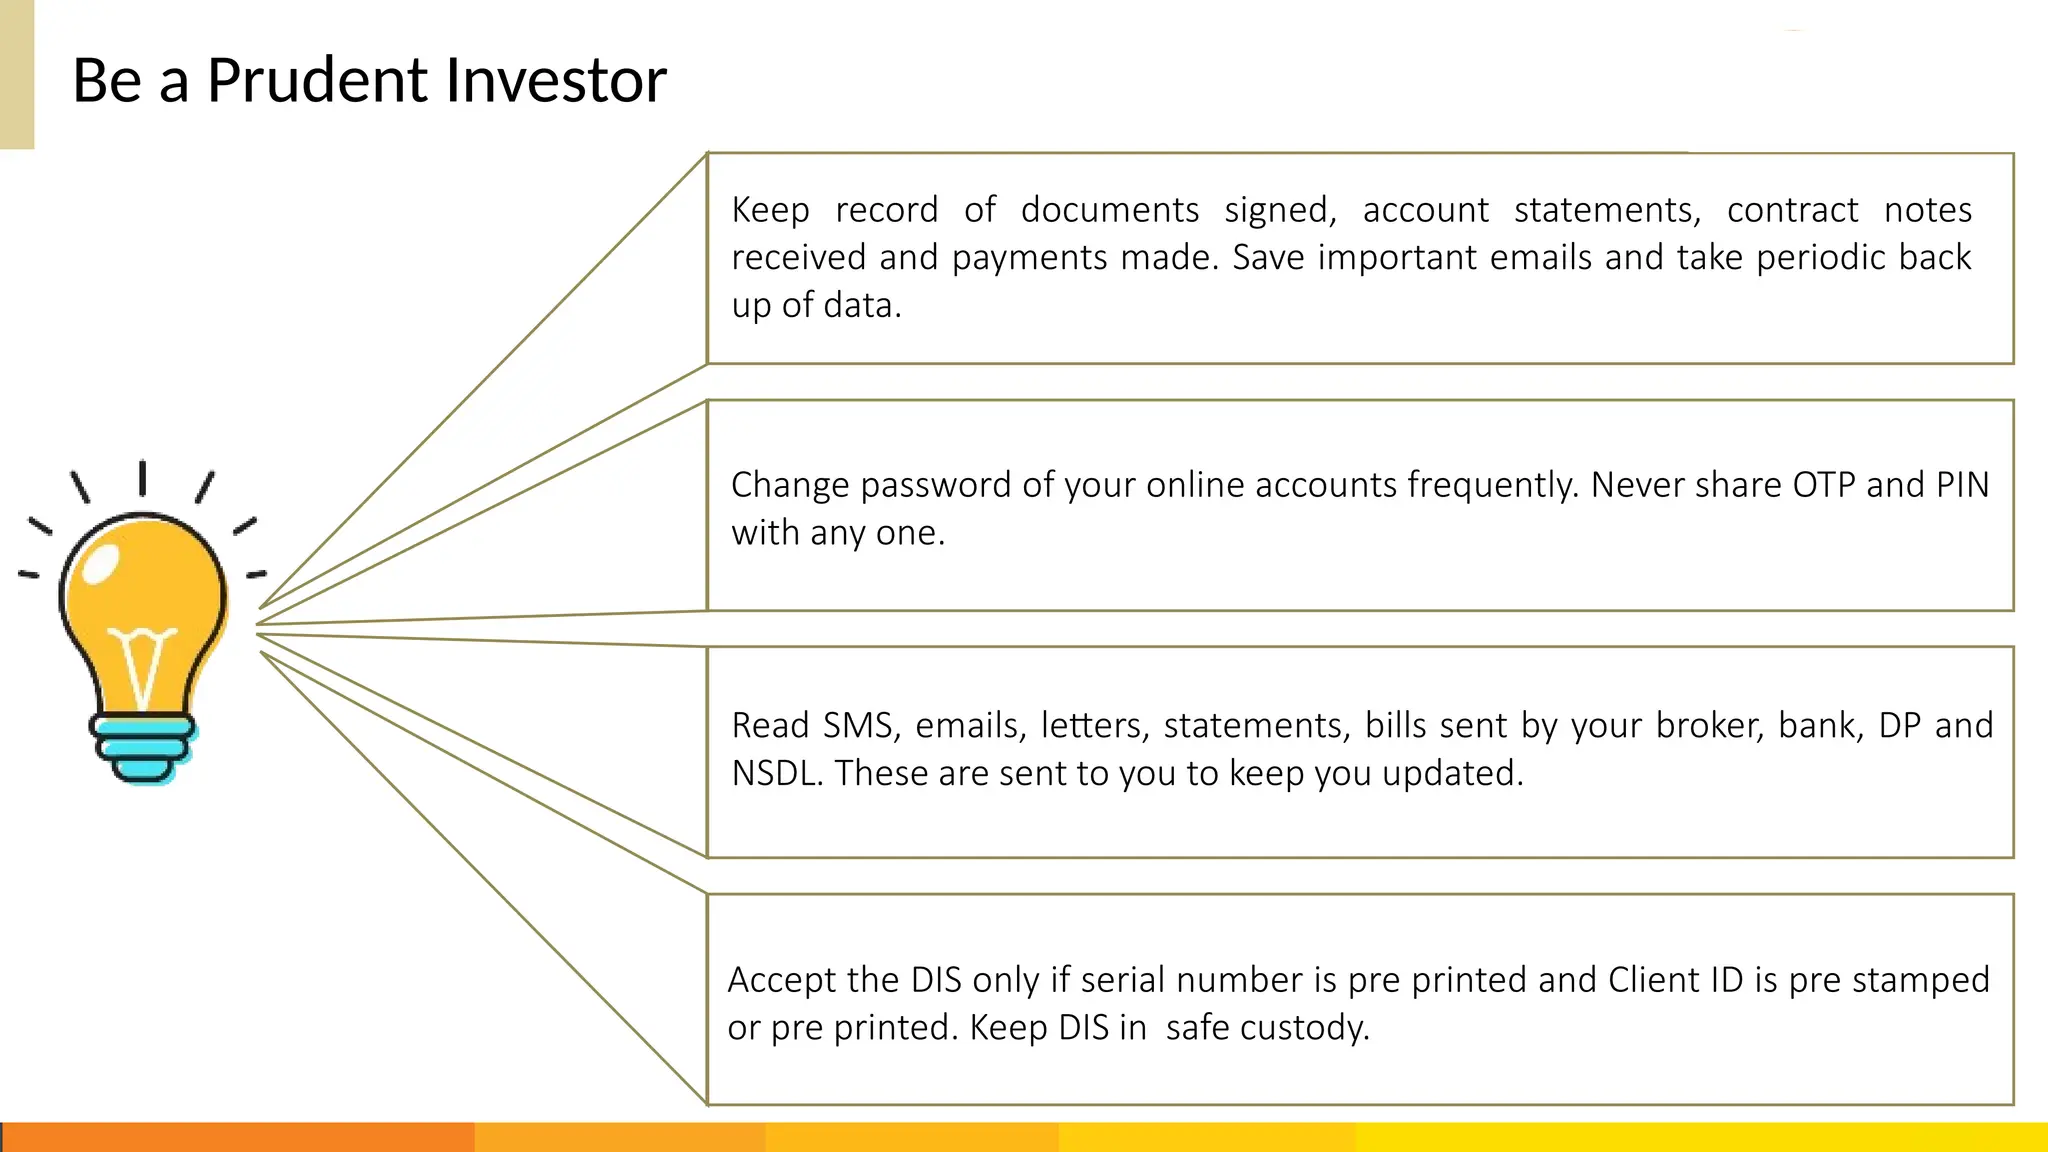
Be a PrudentInvestor
Accept the DIS only if serial number is pre printed and Client ID is pre stamped
or pre printed. Keep DIS in safe custody.
Keep record of documents signed, account statements, contract notes
received and payments made. Save important emails and take periodic back
up of data.
Change password of your online accounts frequently. Never share OTP and PIN
with any one.
Read SMS, emails, letters, statements, bills sent by your broker, bank, DP and
NSDL. These are sent to you to keep you updated.
5.
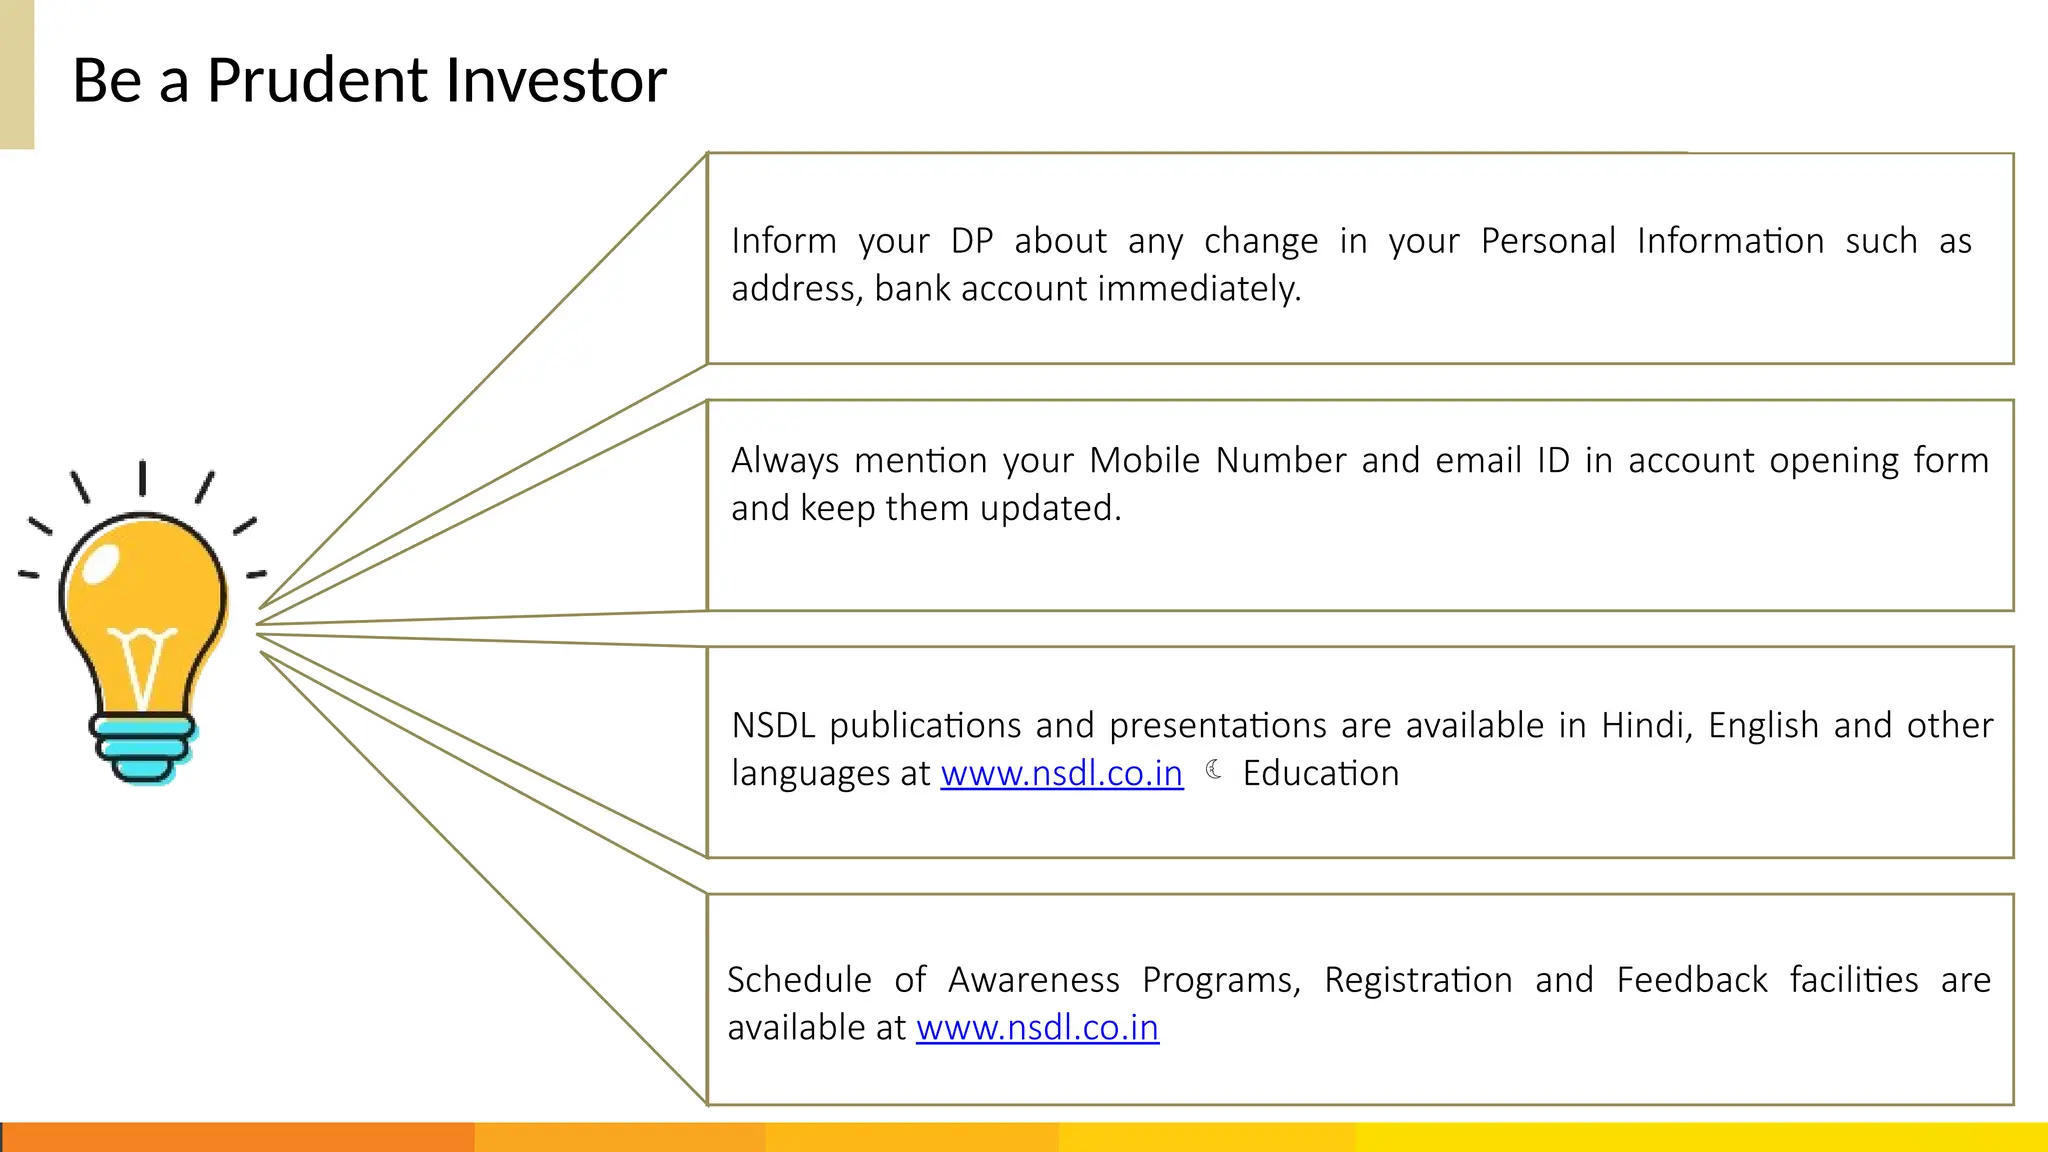
Be a PrudentInvestor
Schedule of Awareness Programs, Registration and Feedback facilities are
available at www.nsdl.co.in
Inform your DP about any change in your Personal Information such as
address, bank account immediately.
Always mention your Mobile Number and email ID in account opening form
and keep them updated.
NSDL publications and presentations are available in Hindi, English and other
languages at www.nsdl.co.in Education
6.
Be a PrudentInvestor – Don’ts
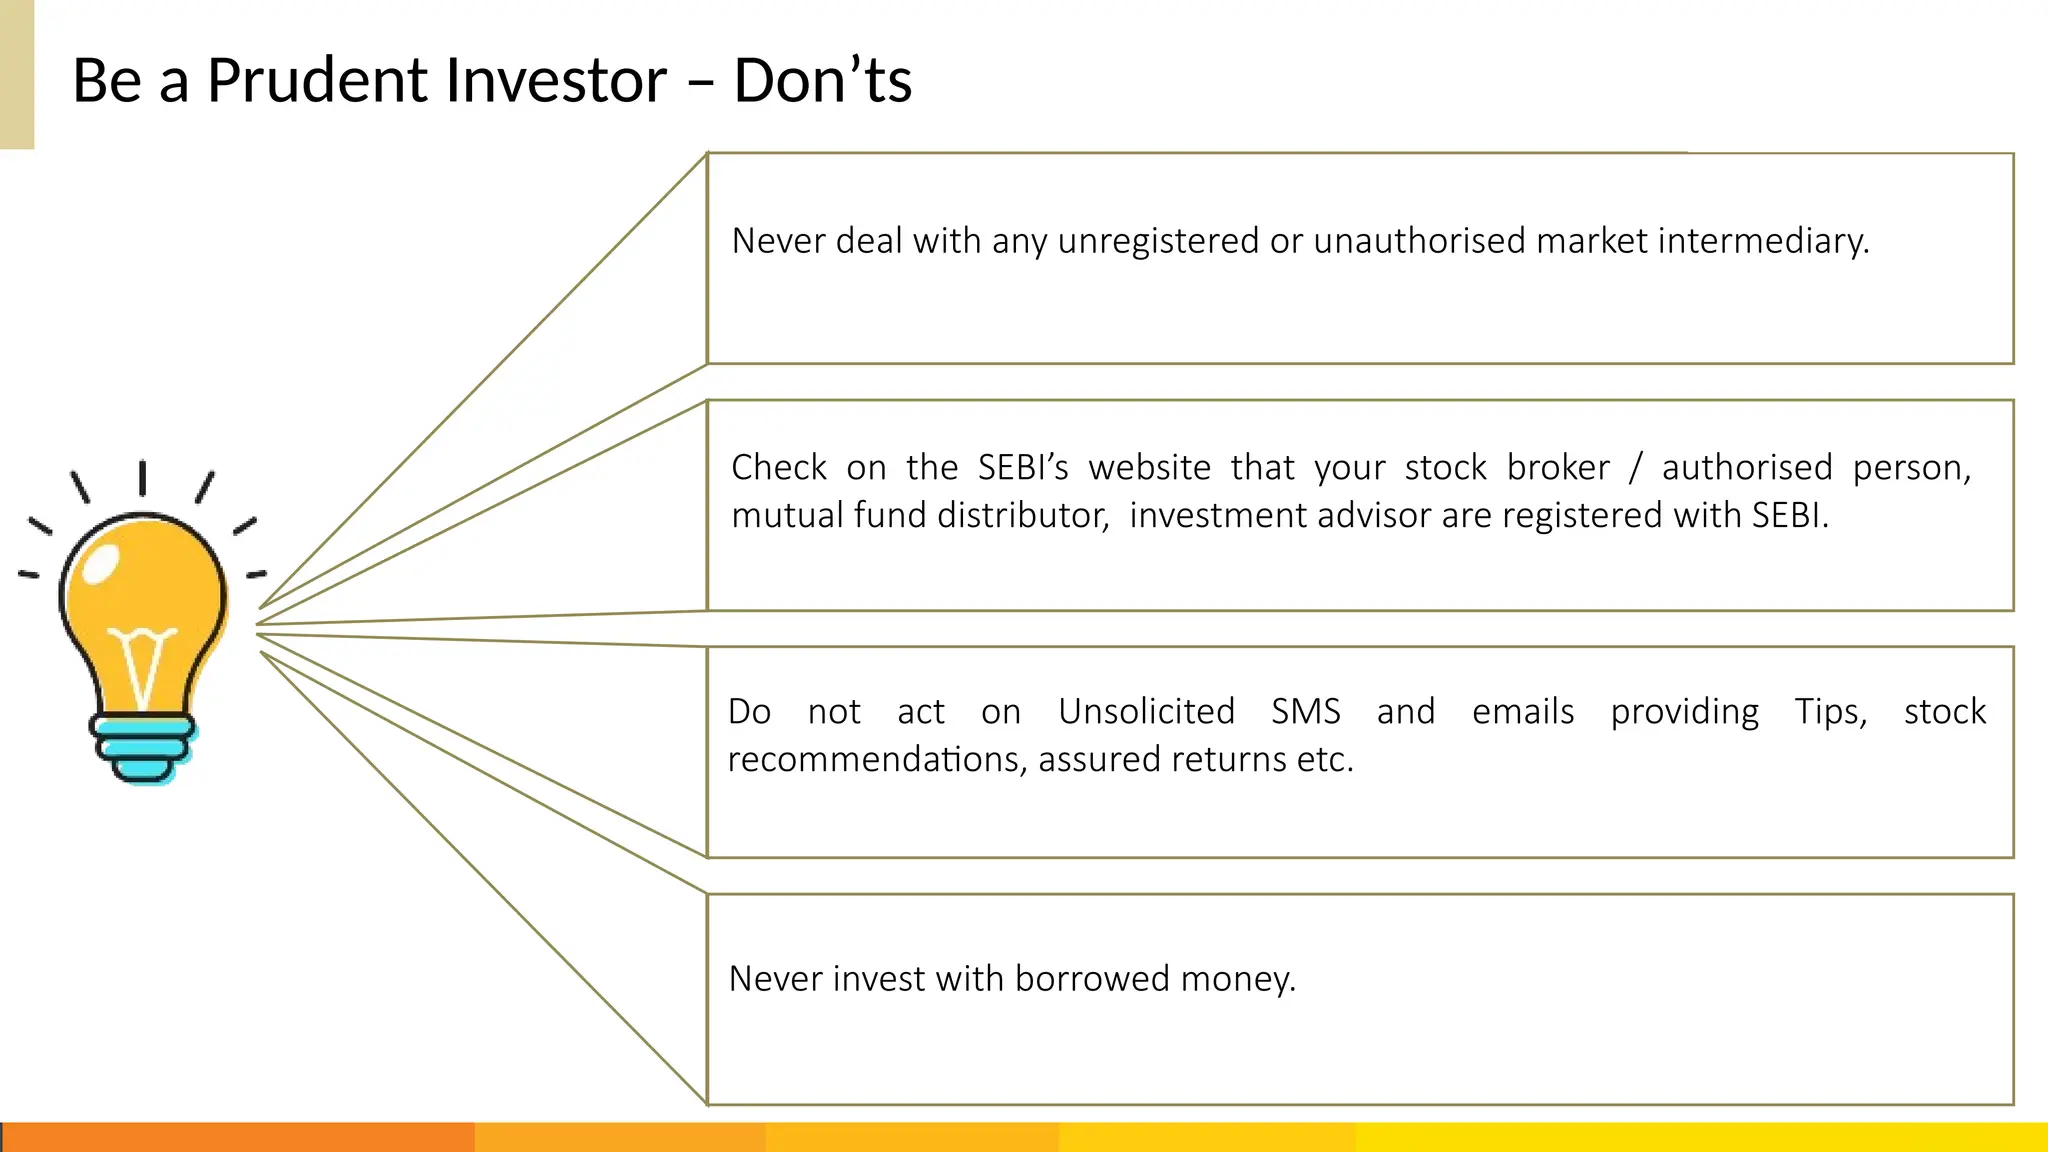
Never deal with any unregistered or unauthorised market intermediary.
Check on the SEBI’s website that your stock broker / authorised person,
mutual fund distributor, investment advisor are registered with SEBI.
Do not act on Unsolicited SMS and emails providing Tips, stock
recommendations, assured returns etc.
Never invest with borrowed money.
7.
Why Do WeInvest?
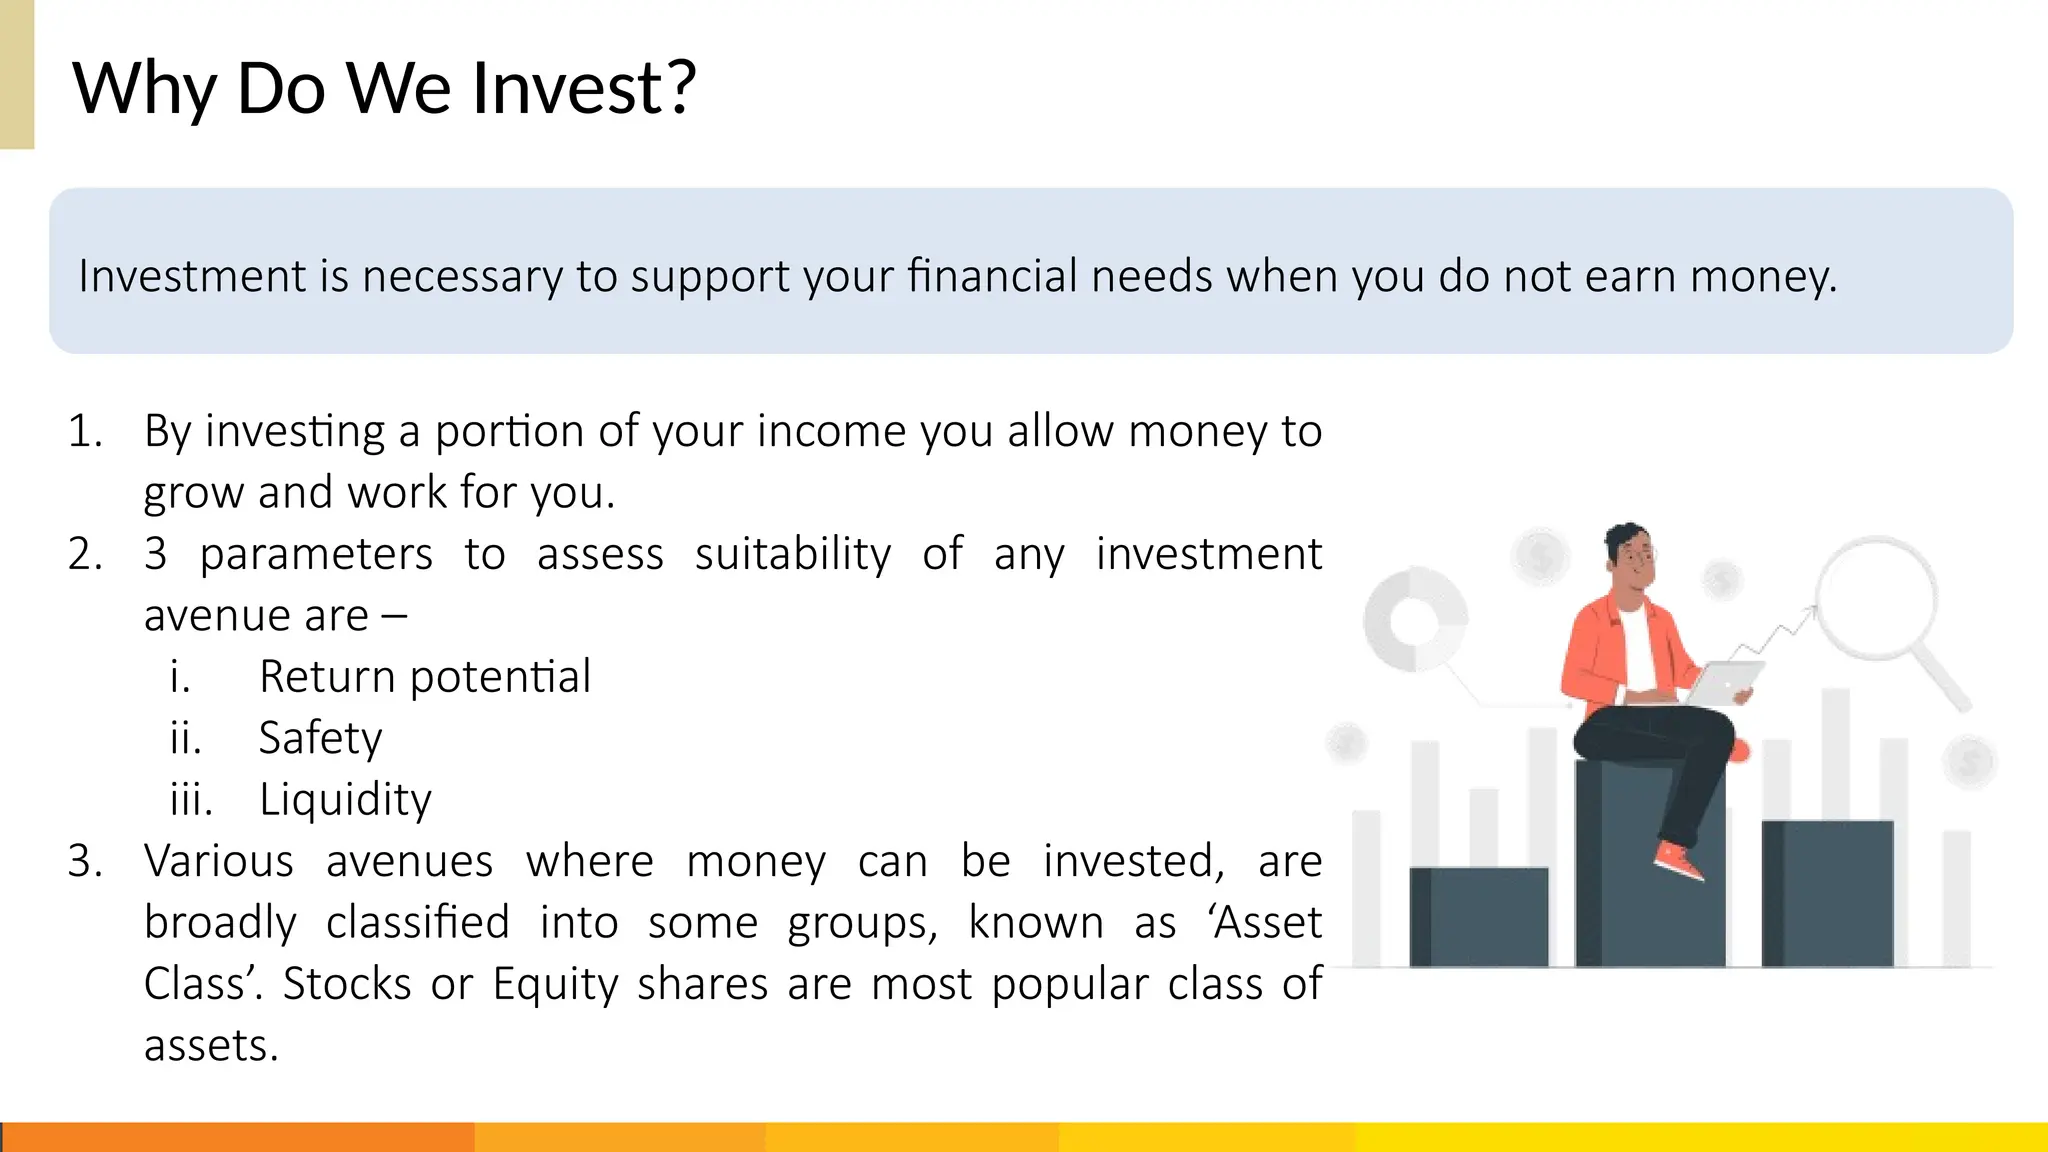
1. By investing a portion of your income you allow money to
grow and work for you.
2. 3 parameters to assess suitability of any investment
avenue are –
i. Return potential
ii. Safety
iii. Liquidity
3. Various avenues where money can be invested, are
broadly classified into some groups, known as ‘Asset
Class’. Stocks or Equity shares are most popular class of
assets.
Investment is necessary to support your financial needs when you do not earn money.
8.
What is meantby Stock Selection?
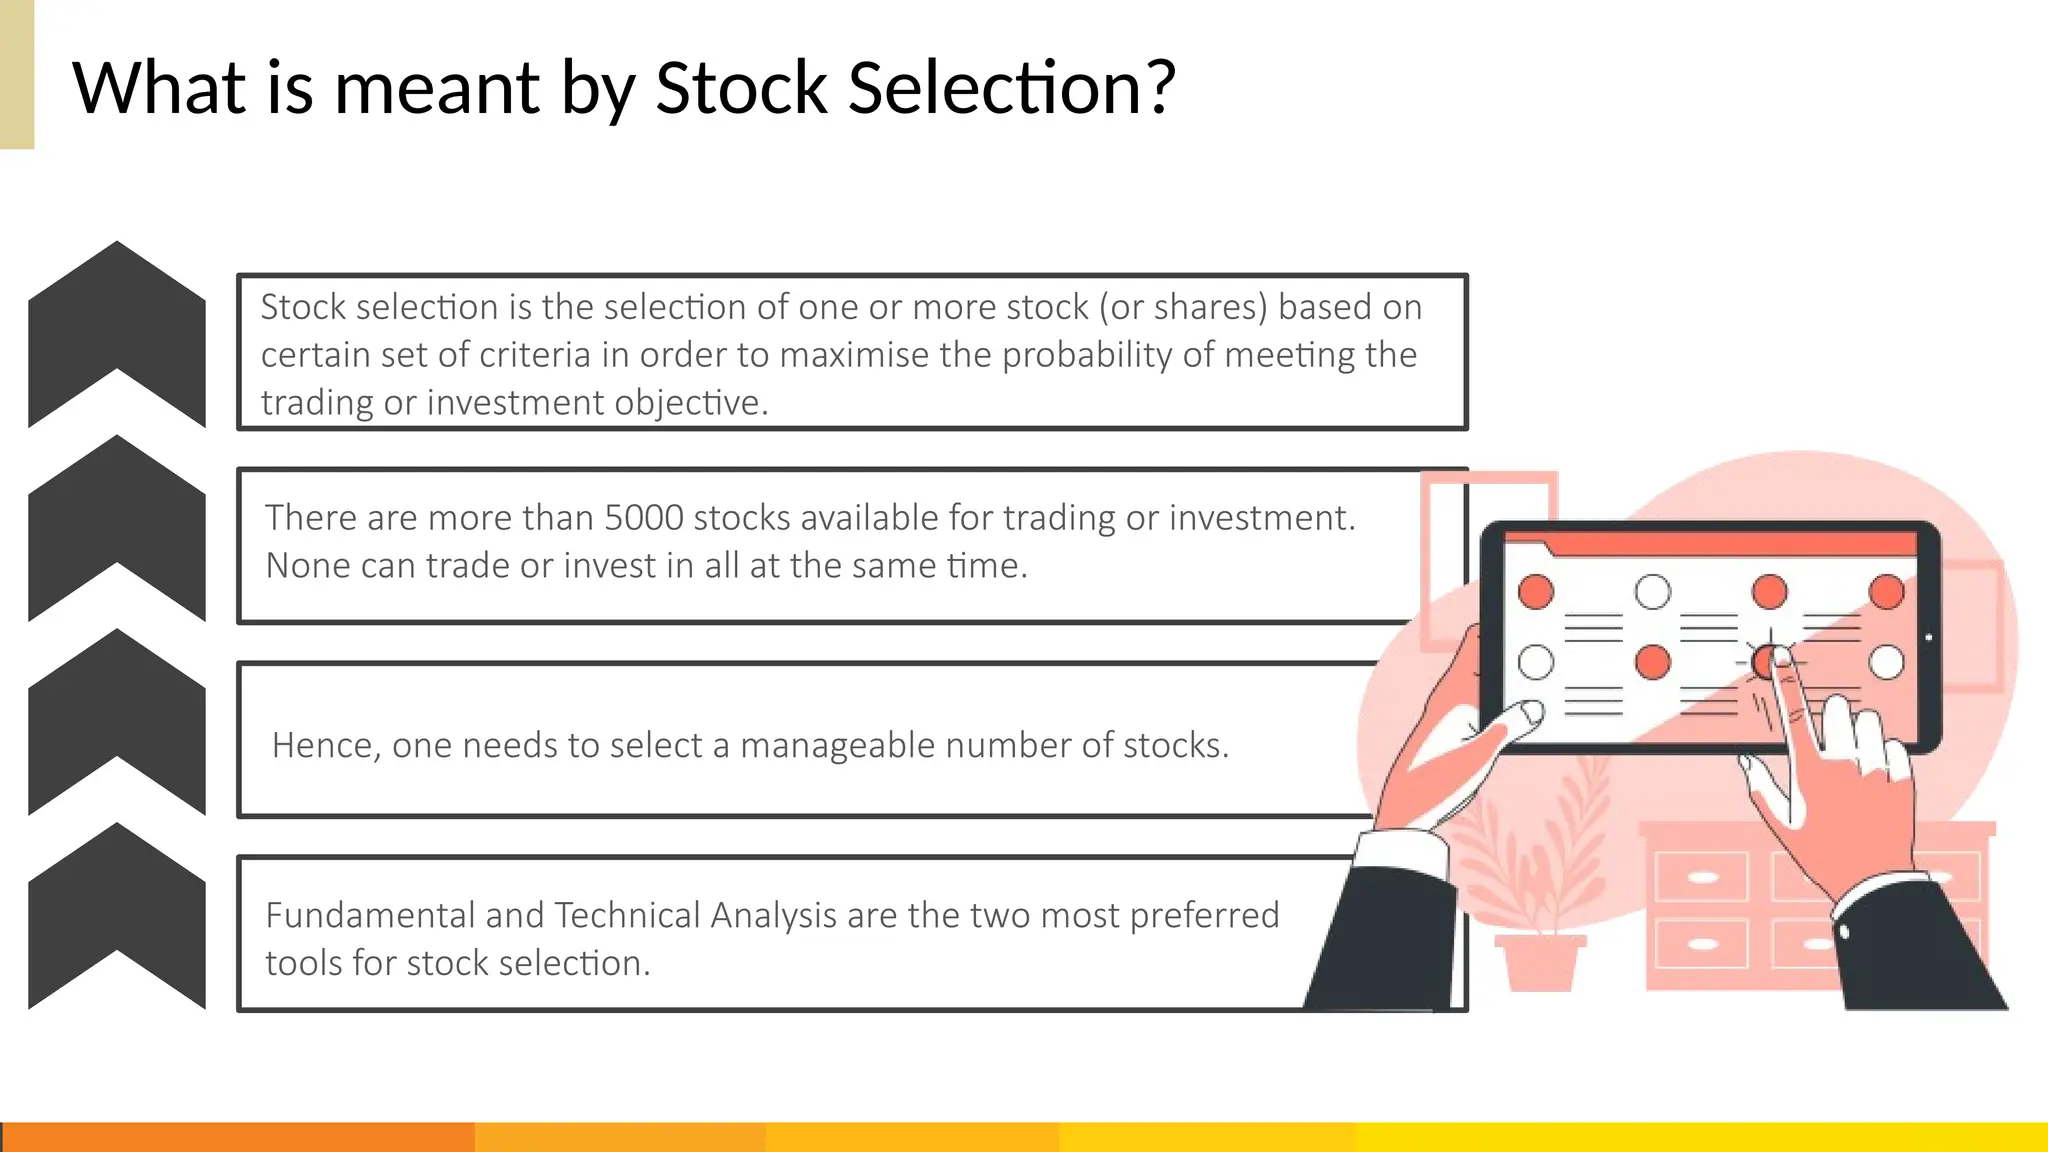
Stock selection is the selection of one or more stock (or shares) based on
certain set of criteria in order to maximise the probability of meeting the
trading or investment objective.
There are more than 5000 stocks available for trading or investment.
None can trade or invest in all at the same time.
Hence, one needs to select a manageable number of stocks.
Fundamental and Technical Analysis are the two most preferred
tools for stock selection.
Fundamental Analysis
1. Thecurrent price of a stock may not reflect the actual
value of the stock. The stock may be overvalued or
undervalued in the market.
2. Fundamental analysis helps investors to study the health of
the company, and thus leading to the actual value of the
stock.
3. This is done by using various qualitative and quantitative
factors.
4. The main purpose of this method is to identify companies
that that are fundamentally strong in order to invest in
them for the long term.
Fundamental analysis is a method used to identify the true value of a stock.
11.
Economic Analysis
1. Itinvolves assessing or examining topics or issues from an economist’s perspective.
2. This allows investors to analyse the market from the big picture to all the way down to
individual stocks.
3. By examining the economic numbers one can determine the current market strength
and have a better idea of what the future holds.
4. Key Economic indicators investors must incorporate while selecting stocks:
i. Indices (e.g. Nifty, Sensex)
ii. Gross Domestic Product (GDP)
iii. Unemployment rate
iv. Inflation rate
v. Consumer Confidence
vi. Purchase Managers' Index
12.
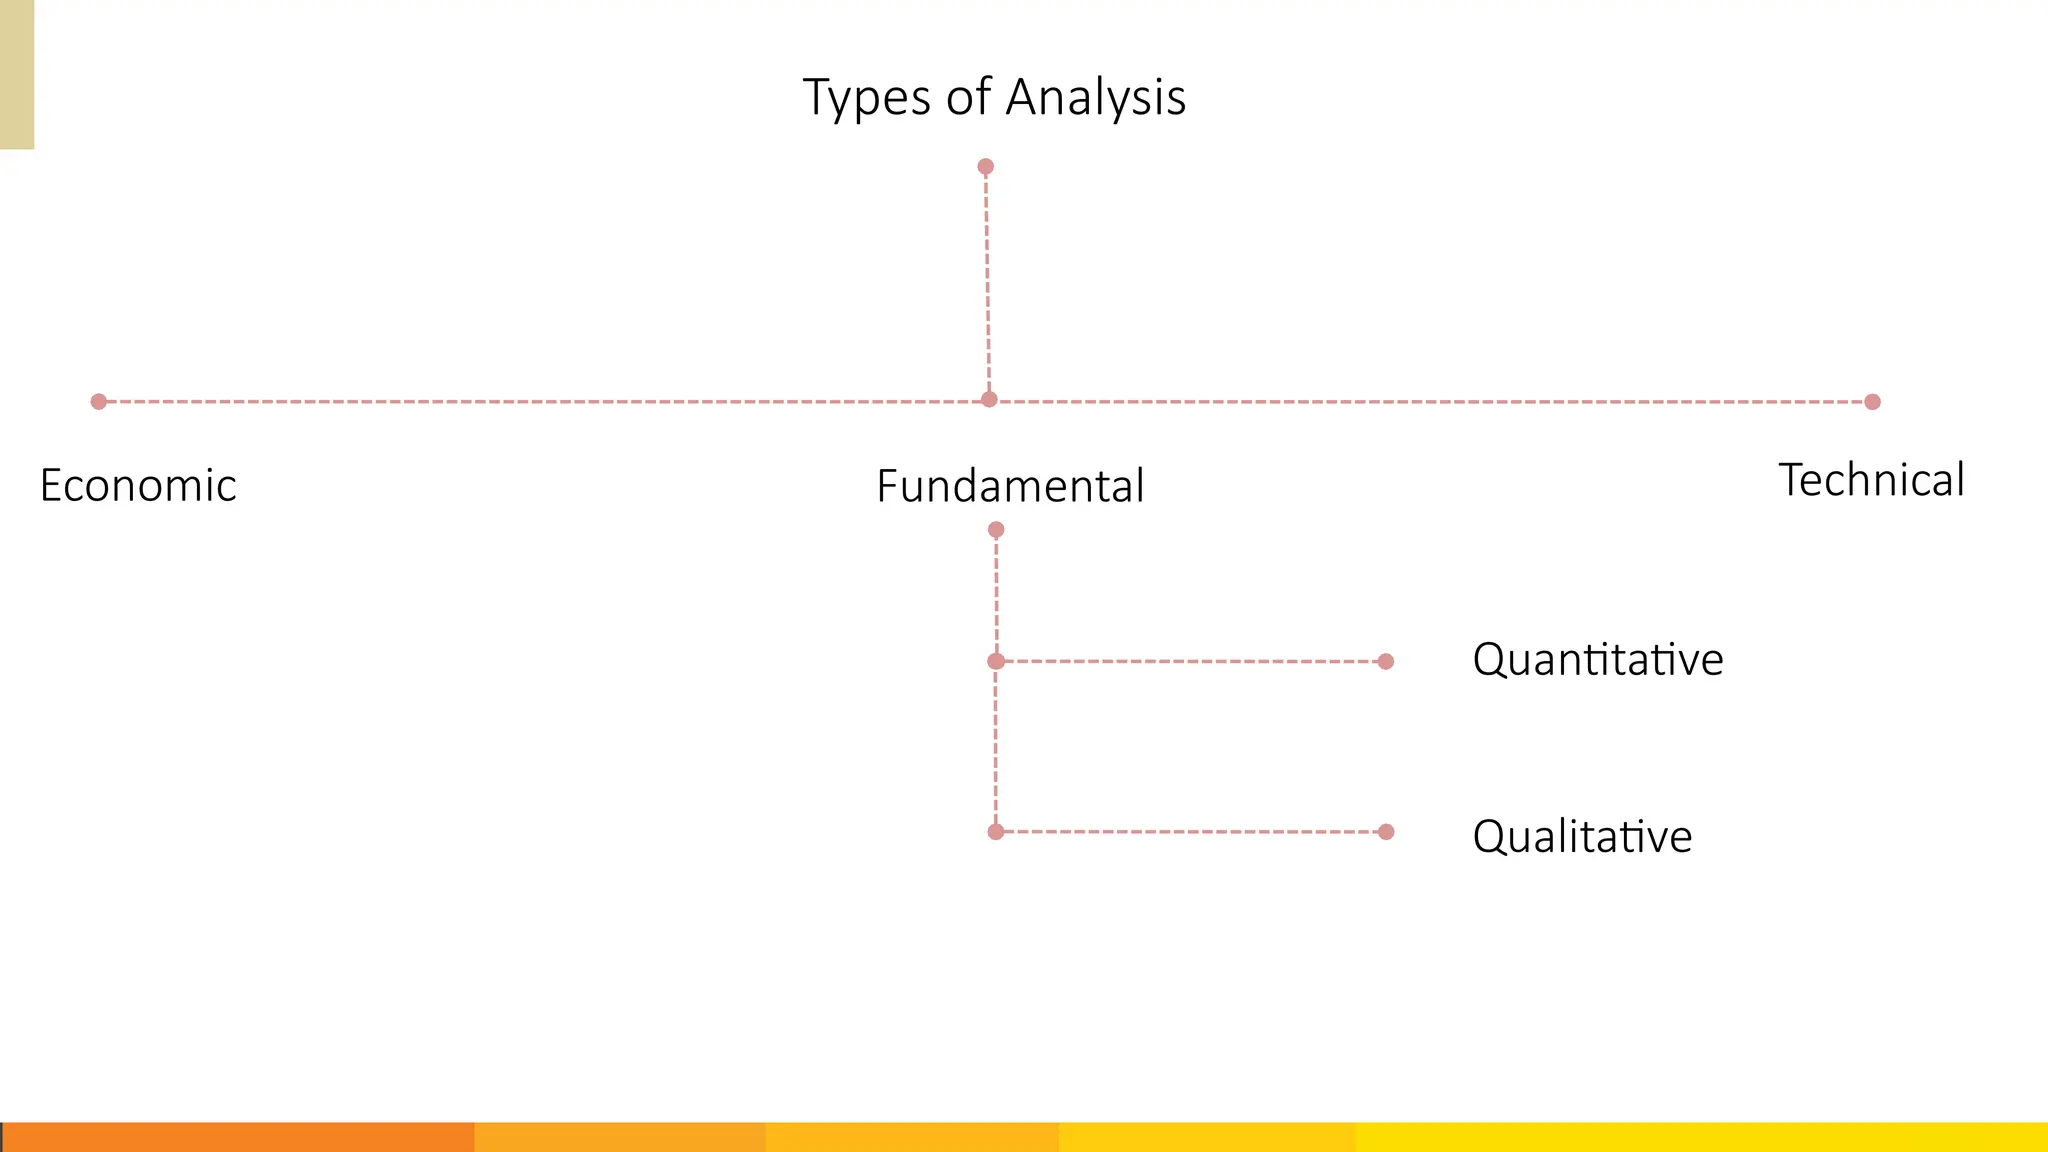
Types of FundamentalAnalysis
It takes into account information that can’t be expressed in numbers.
i. It relates to the company itself.
ii. Factors – examples –
a) Management experience and performance
b) Corporate governance
c) Industry and competition etc.
Qualitative Analysis
13.
Quantitative Analysis
Types ofFundamental Analysis
i. It is related to information that is shown in company’s financial statements. It involves
measuring simple statistical data to complex calculations.
ii. This analysis helps you to evaluate investment opportunities such as when to buy and
sell securities.
iii. Factors – examples-
a) Company’s revenues
b) Profit margins
c) Return on equity
d) Future growth potential
e) Financial ratios
14.
Using Financial Ratiosfor Fundamental Analysis
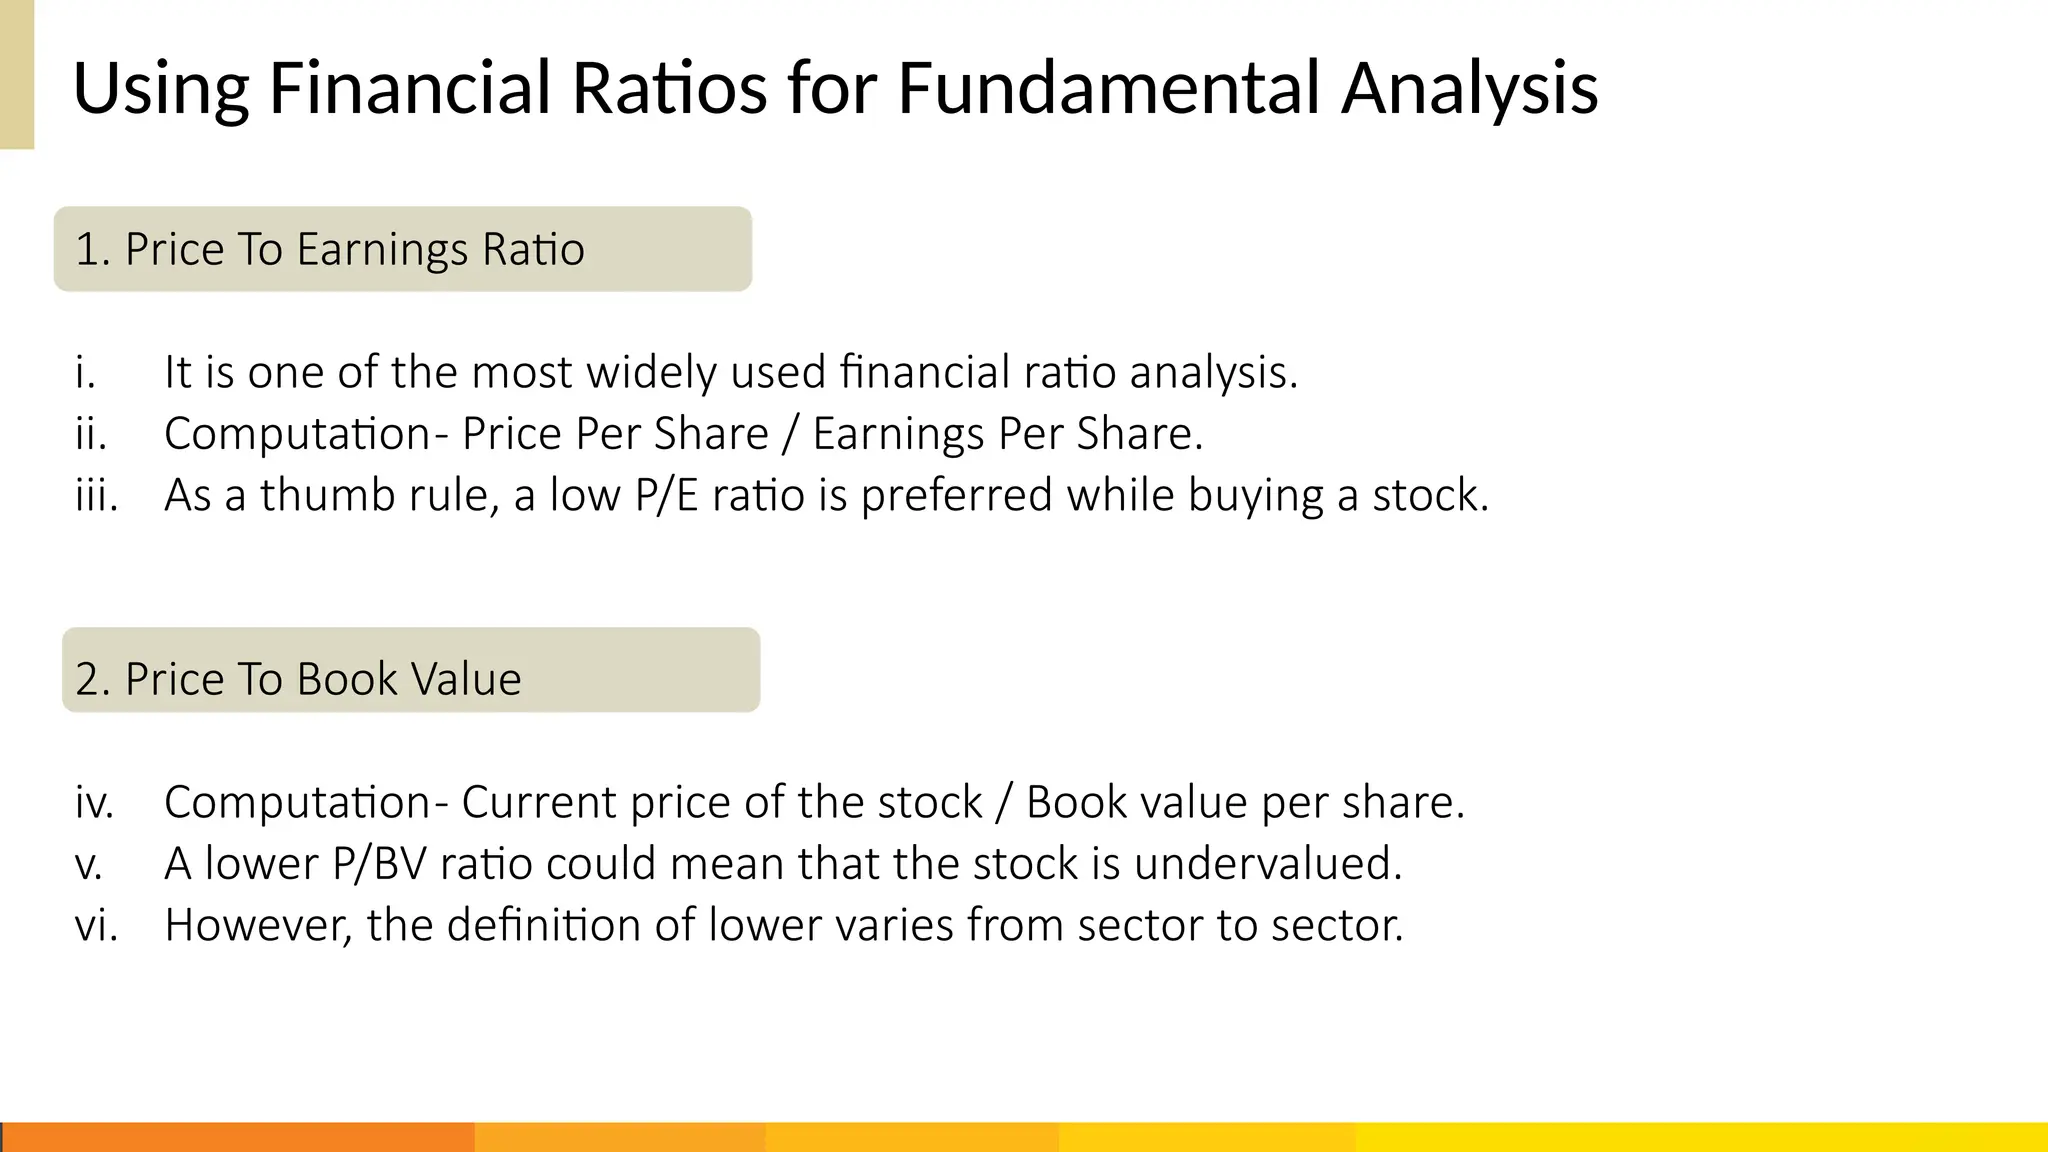
1. Price To Earnings Ratio
i. It is one of the most widely used financial ratio analysis.
ii. Computation- Price Per Share / Earnings Per Share.
iii. As a thumb rule, a low P/E ratio is preferred while buying a stock.
2. Price To Book Value
iv. Computation- Current price of the stock / Book value per share.
v. A lower P/BV ratio could mean that the stock is undervalued.
vi. However, the definition of lower varies from sector to sector.
15.
Financial Ratios
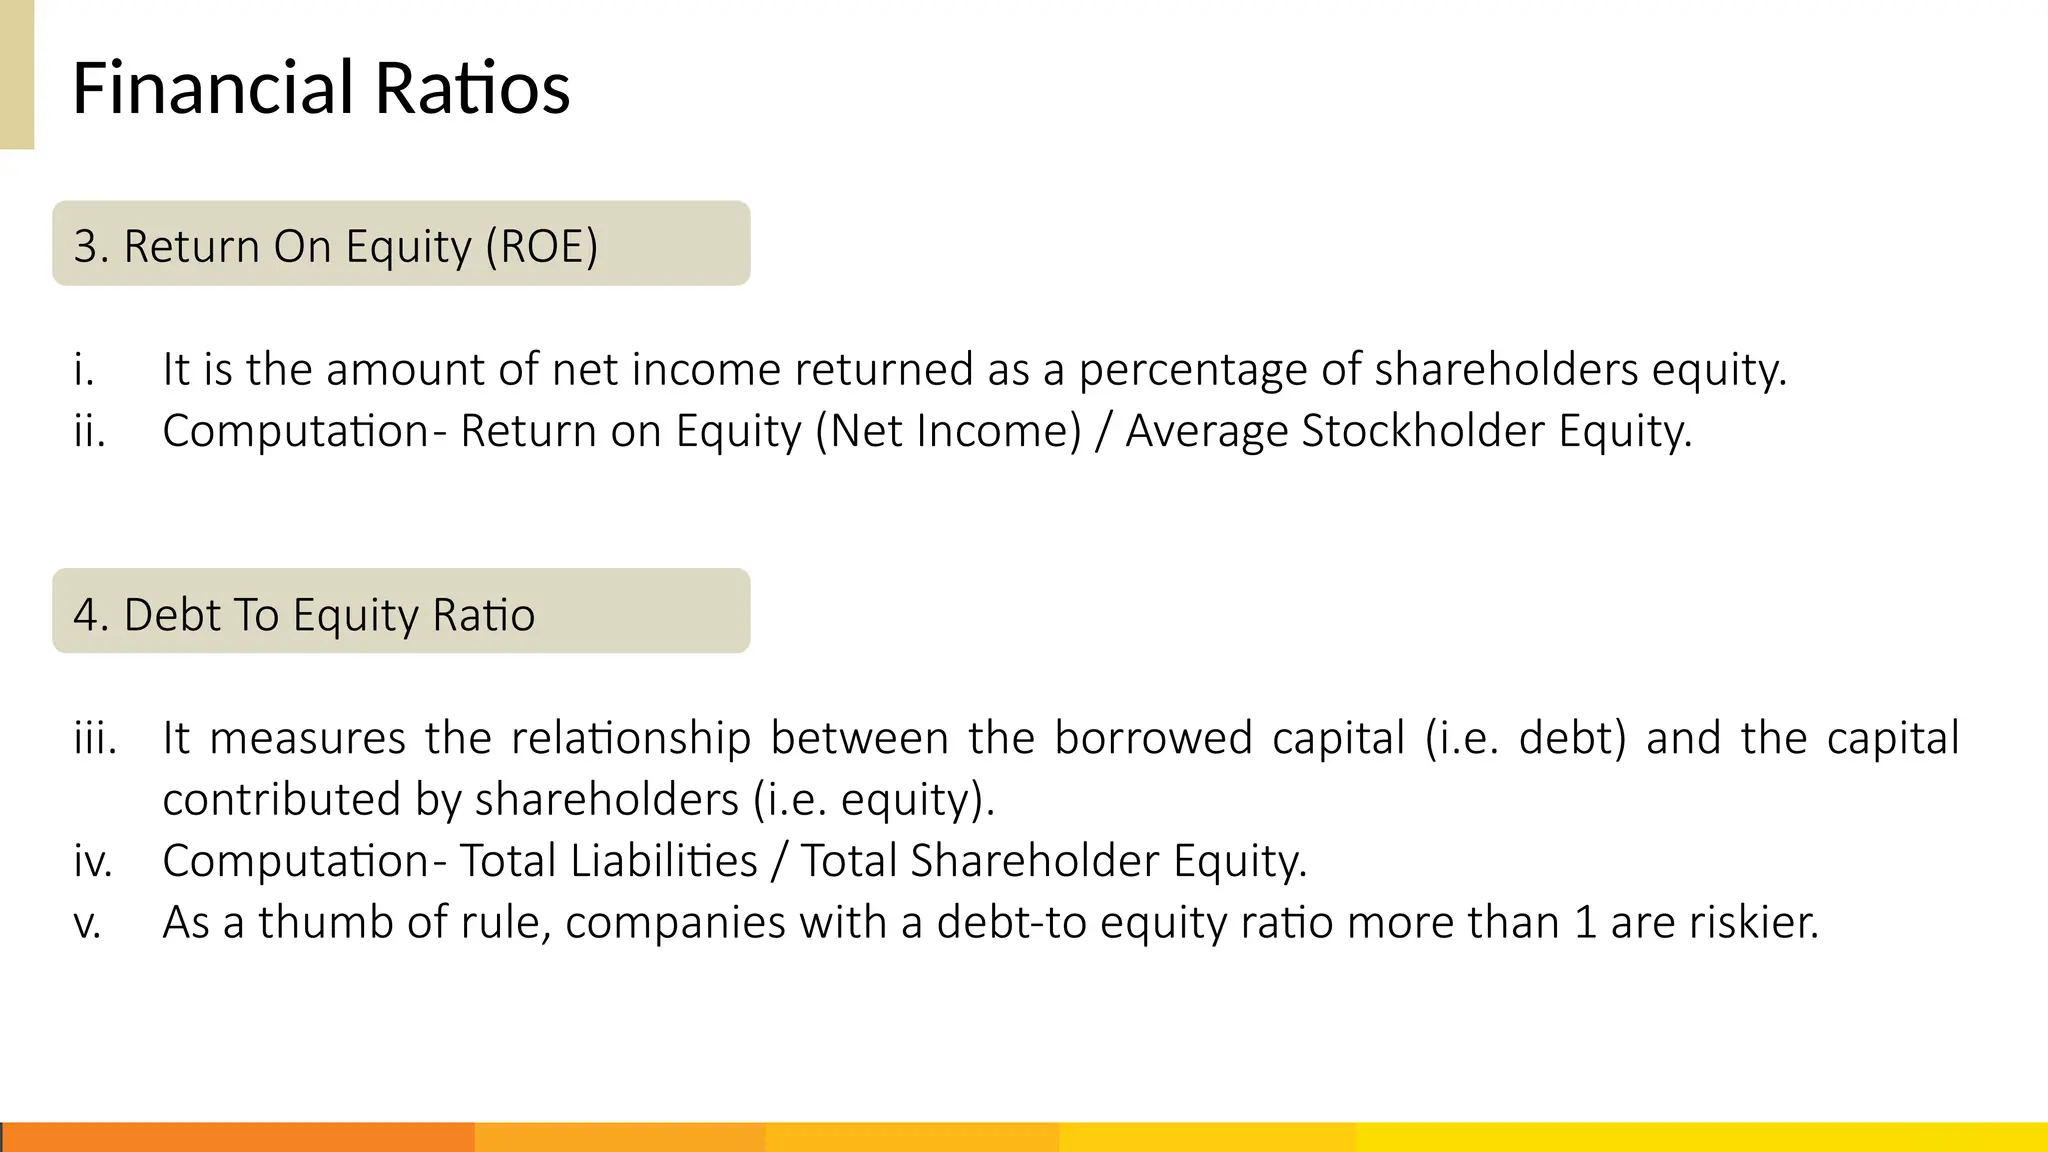
3. ReturnOn Equity (ROE)
i. It is the amount of net income returned as a percentage of shareholders equity.
ii. Computation- Return on Equity (Net Income) / Average Stockholder Equity.
4. Debt To Equity Ratio
iii. It measures the relationship between the borrowed capital (i.e. debt) and the capital
contributed by shareholders (i.e. equity).
iv. Computation- Total Liabilities / Total Shareholder Equity.
v. As a thumb of rule, companies with a debt-to equity ratio more than 1 are riskier.
16.
Financial Ratios
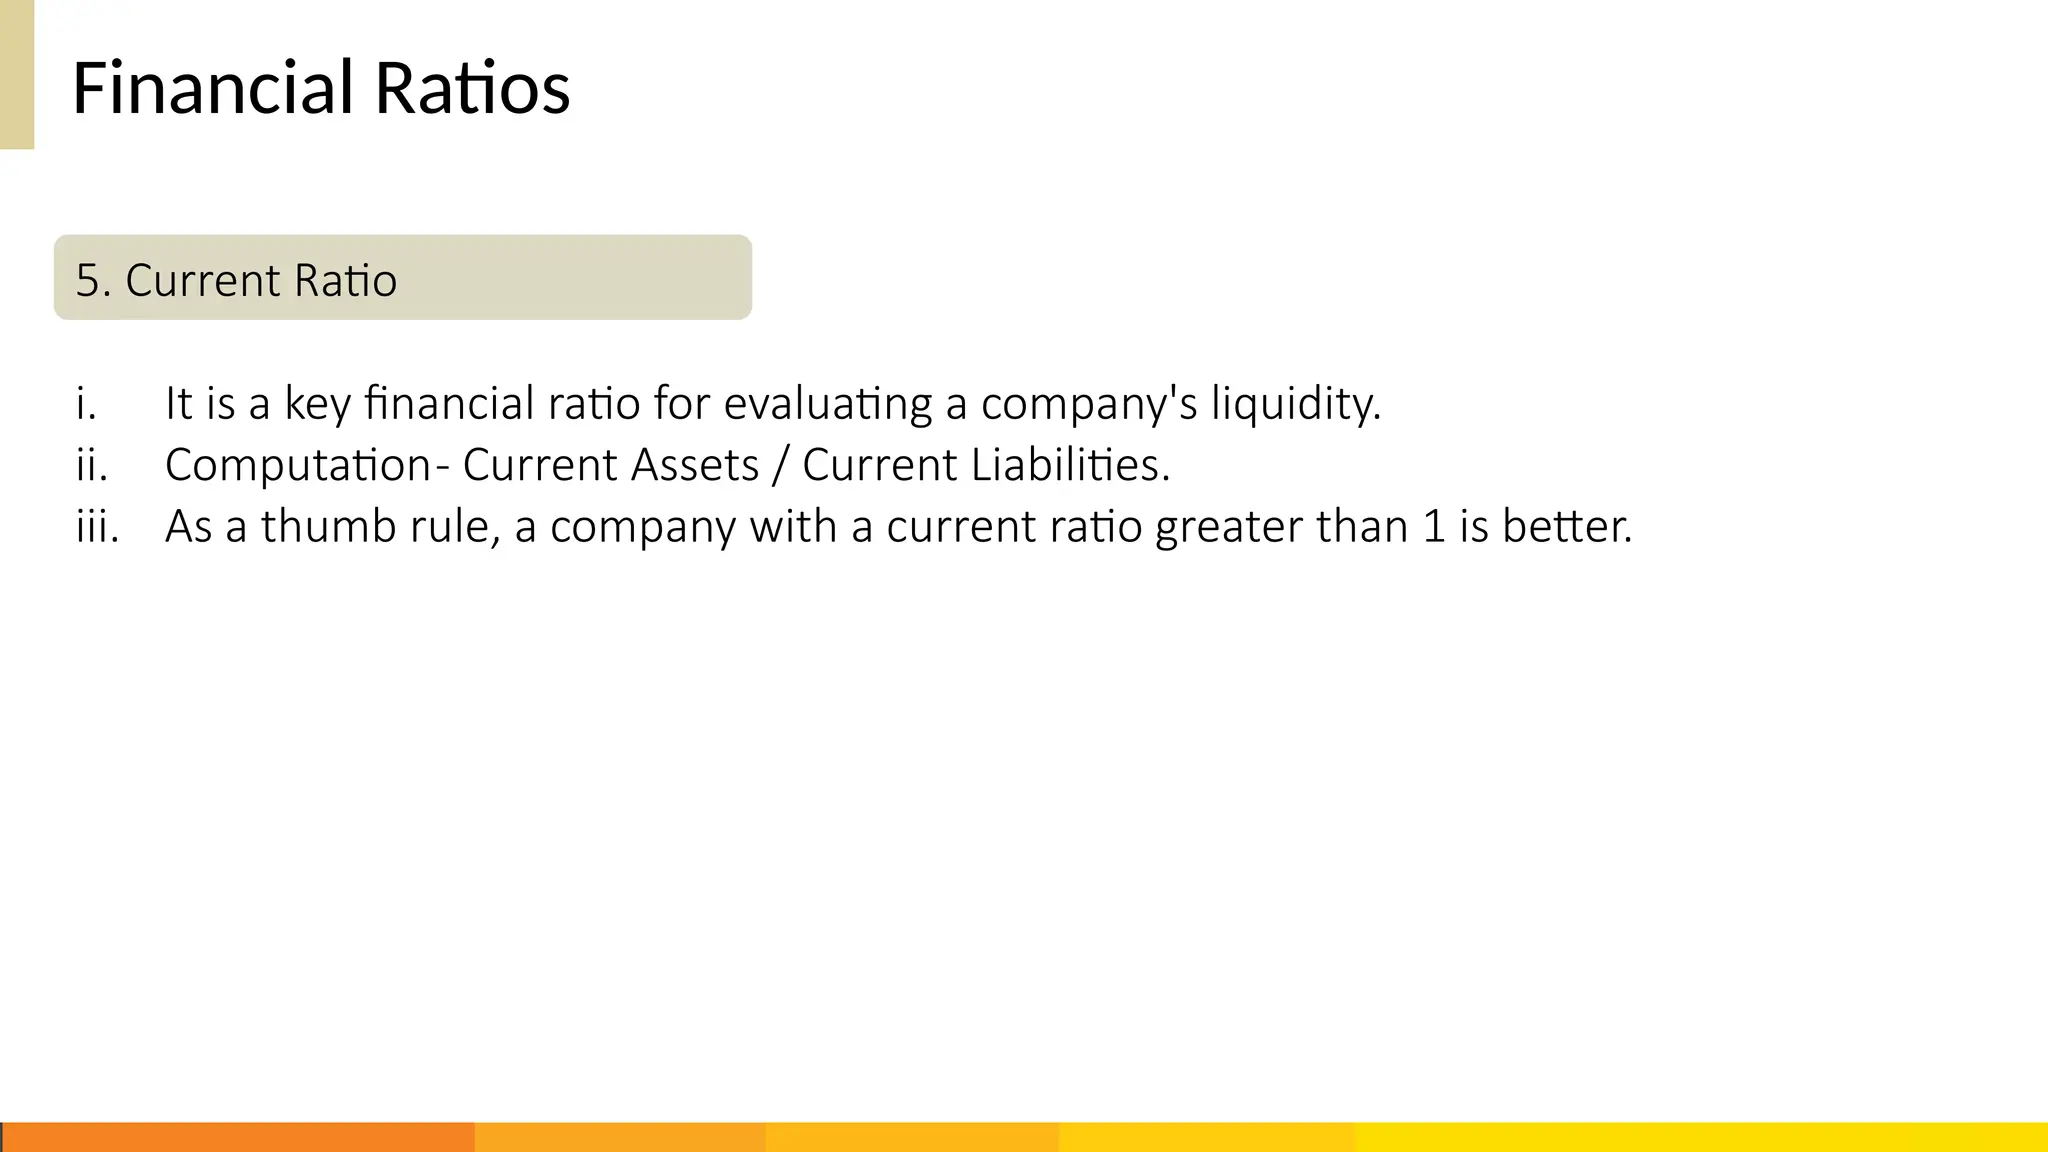
5. CurrentRatio
i. It is a key financial ratio for evaluating a company's liquidity.
ii. Computation- Current Assets / Current Liabilities.
iii. As a thumb rule, a company with a current ratio greater than 1 is better.
17.
Technical Analysis
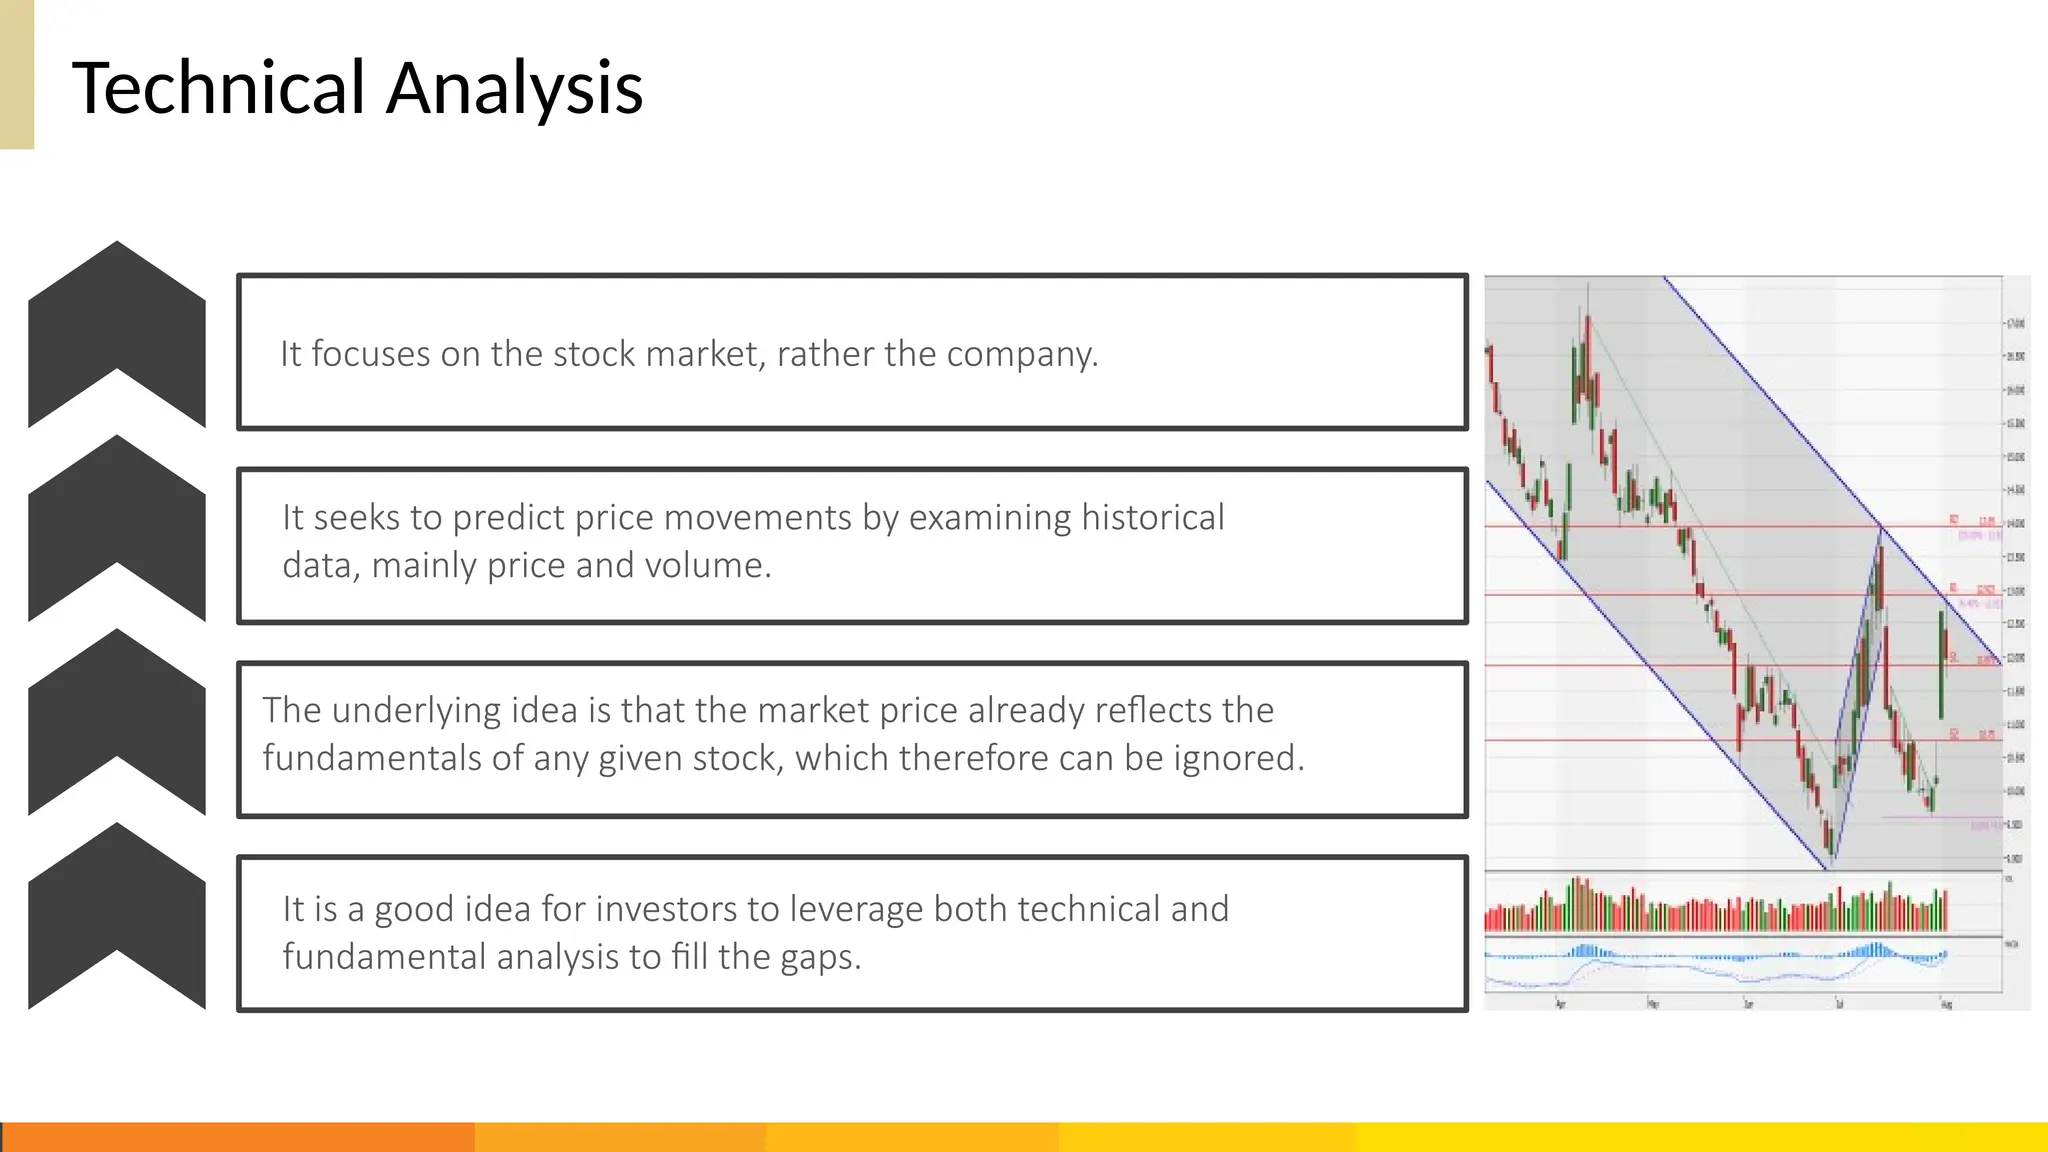
It focuseson the stock market, rather the company.
It seeks to predict price movements by examining historical
data, mainly price and volume.
The underlying idea is that the market price already reflects the
fundamentals of any given stock, which therefore can be ignored.
It is a good idea for investors to leverage both technical and
fundamental analysis to fill the gaps.
18.
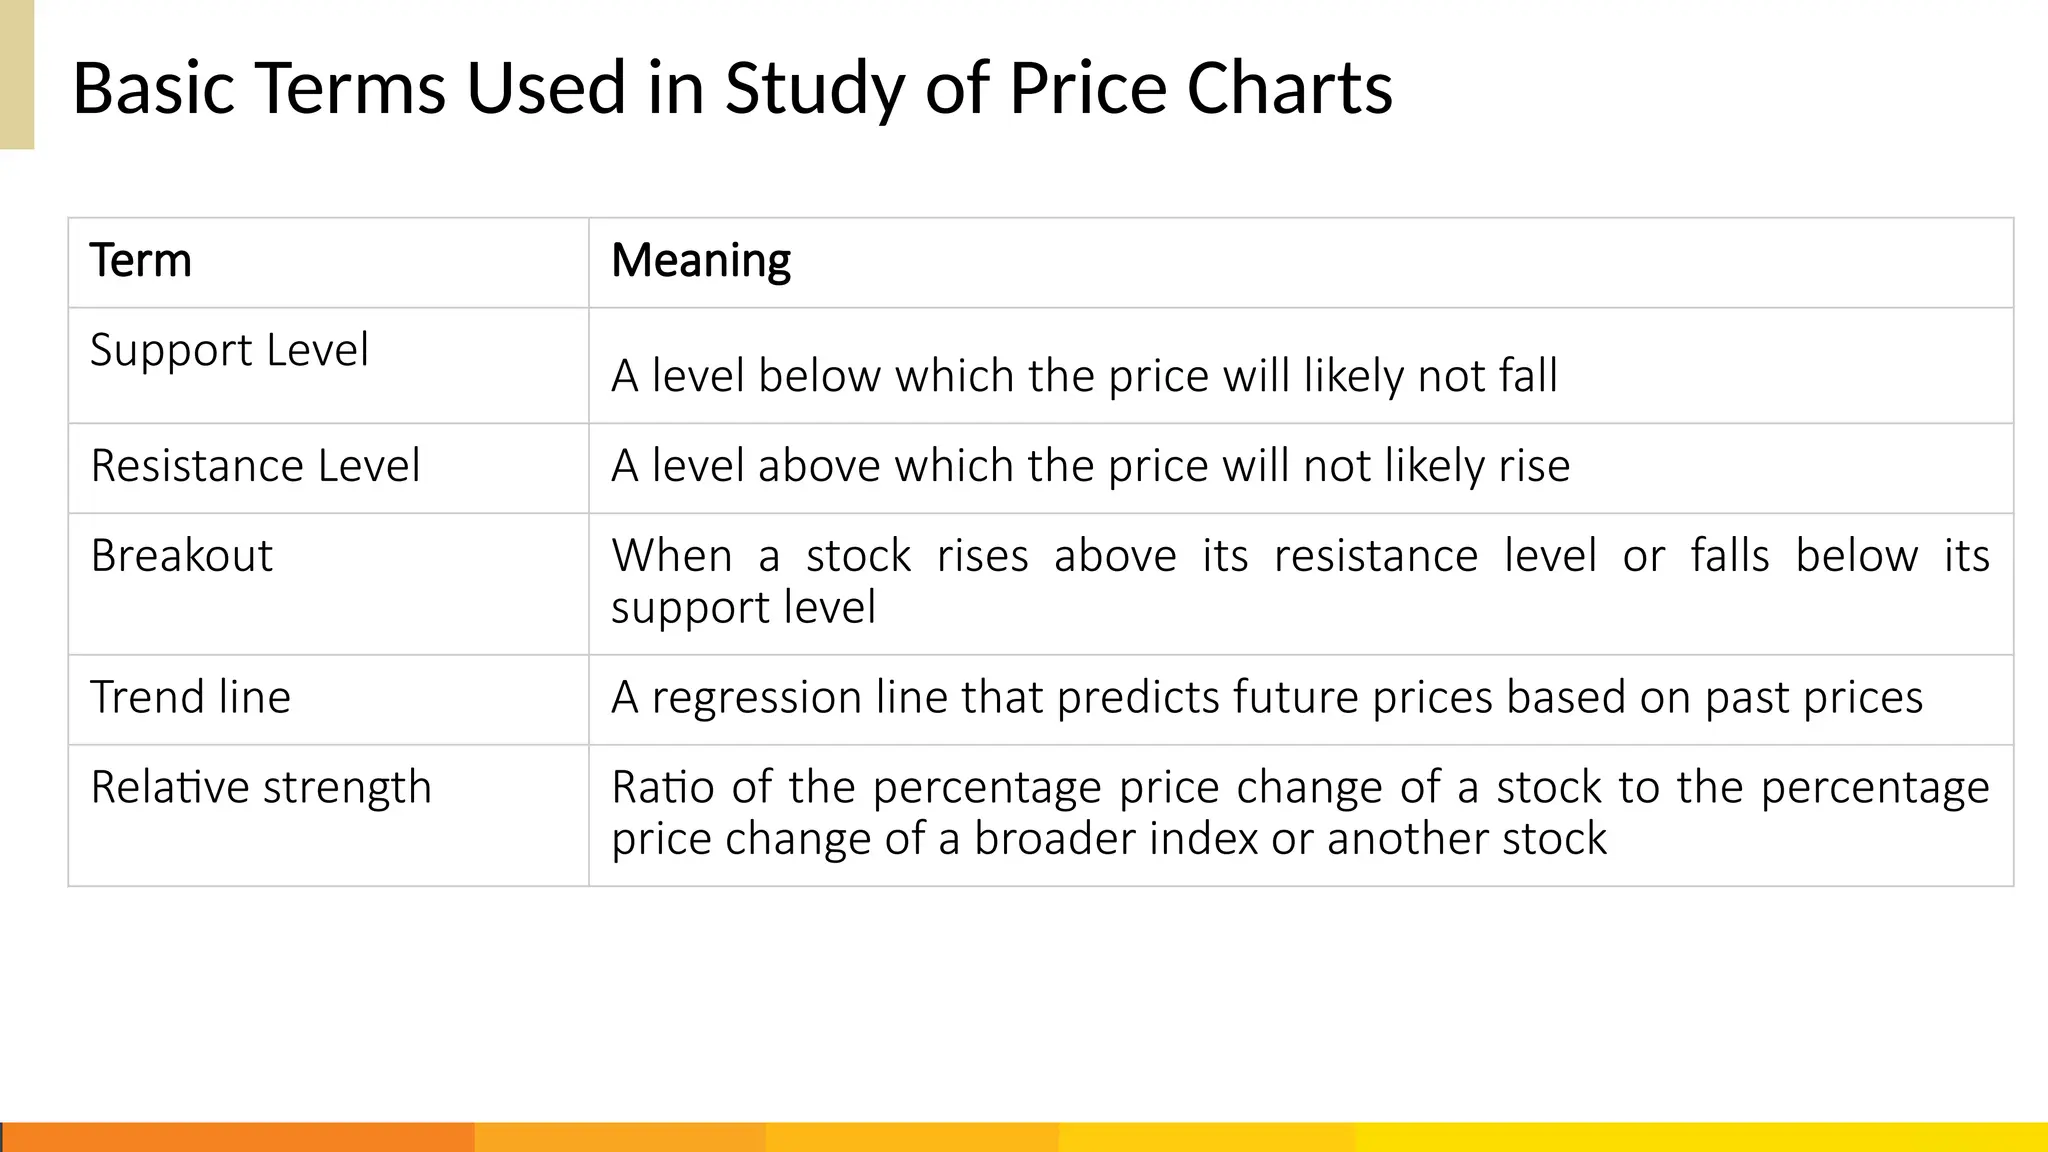
Basic Terms Usedin Study of Price Charts
Term Meaning
Support Level
A level below which the price will likely not fall
Resistance Level A level above which the price will not likely rise
Breakout When a stock rises above its resistance level or falls below its
support level
Trend line A regression line that predicts future prices based on past prices
Relative strength Ratio of the percentage price change of a stock to the percentage
price change of a broader index or another stock
19.
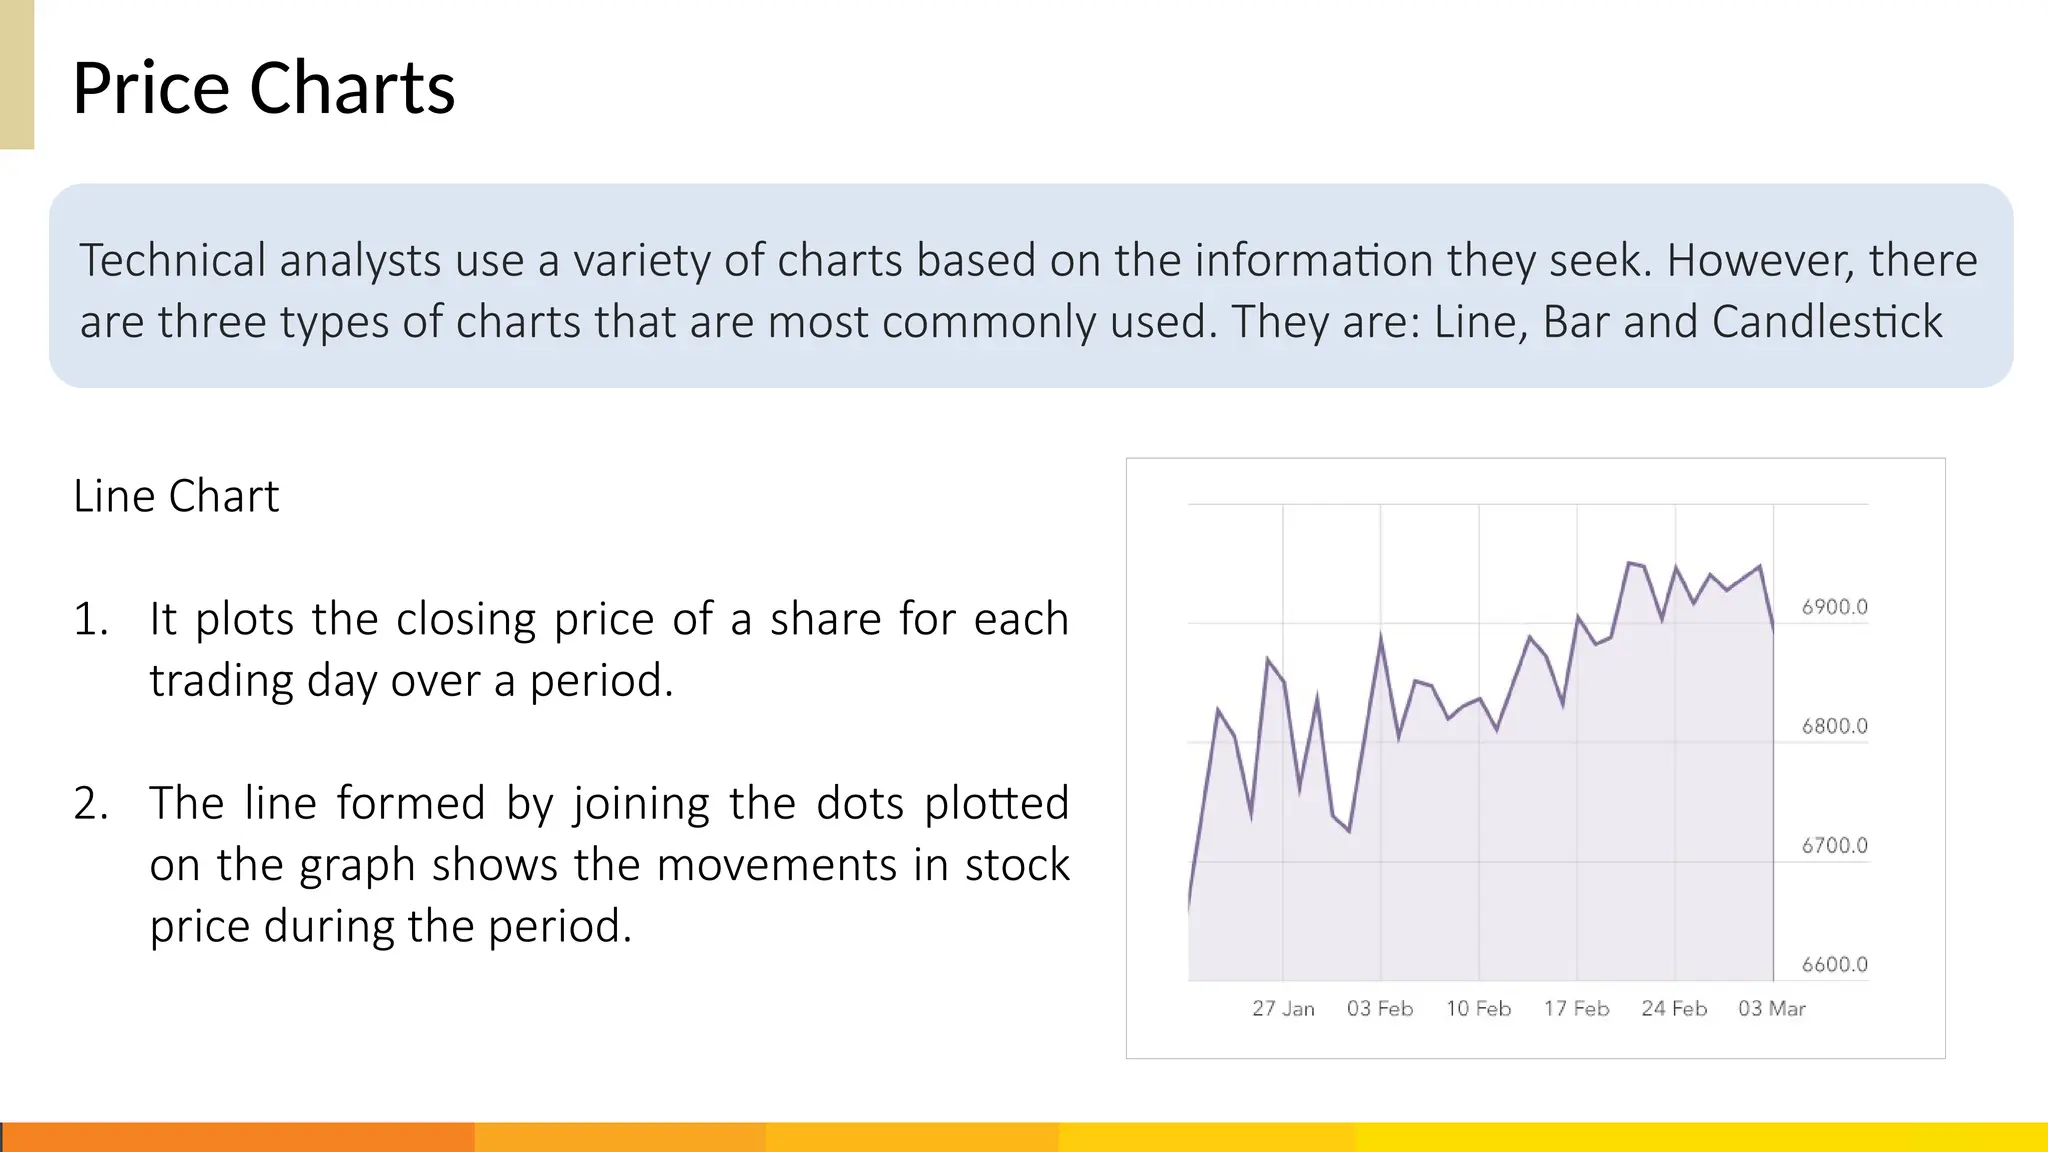
Price Charts
Line Chart
1.It plots the closing price of a share for each
trading day over a period.
2. The line formed by joining the dots plotted
on the graph shows the movements in stock
price during the period.
Technical analysts use a variety of charts based on the information they seek. However, there
are three types of charts that are most commonly used. They are: Line, Bar and Candlestick
20.
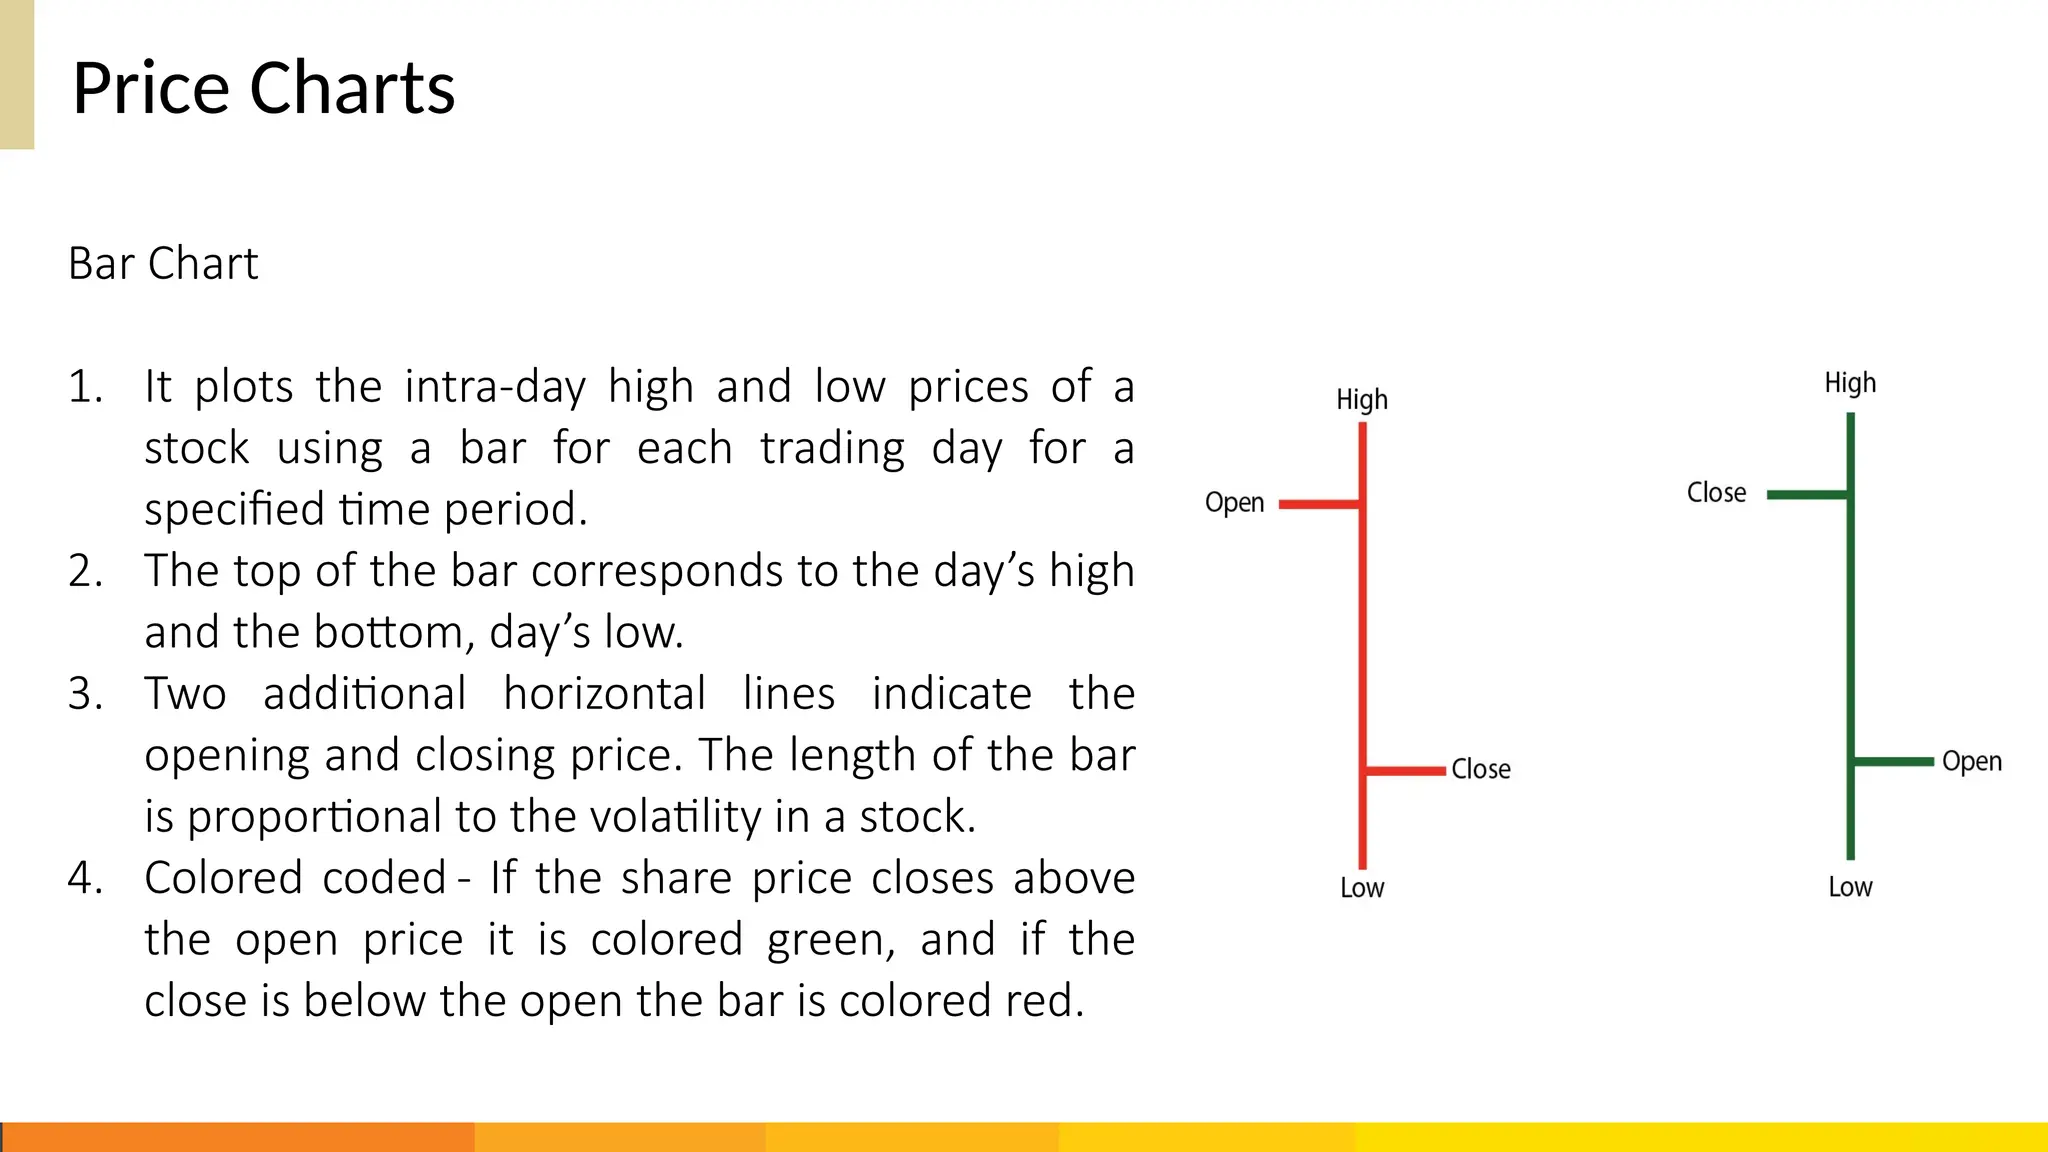
Price Charts
Bar Chart
1.It plots the intra-day high and low prices of a
stock using a bar for each trading day for a
specified time period.
2. The top of the bar corresponds to the day’s high
and the bottom, day’s low.
3. Two additional horizontal lines indicate the
opening and closing price. The length of the bar
is proportional to the volatility in a stock.
4. Colored coded - If the share price closes above
the open price it is colored green, and if the
close is below the open the bar is colored red.
21.
Price Charts
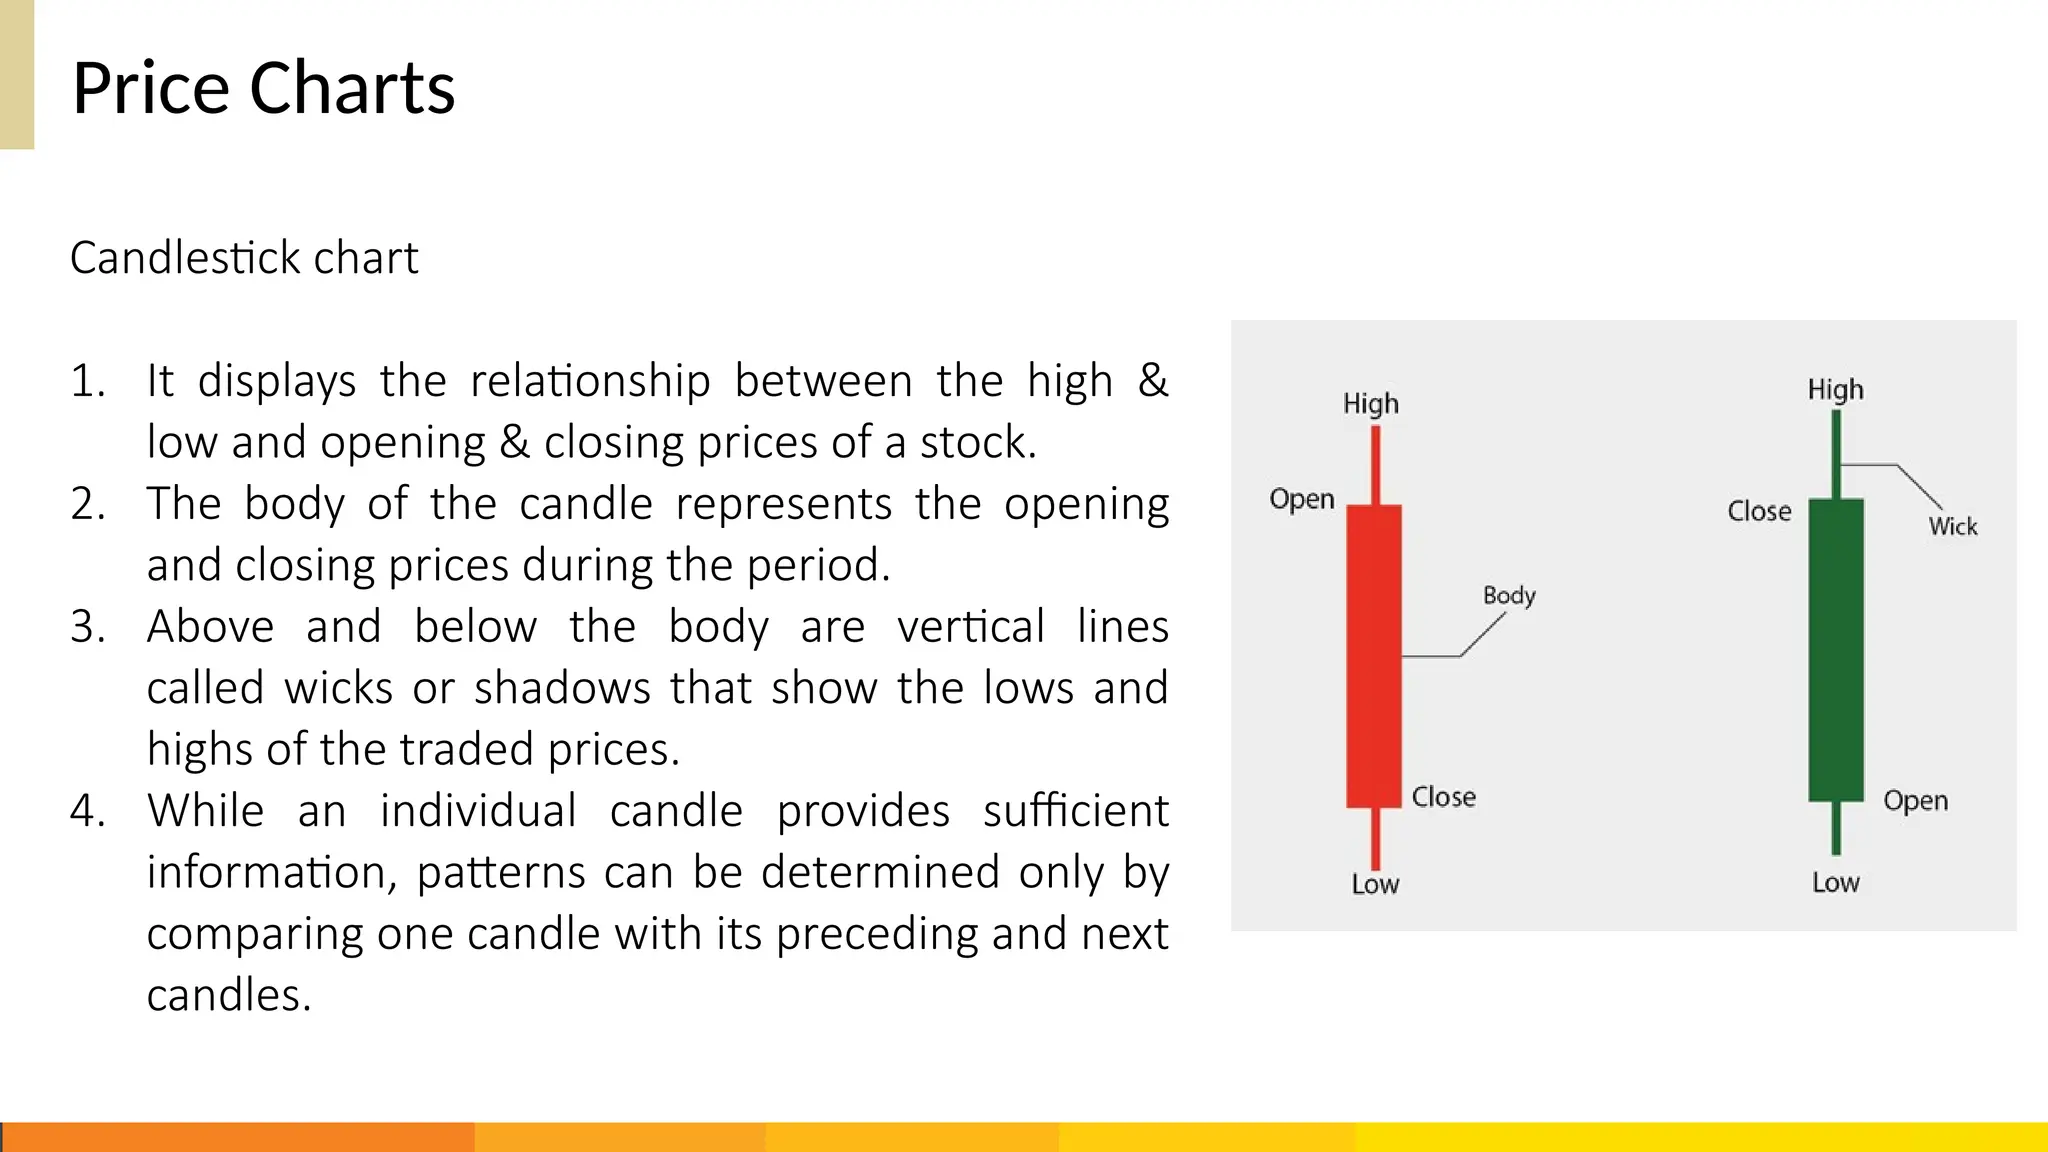
Candlestick chart
1.It displays the relationship between the high &
low and opening & closing prices of a stock.
2. The body of the candle represents the opening
and closing prices during the period.
3. Above and below the body are vertical lines
called wicks or shadows that show the lows and
highs of the traded prices.
4. While an individual candle provides sufficient
information, patterns can be determined only by
comparing one candle with its preceding and next
candles.
22.
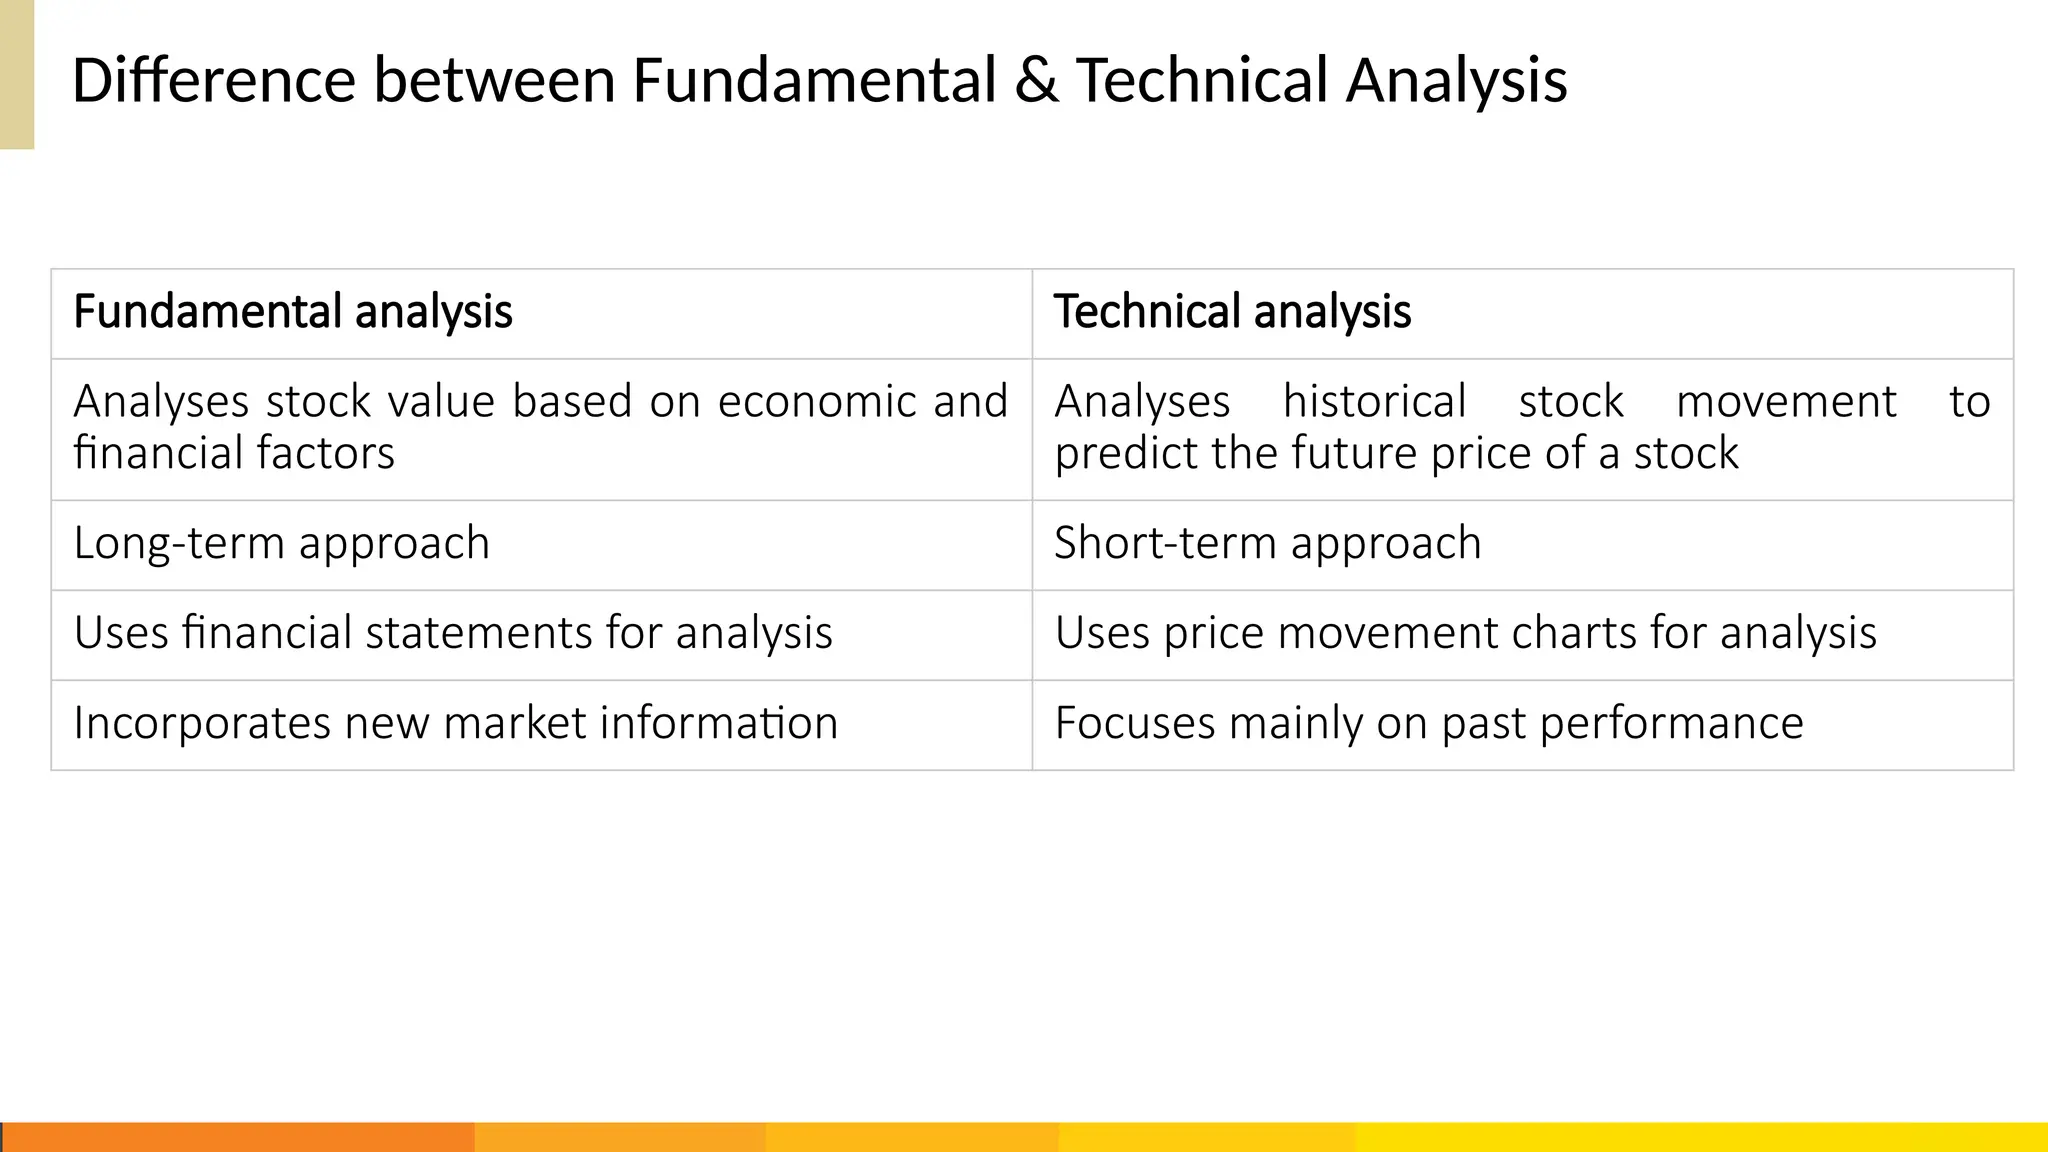
Difference between Fundamental& Technical Analysis
Fundamental analysis Technical analysis
Analyses stock value based on economic and
financial factors
Analyses historical stock movement to
predict the future price of a stock
Long-term approach Short-term approach
Uses financial statements for analysis Uses price movement charts for analysis
Incorporates new market information Focuses mainly on past performance
23.
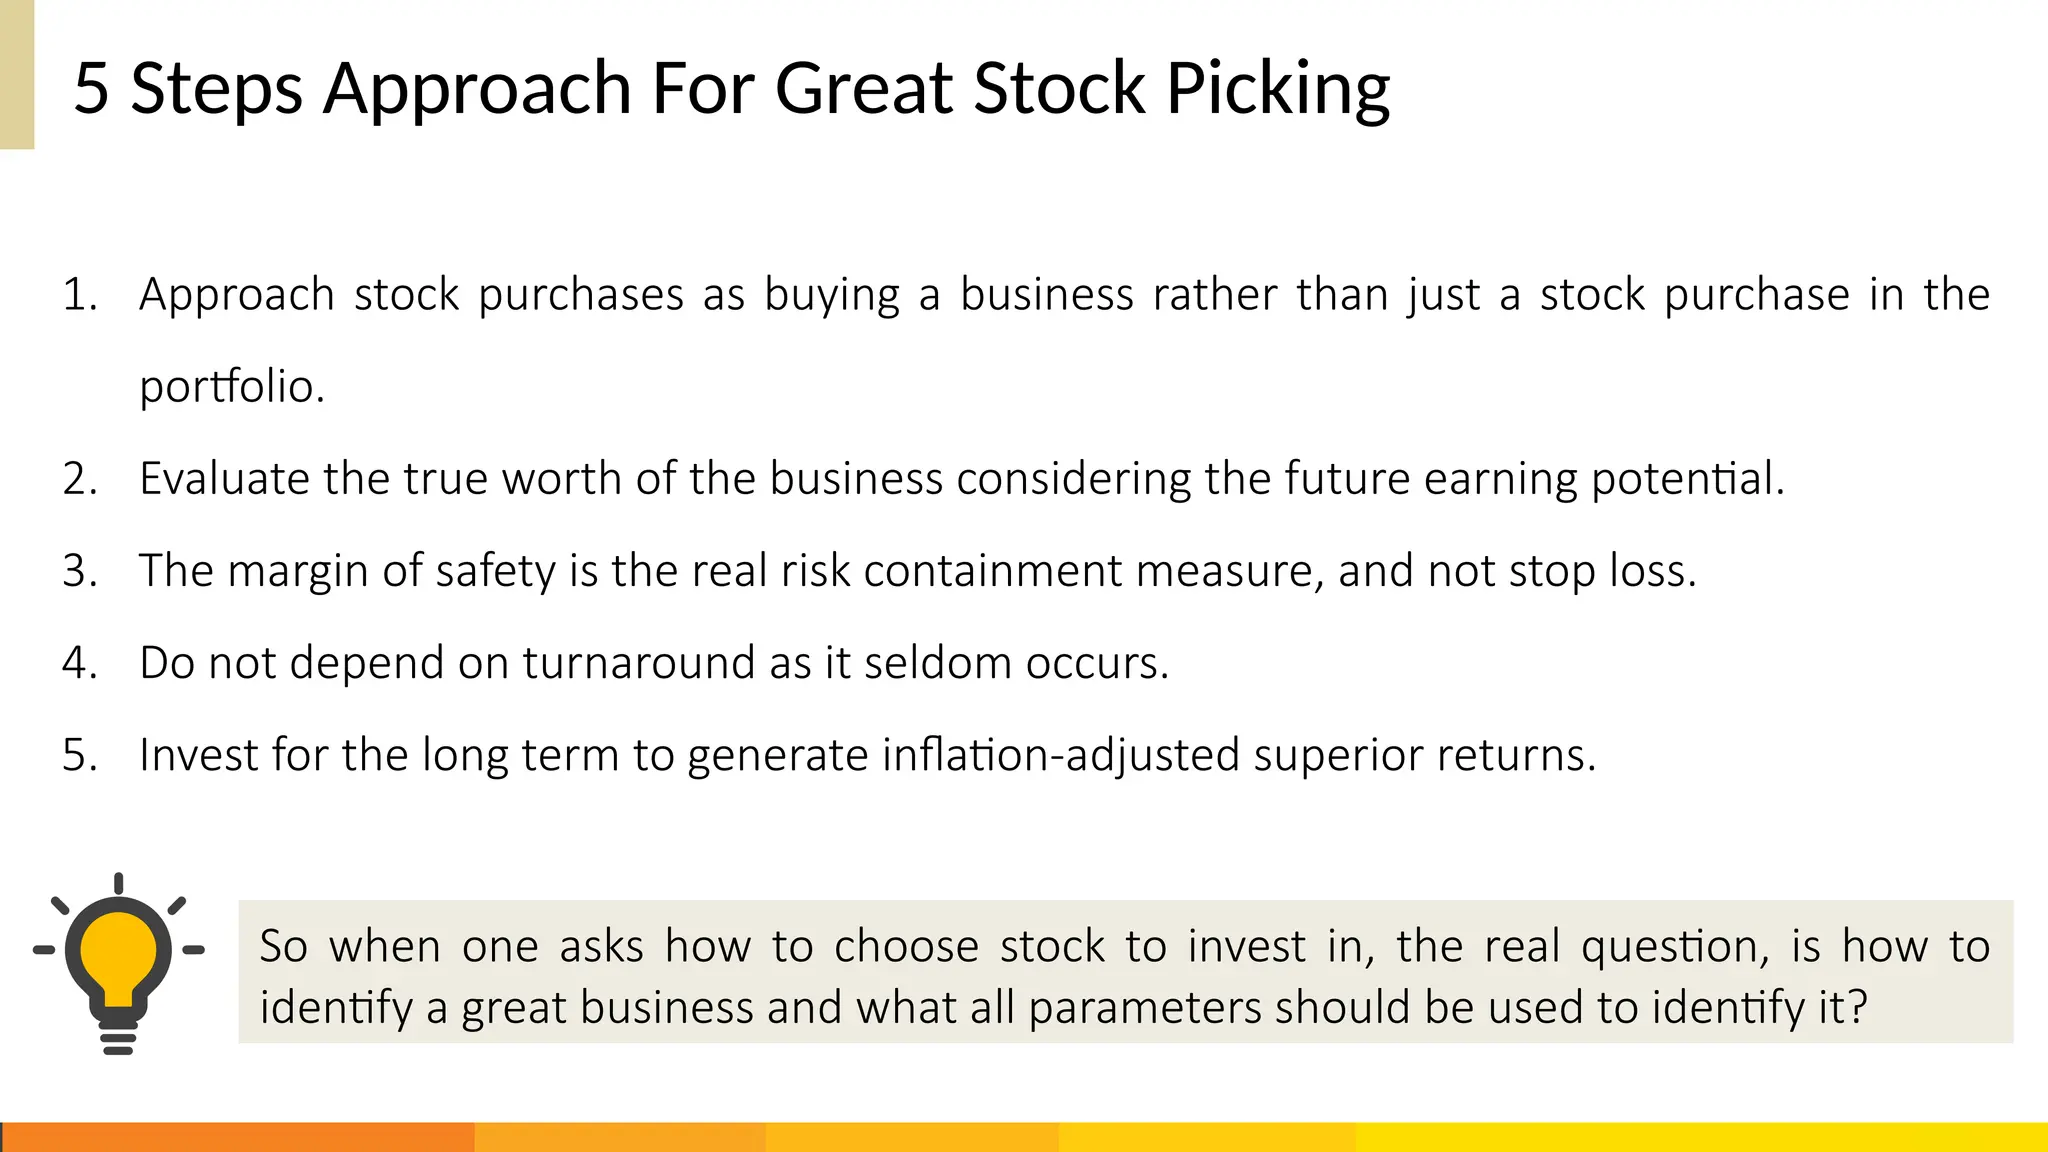
5 Steps ApproachFor Great Stock Picking
1. Approach stock purchases as buying a business rather than just a stock purchase in the
portfolio.
2. Evaluate the true worth of the business considering the future earning potential.
3. The margin of safety is the real risk containment measure, and not stop loss.
4. Do not depend on turnaround as it seldom occurs.
5. Invest for the long term to generate inflation-adjusted superior returns.
So when one asks how to choose stock to invest in, the real question, is how to
identify a great business and what all parameters should be used to identify it?
24.
Remember
1. Always rememberyour financial goals and
investment timeframe.
2. Review your financial goals periodically, at-least
once in 5 years.
3. Risk and Return profile of various assets are not
constant.
4. Consider taking help from a registered and
qualified Investment Advisor.
5. No stock remain the best all the time. Market is
dynamic and you need to review your portfolio
periodically.
25.
“Investing money isthe process of
committing resources in a strategic way
to accomplish a specific objective.”
Alan Gotthardt