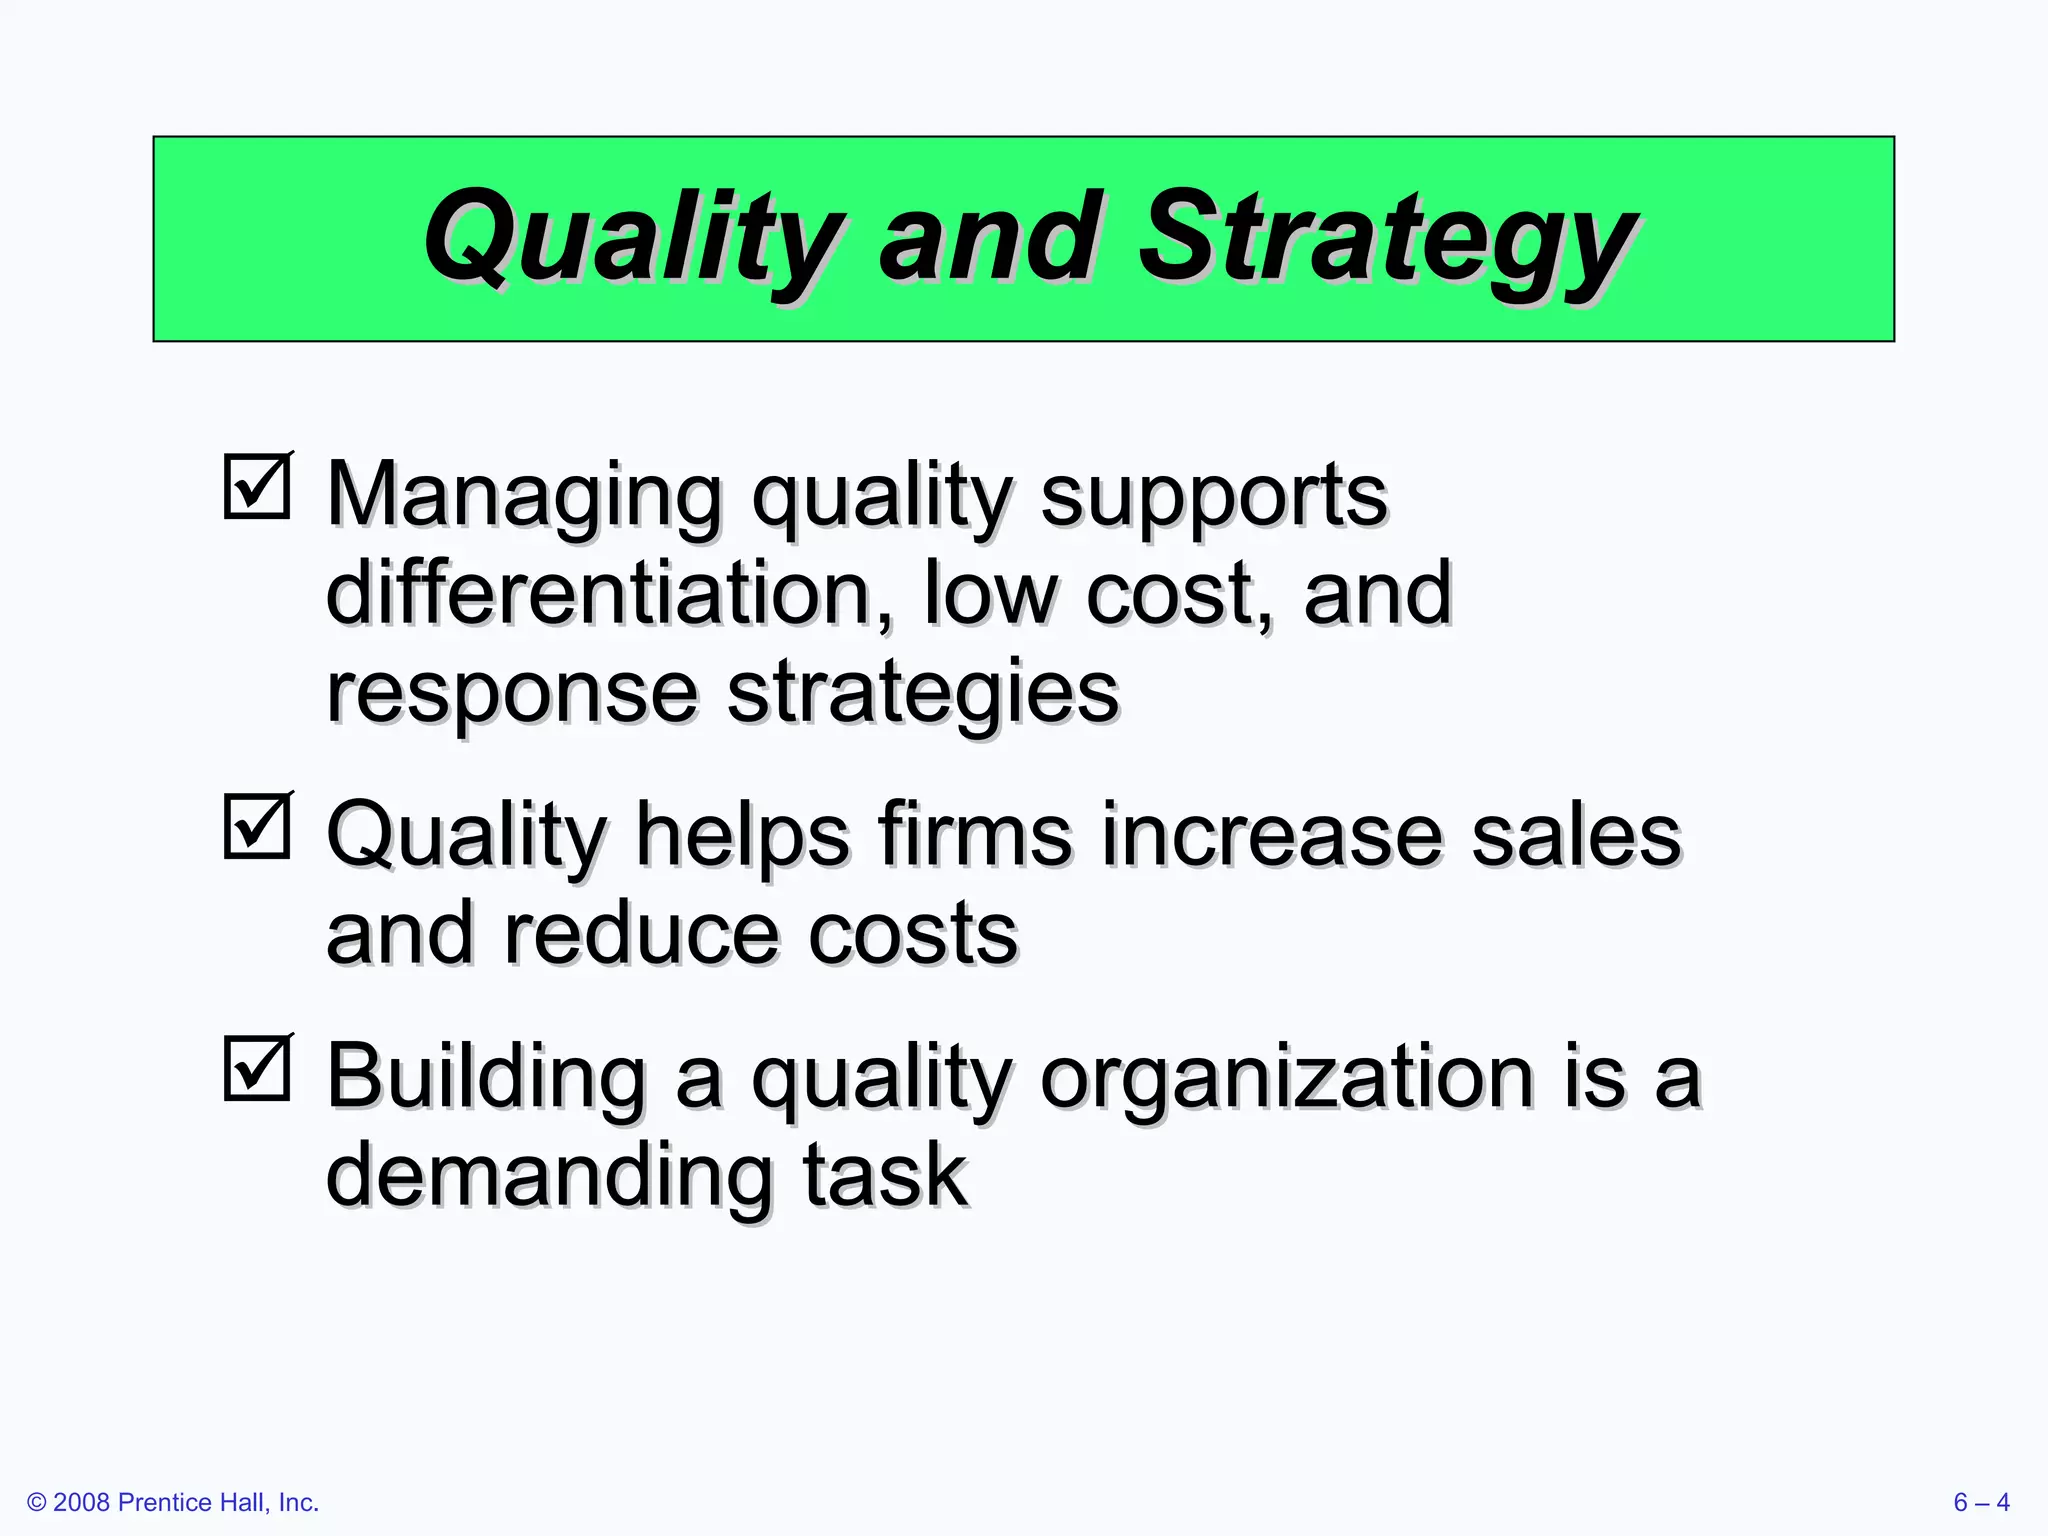
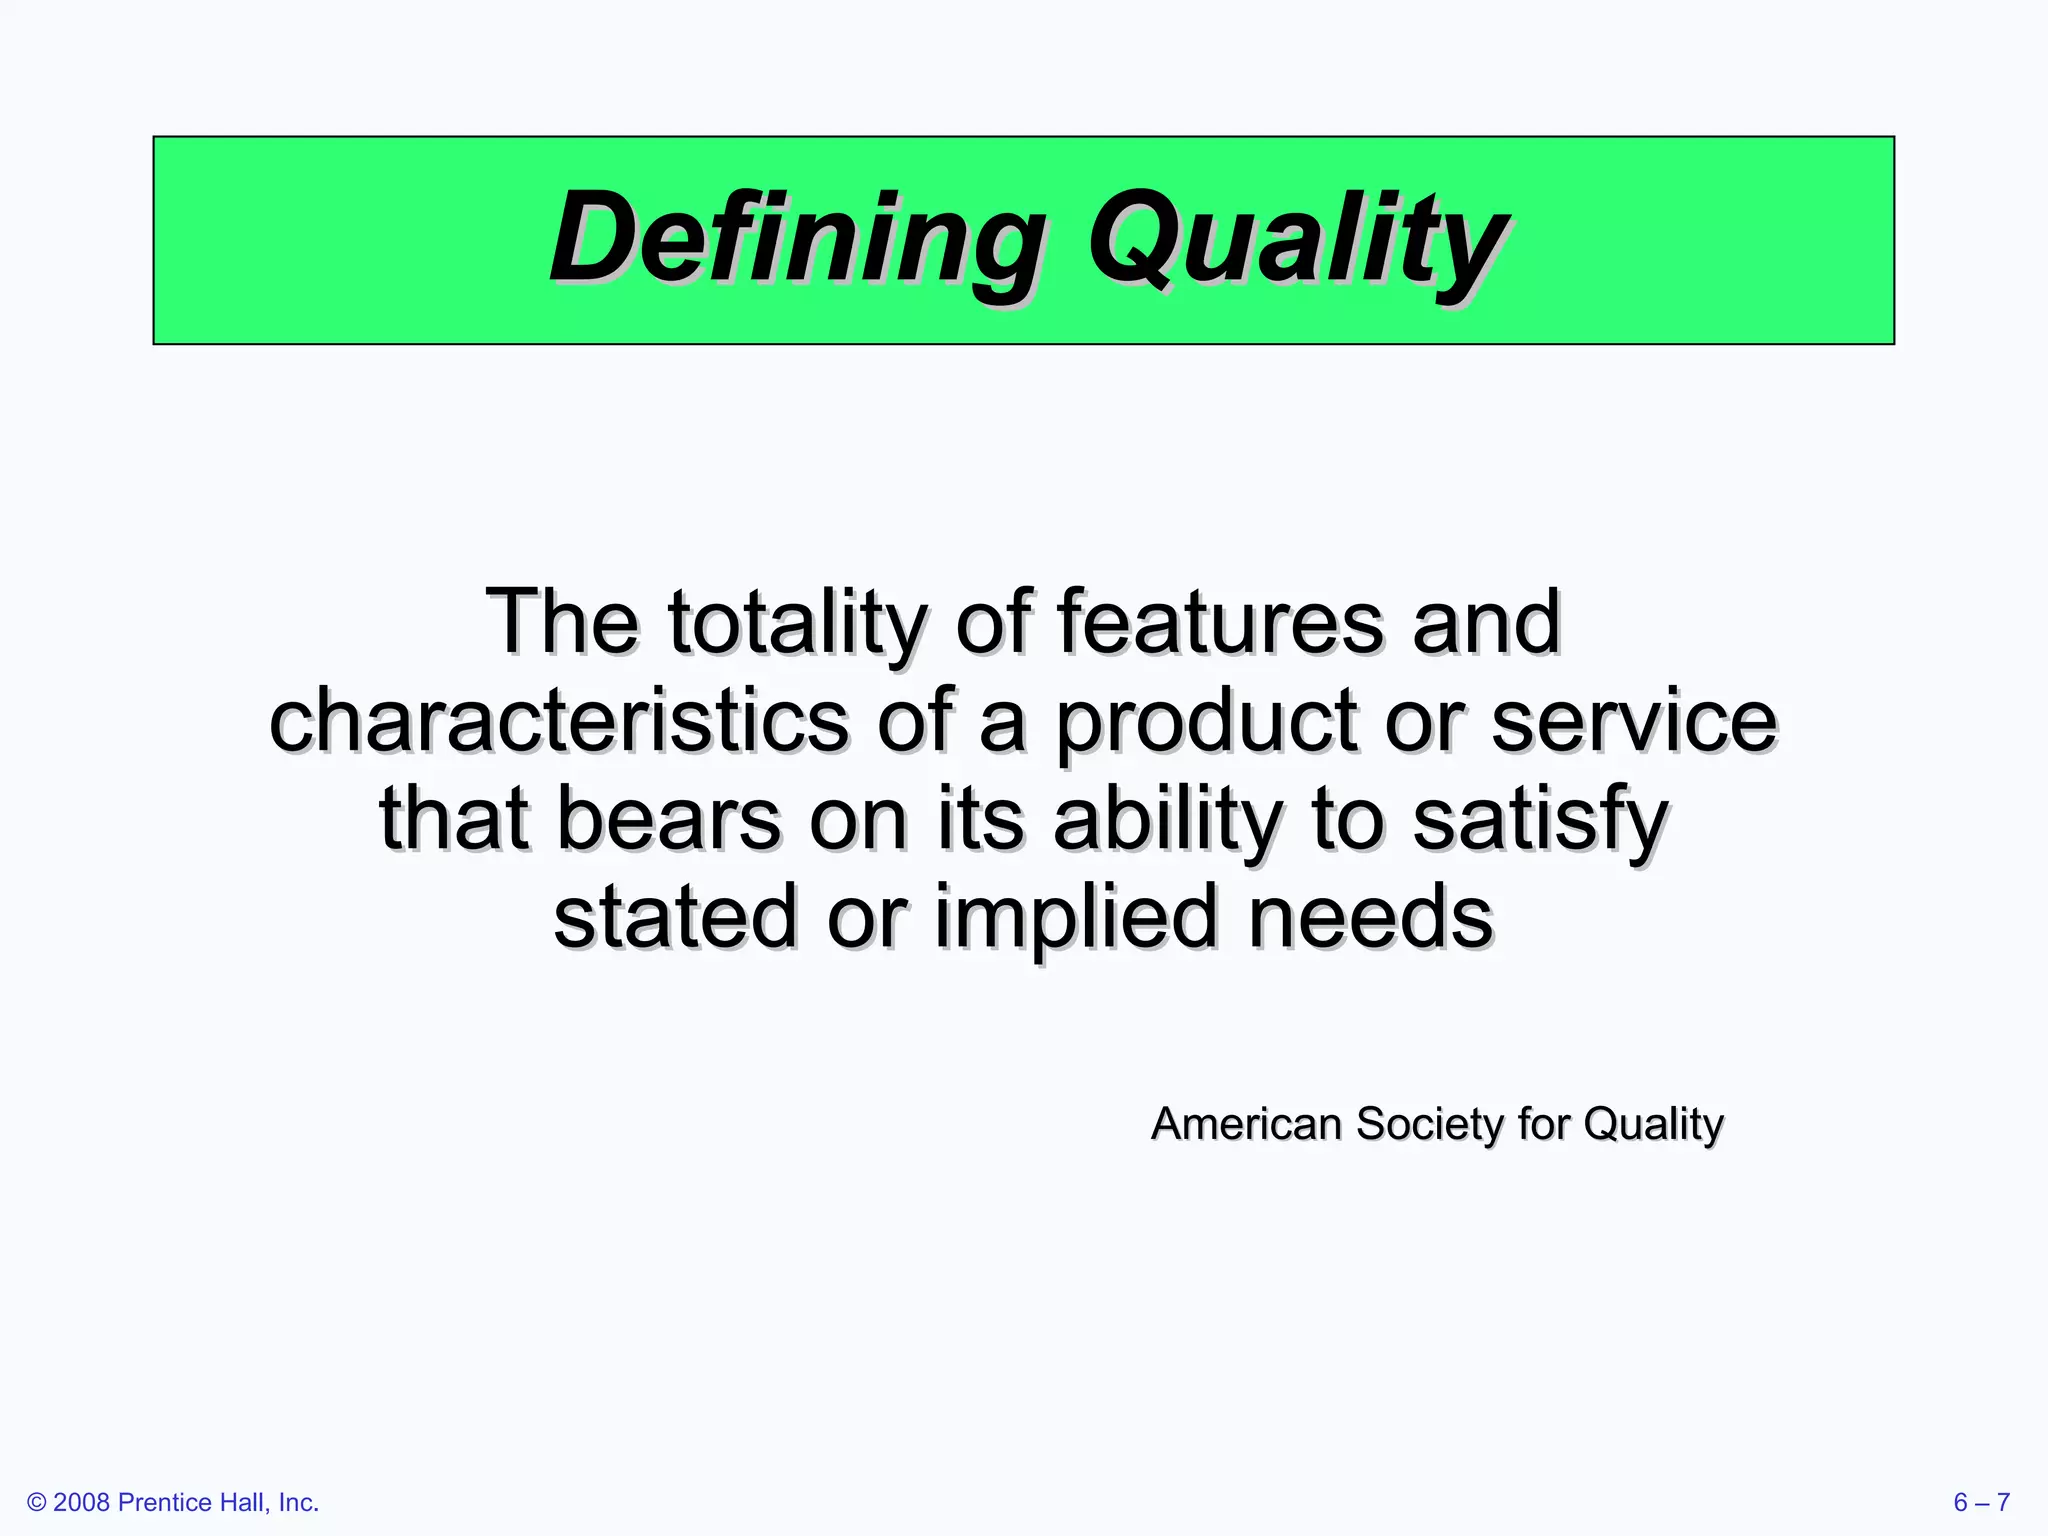
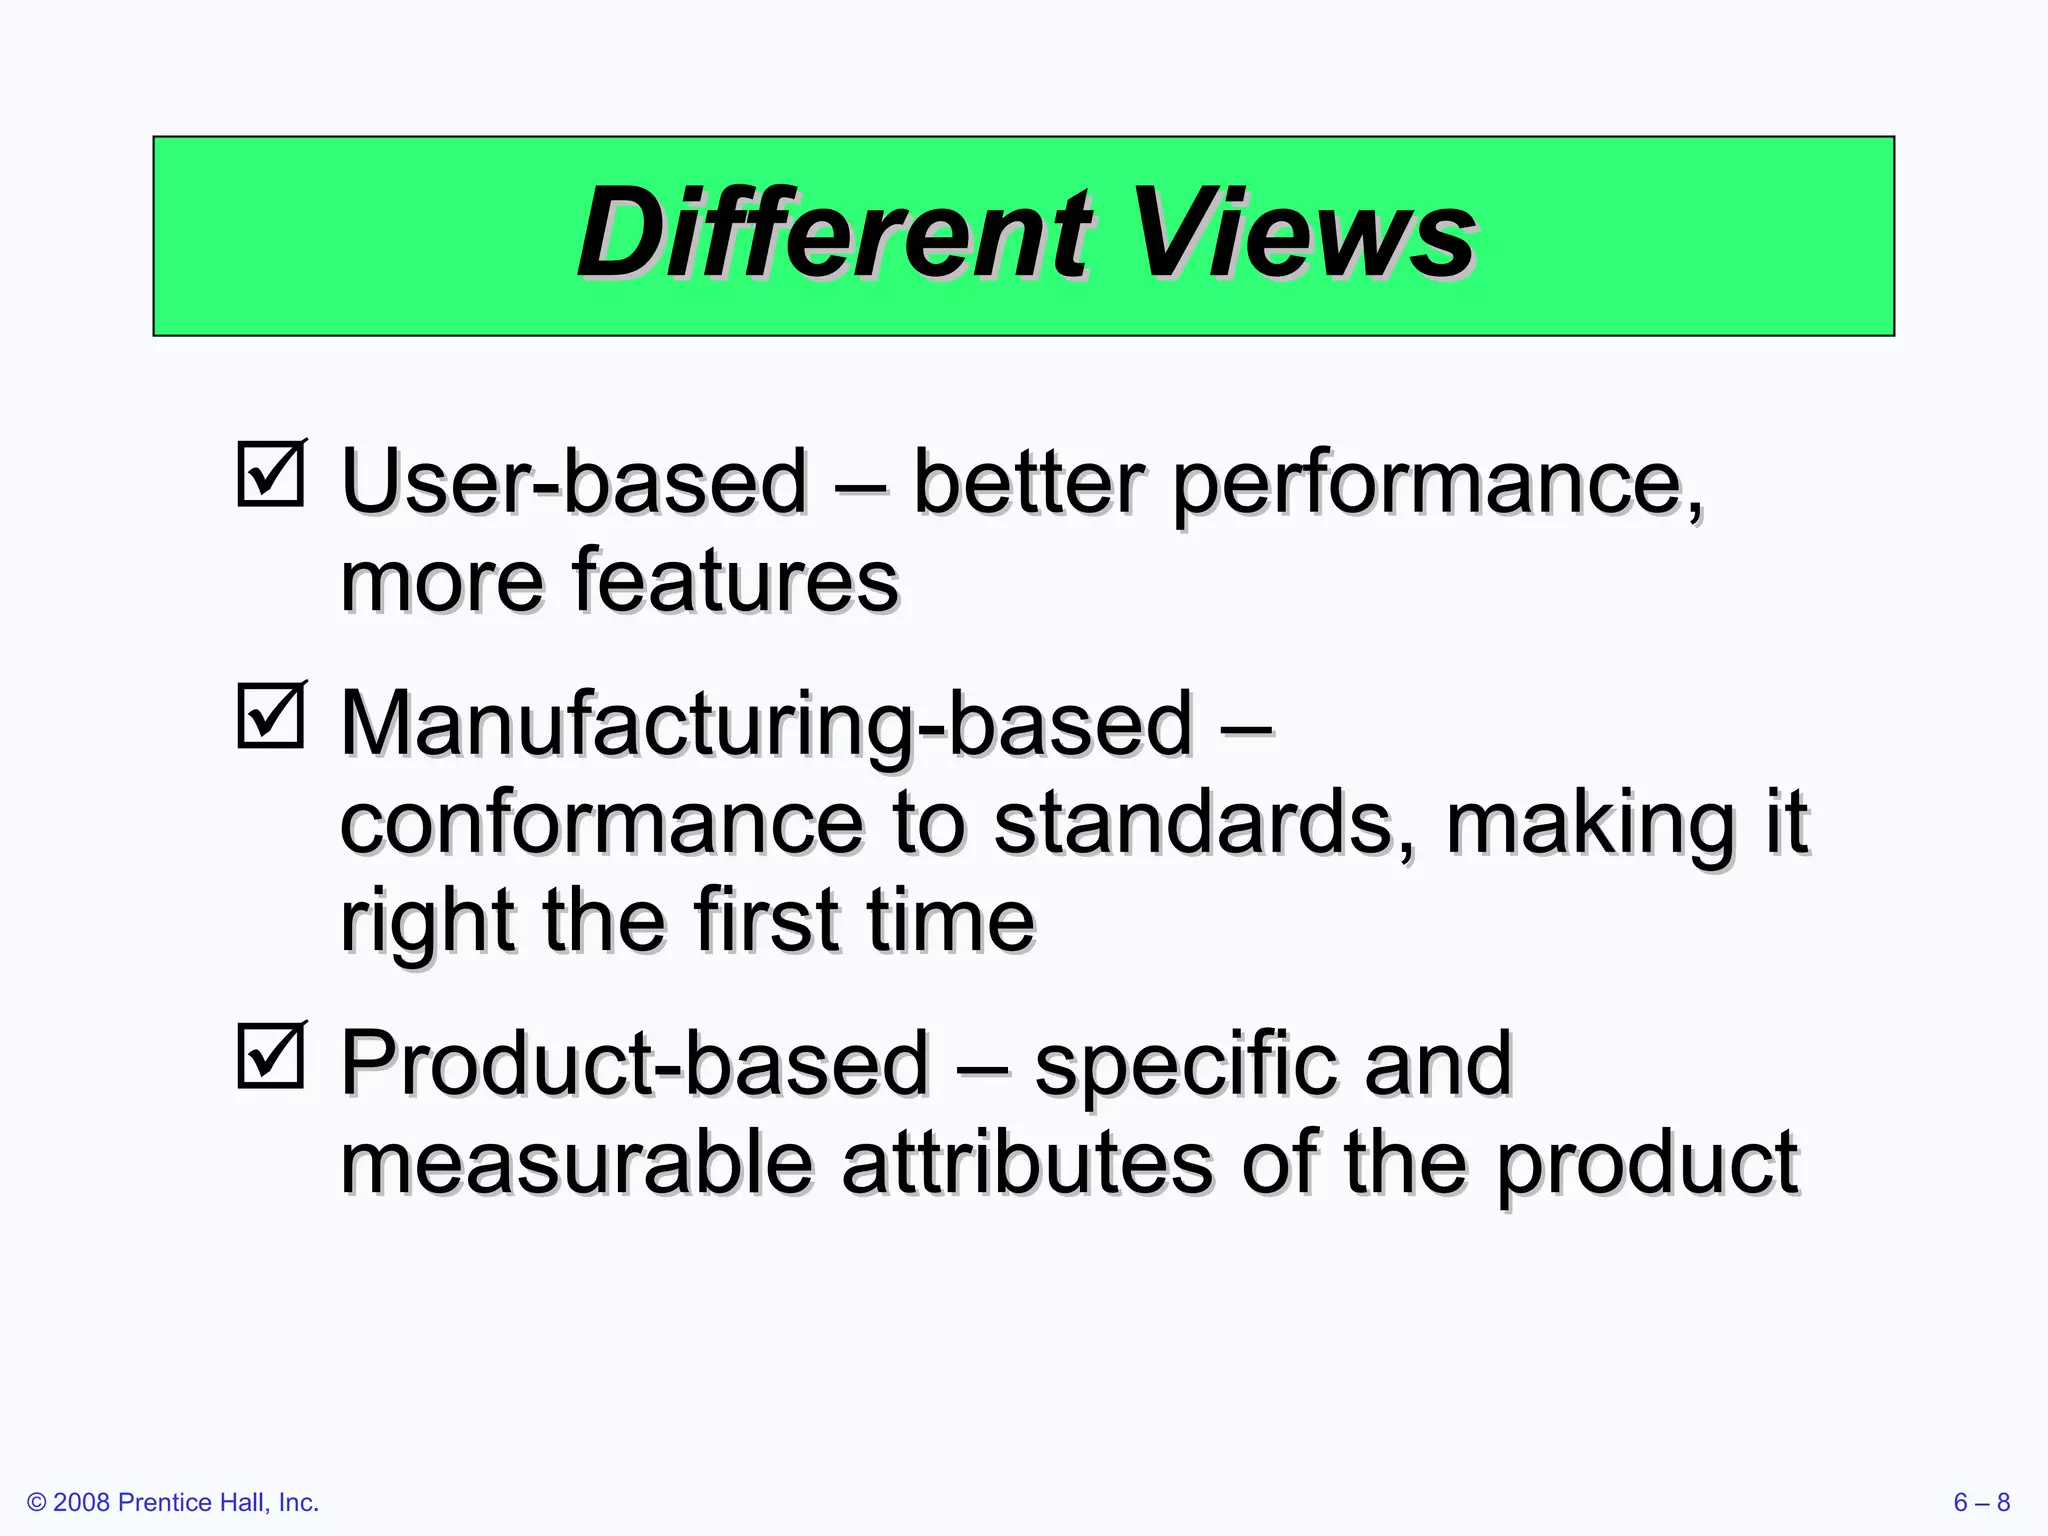
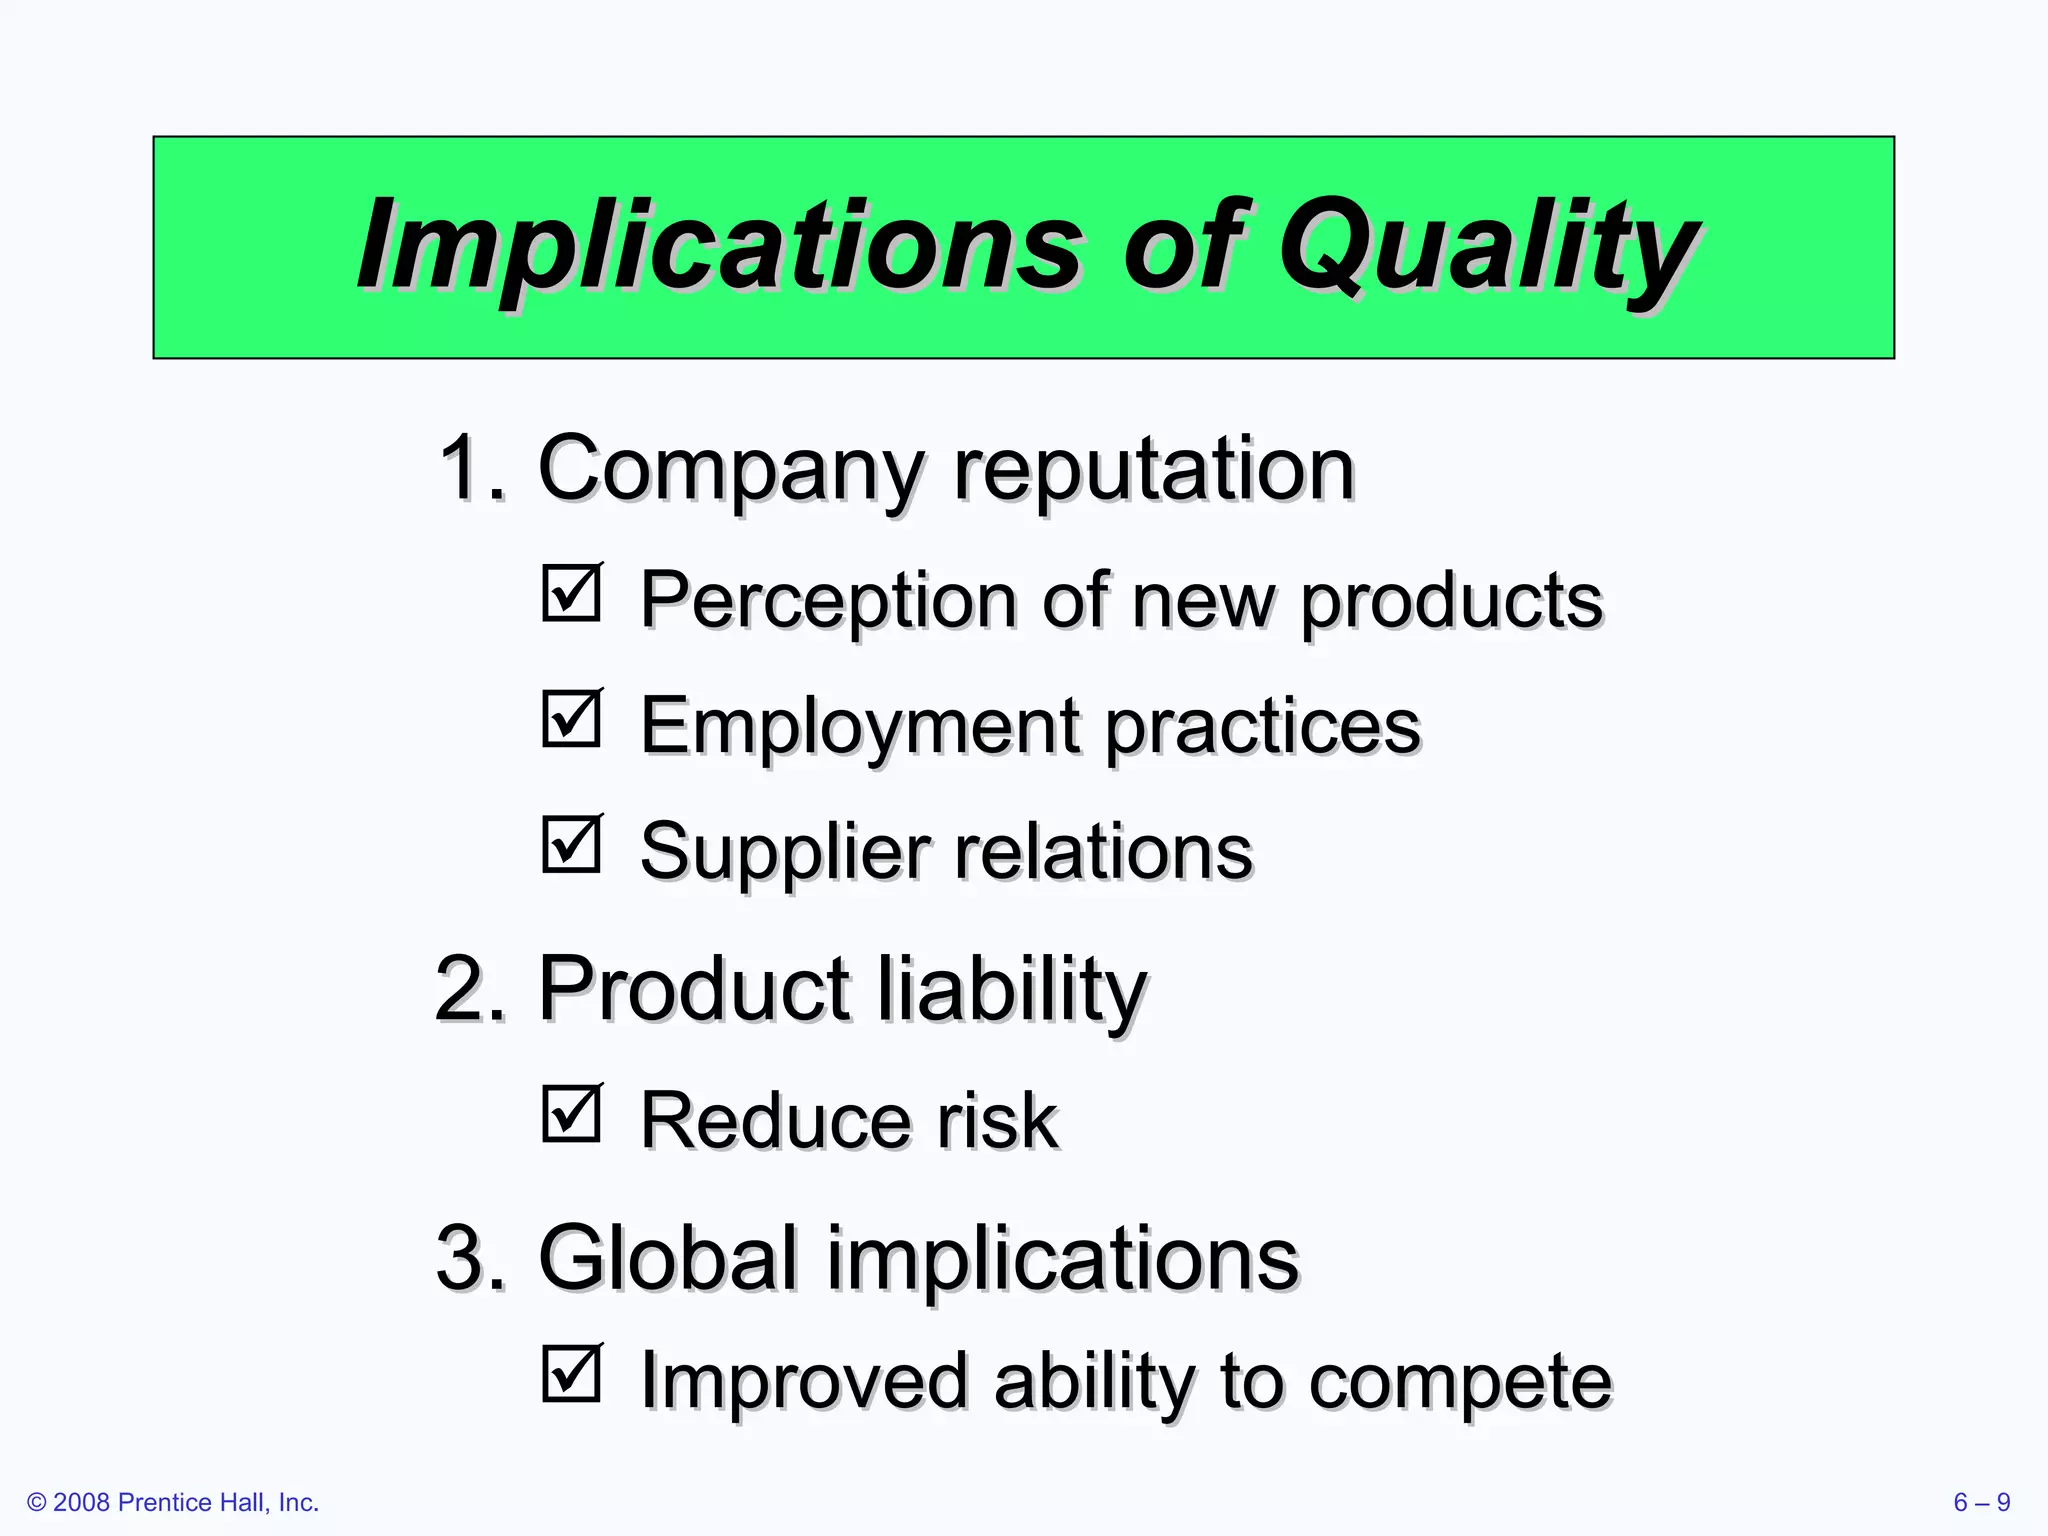
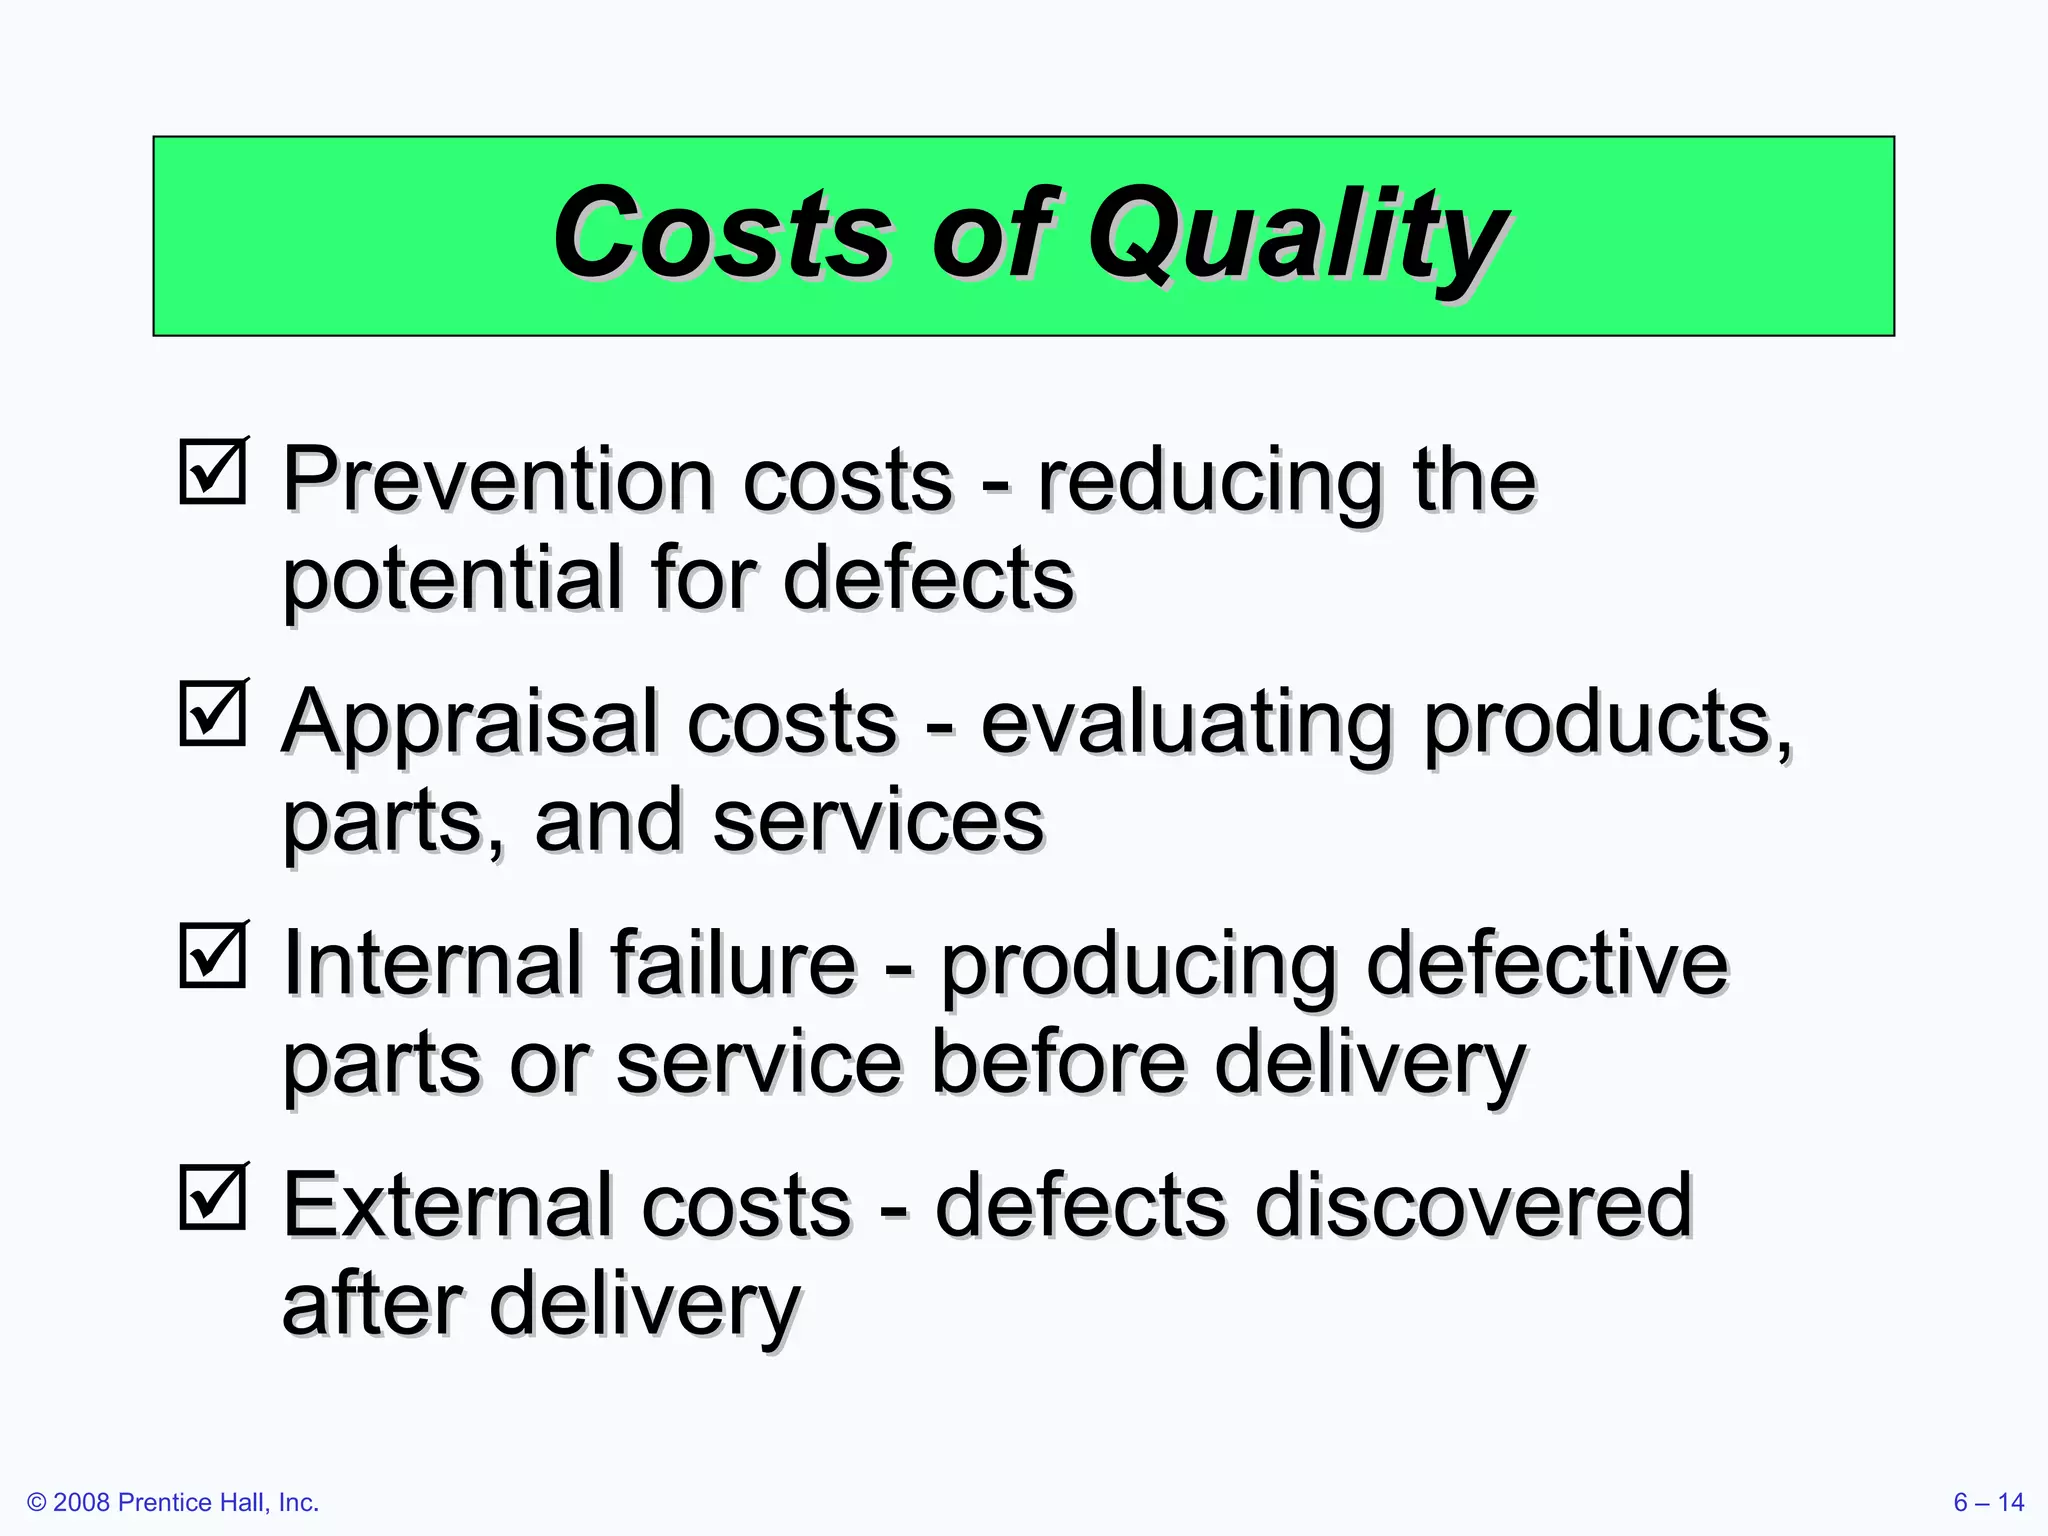
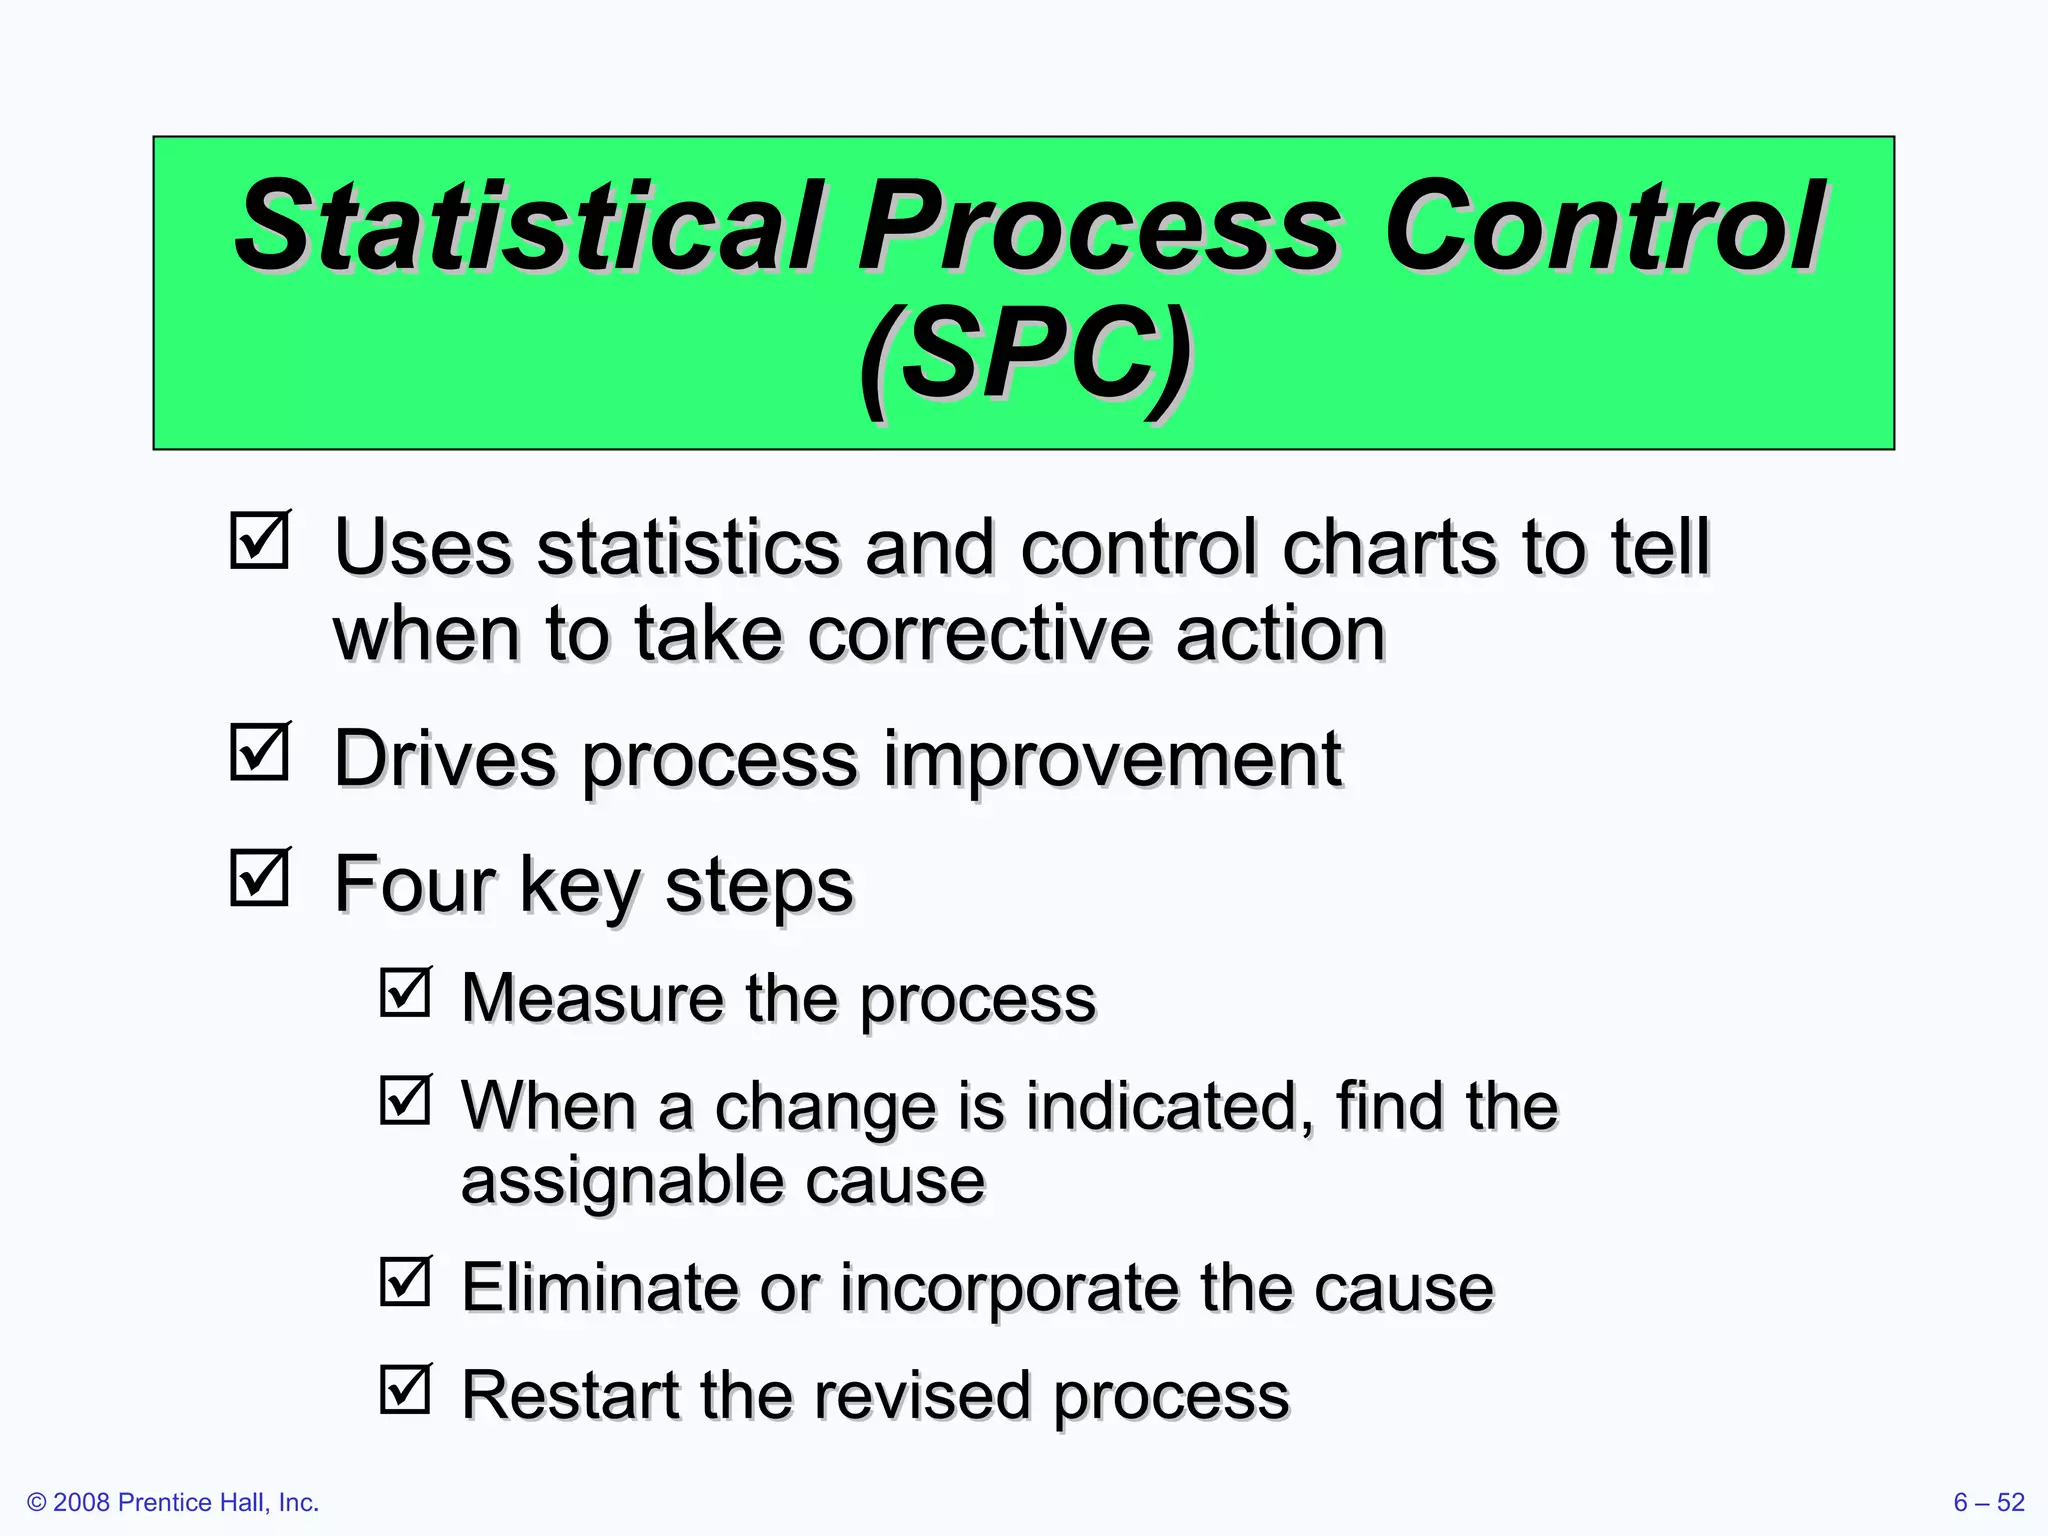
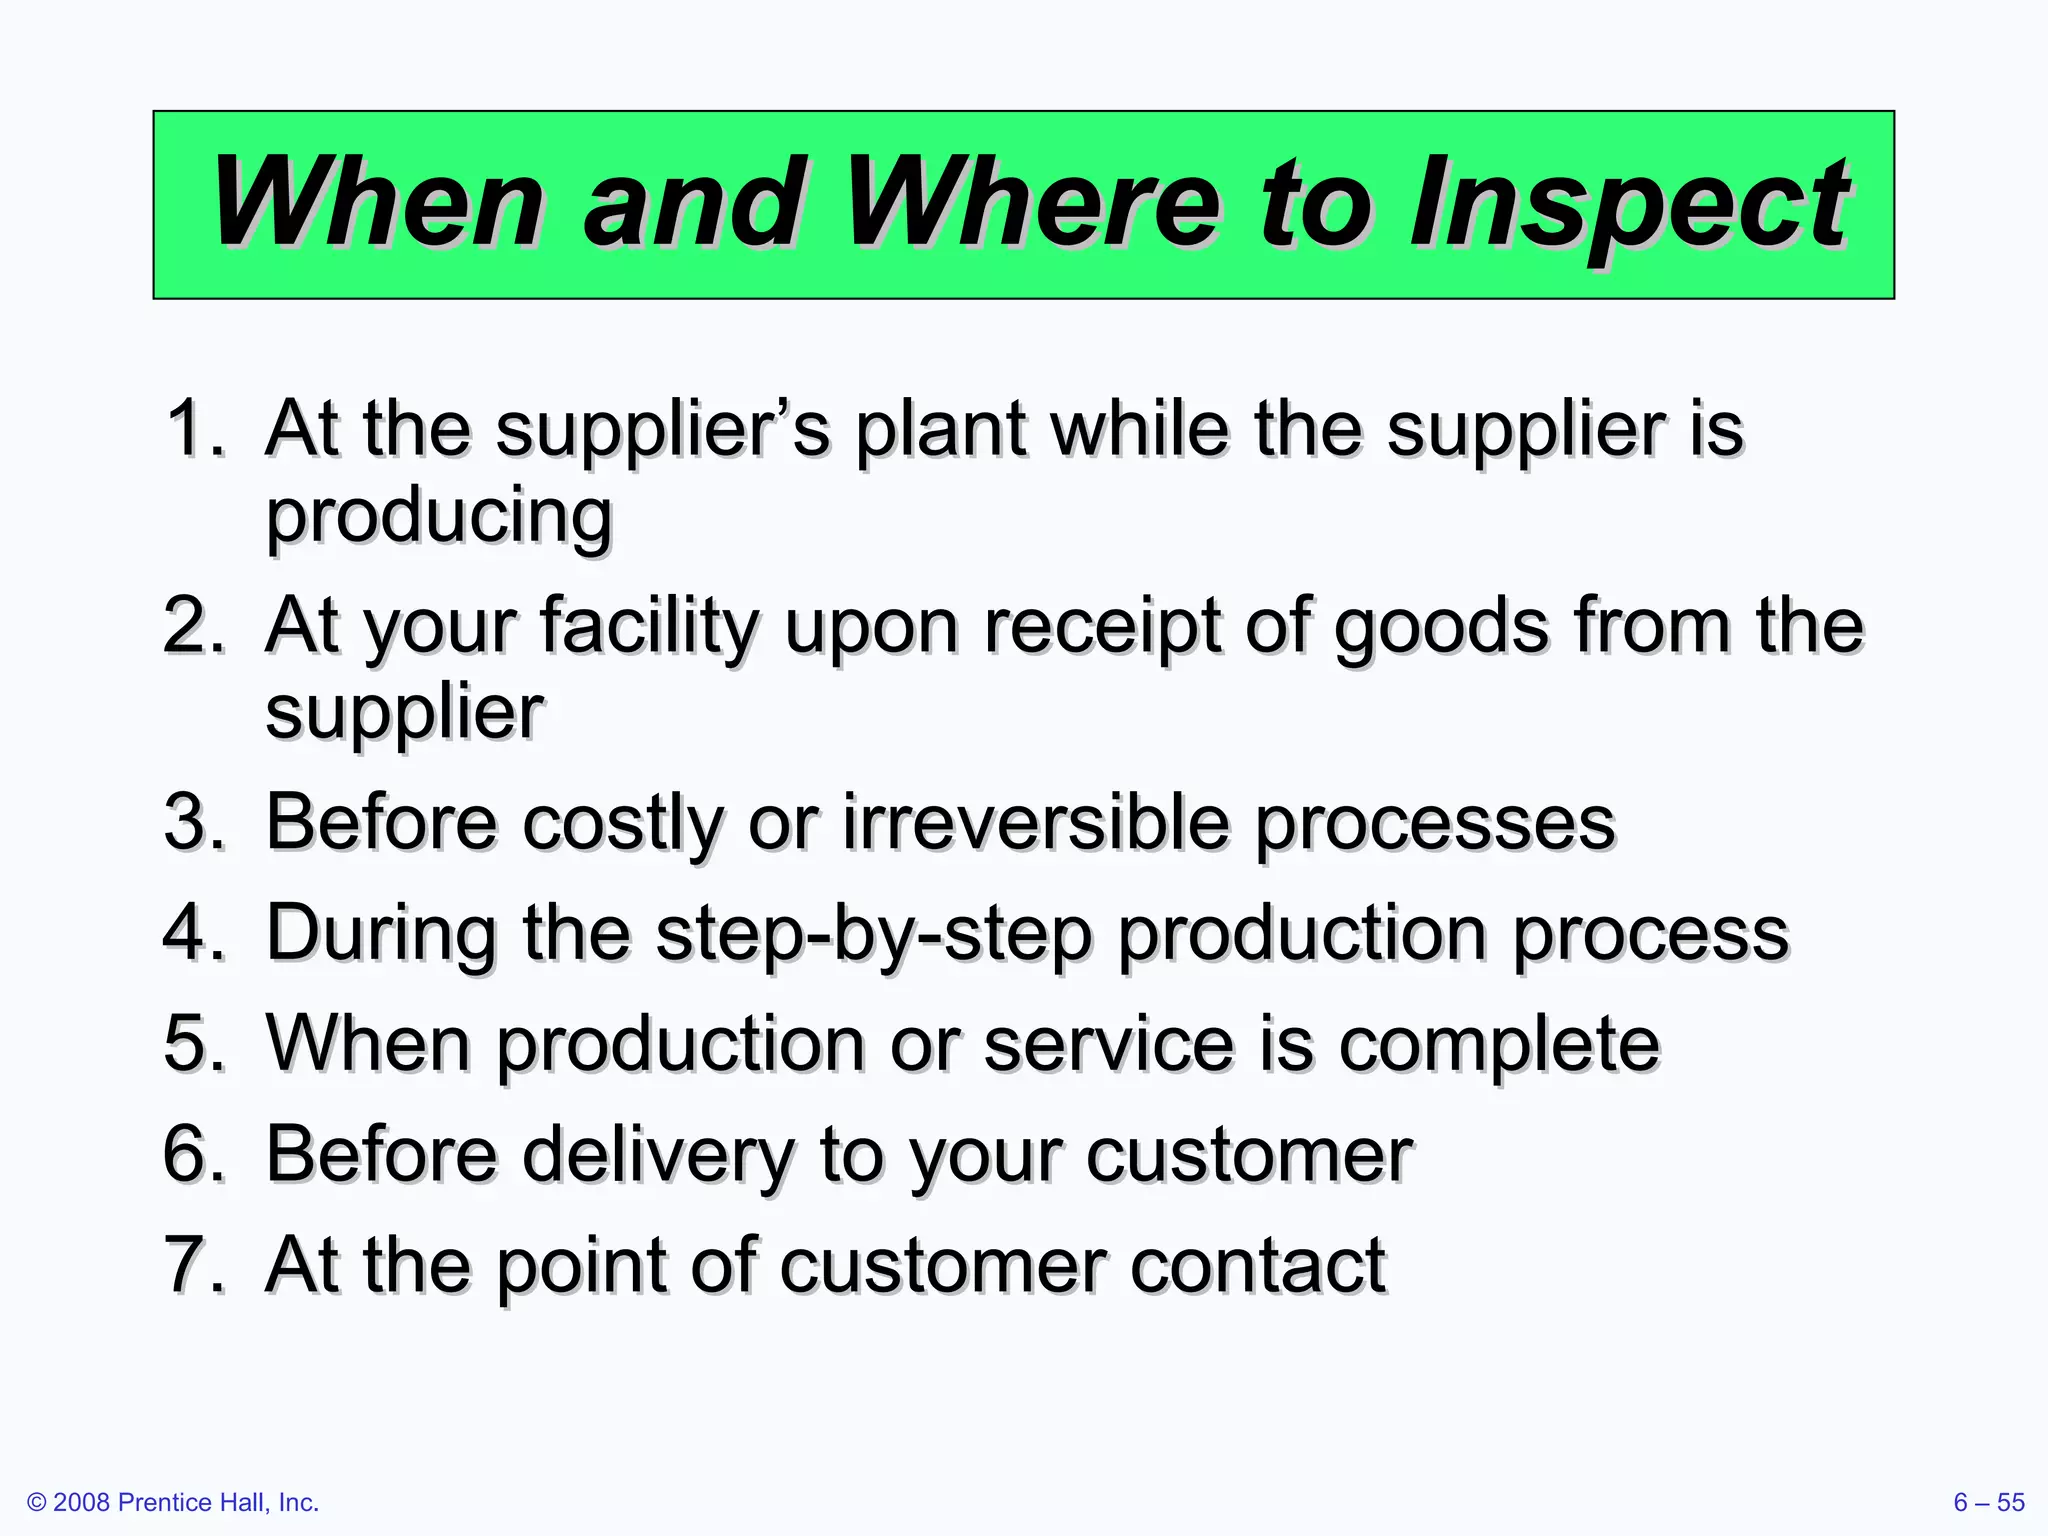
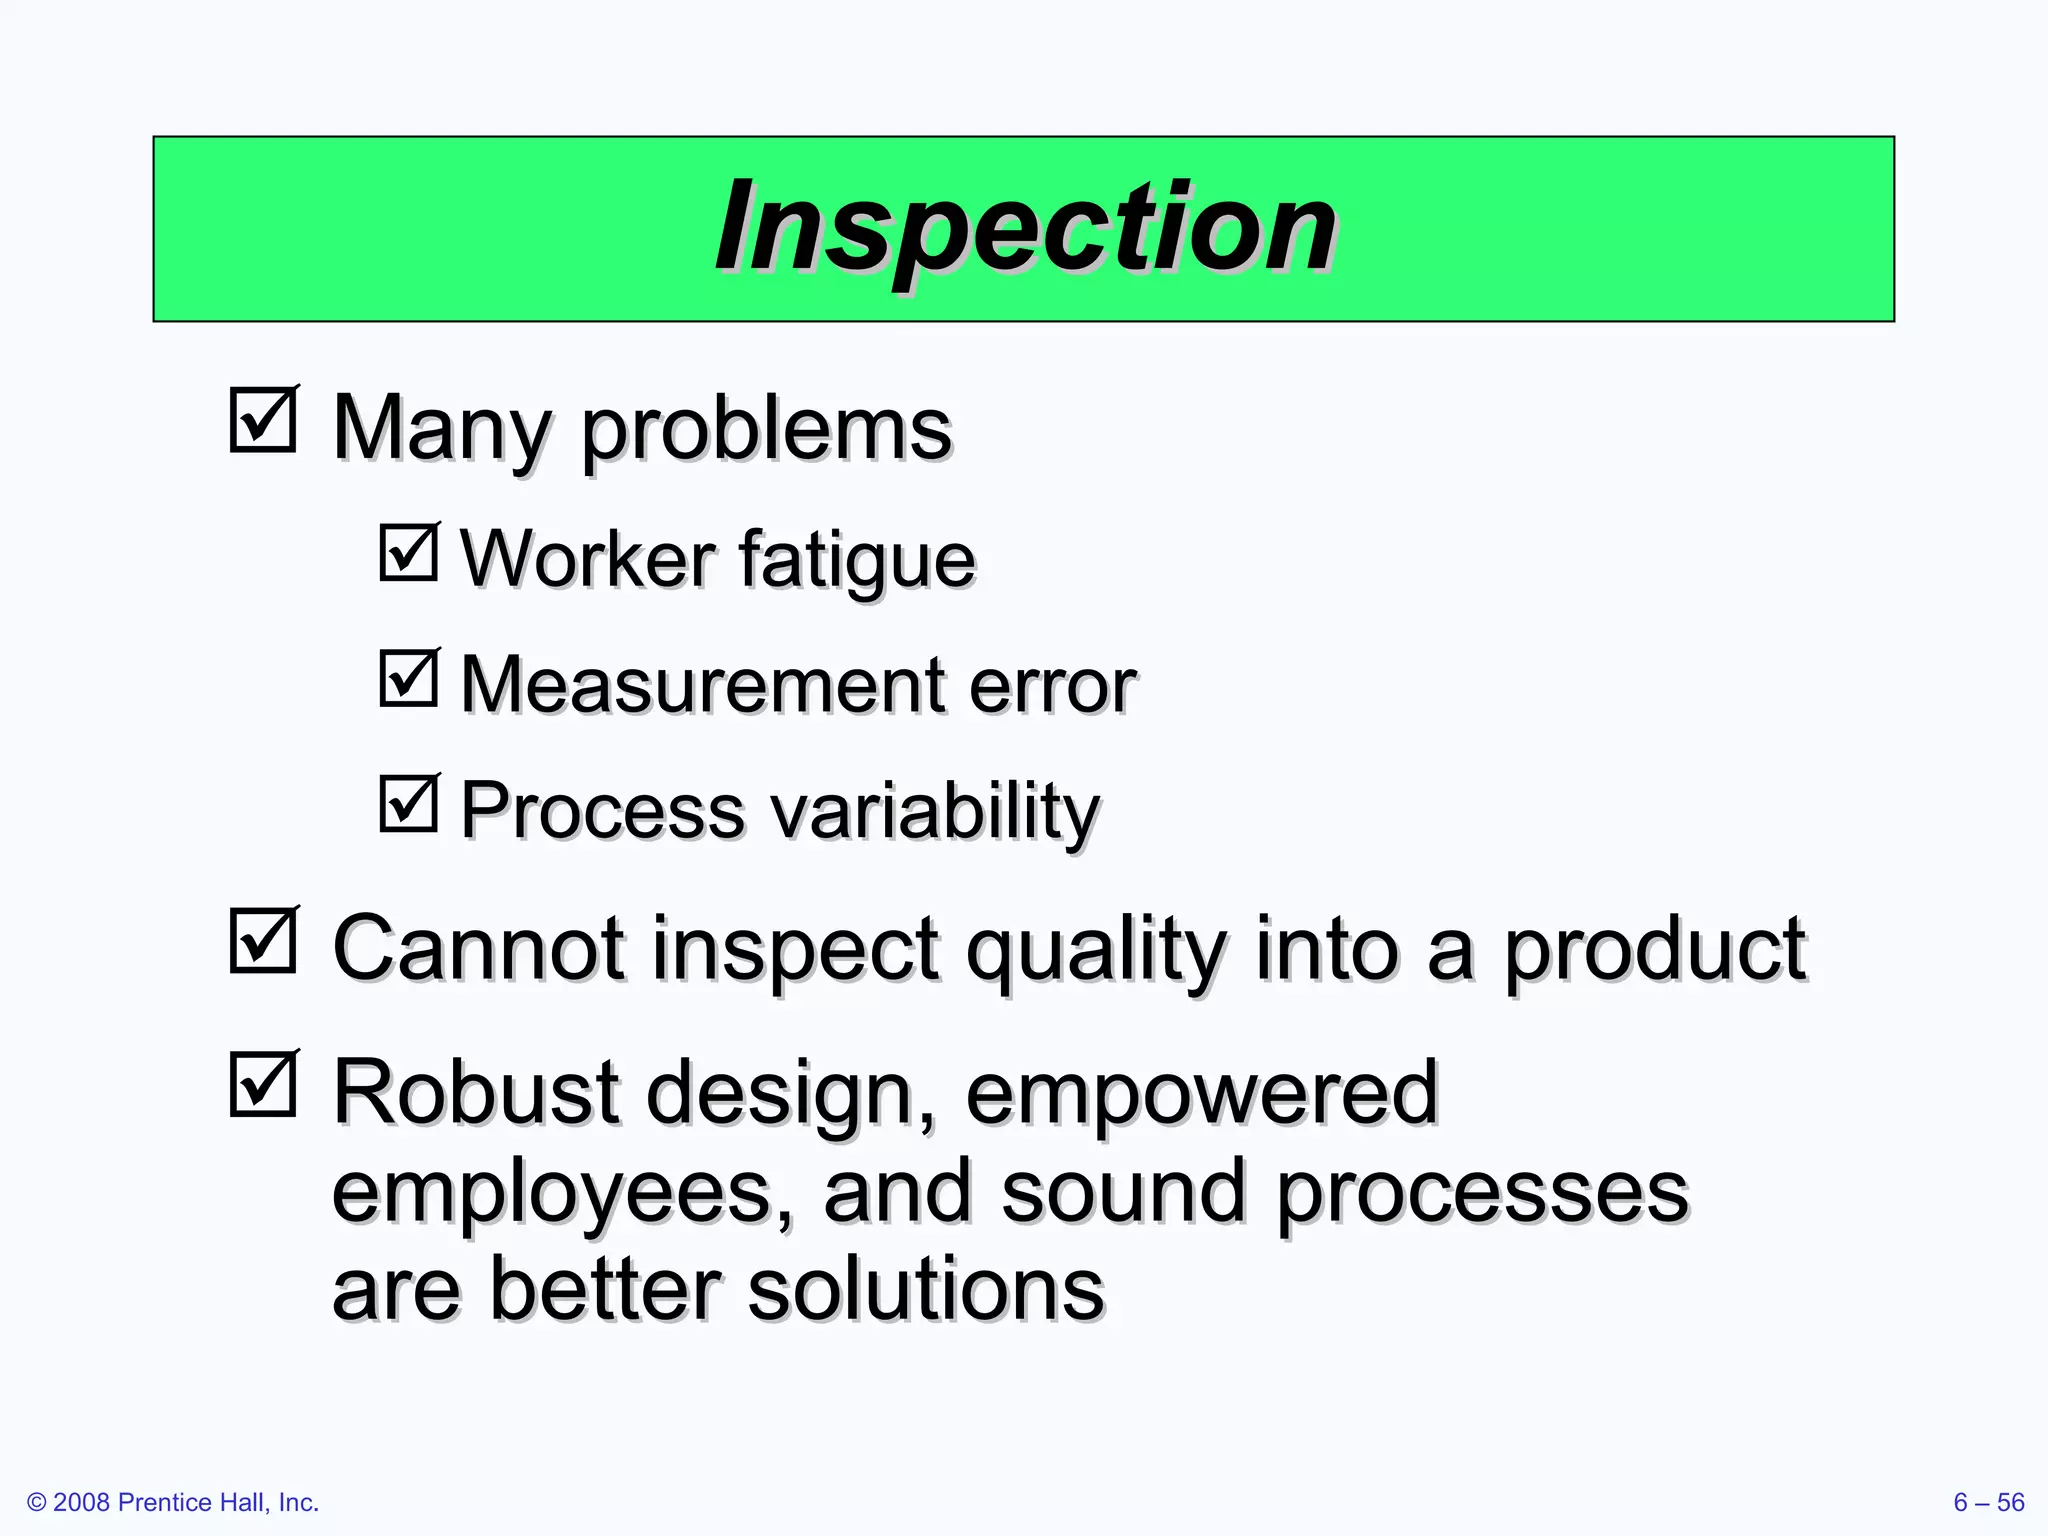
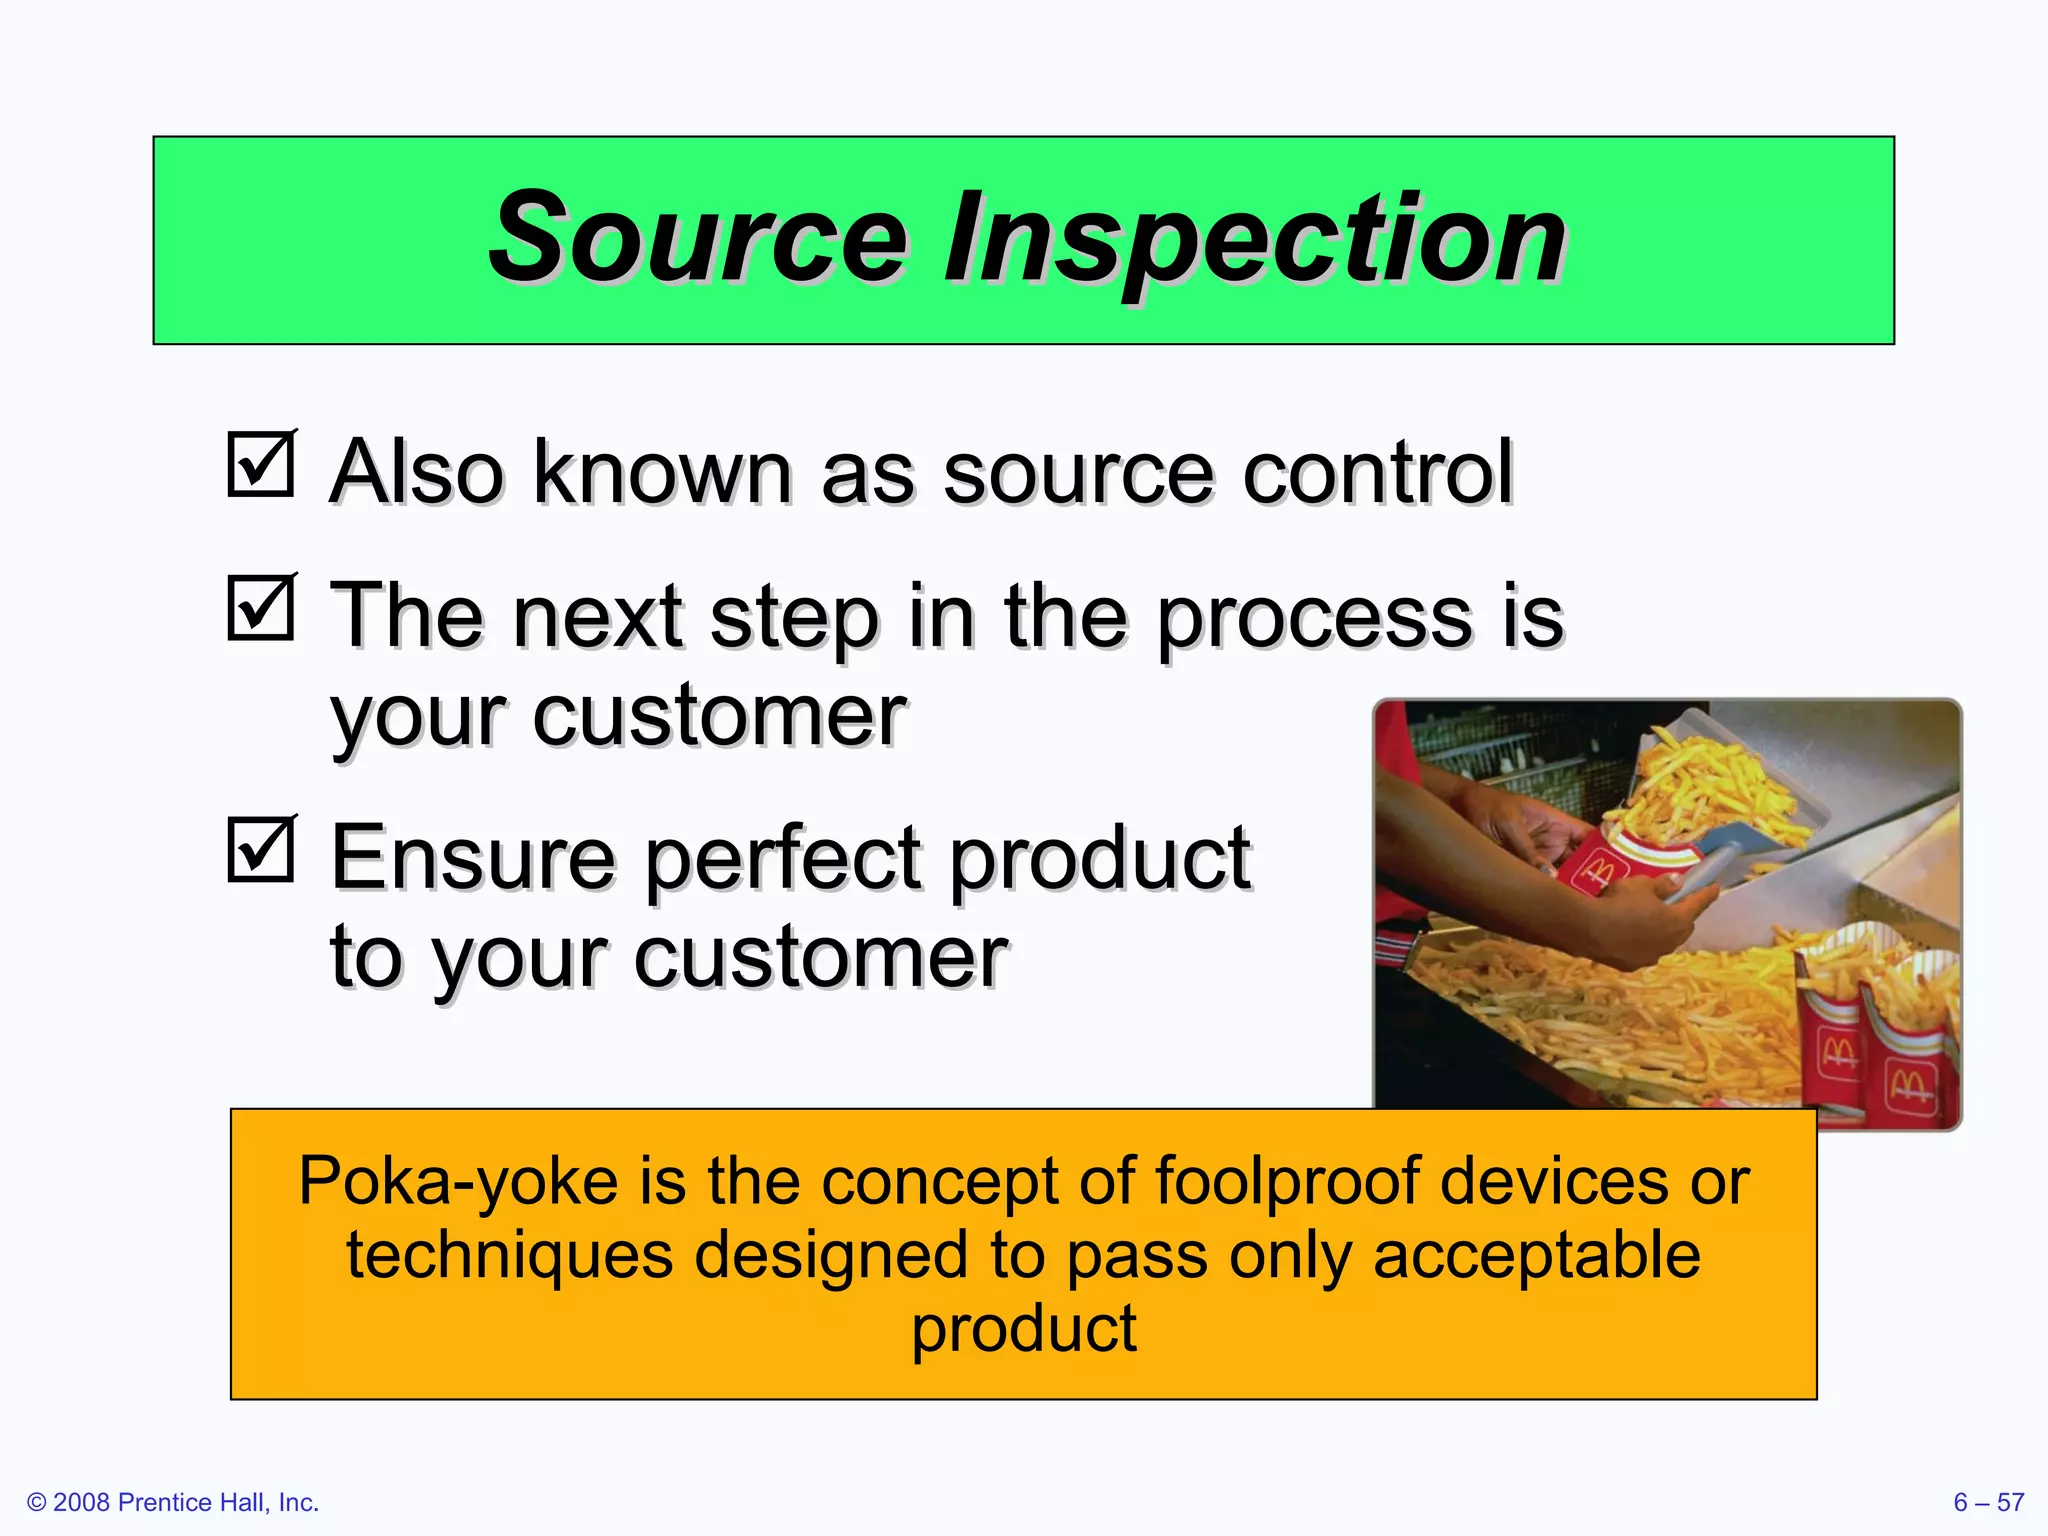
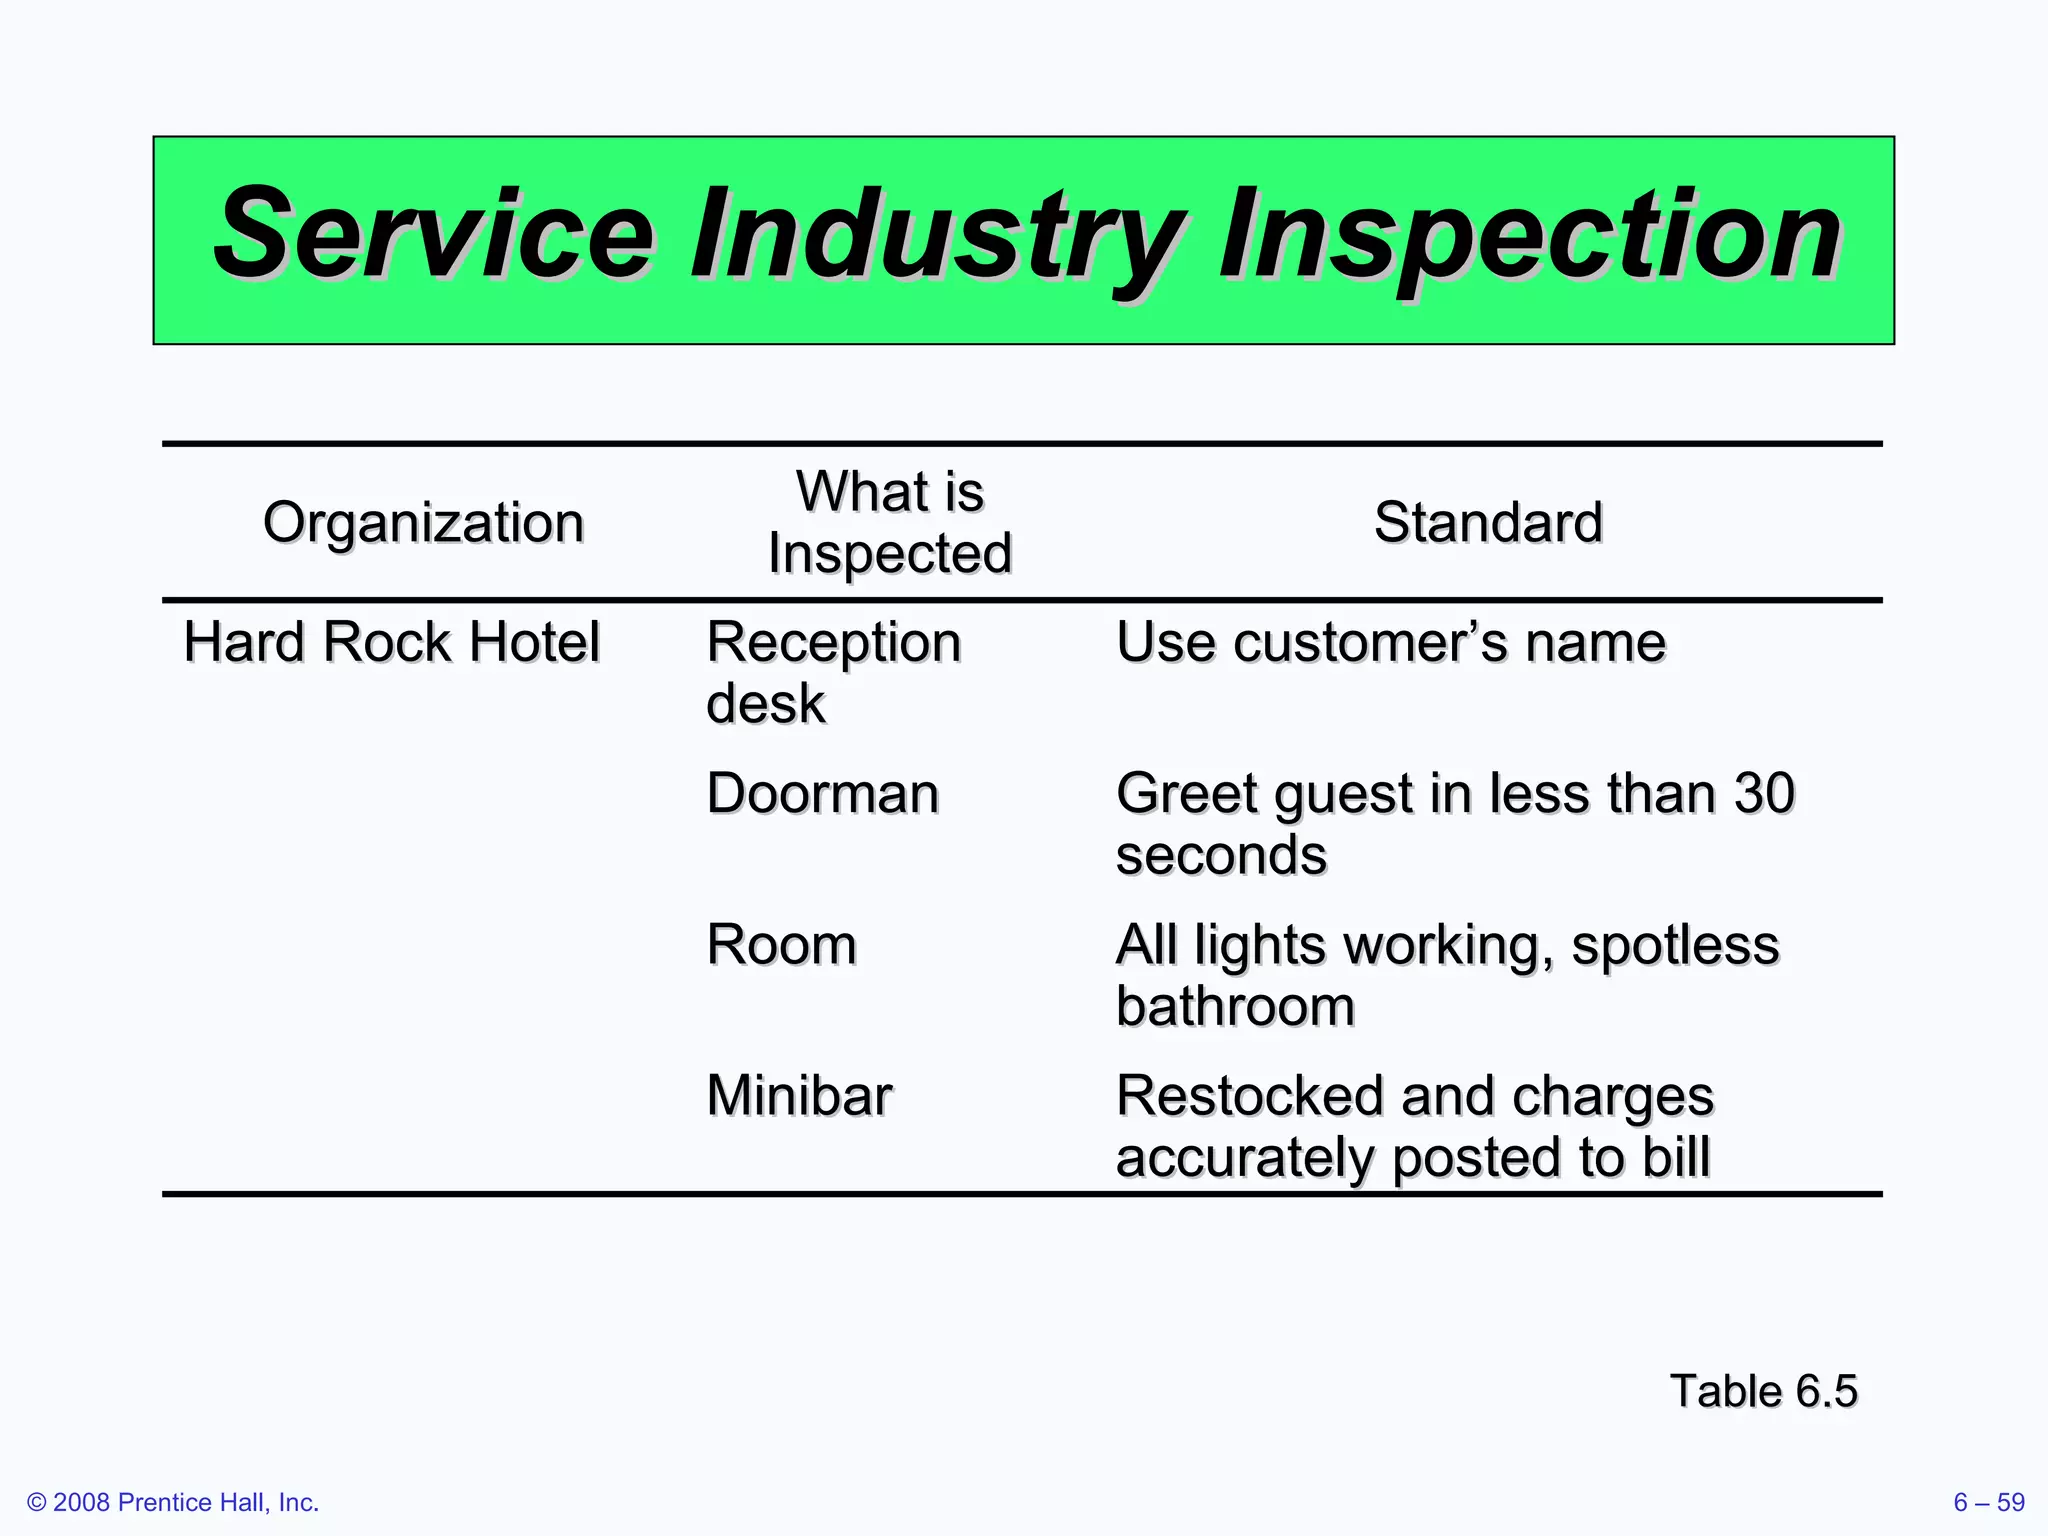
Operations Management Session 7–  Managing Quality
Learning Objectives When you complete this chapter you should be able to: Define quality and TQM Describe the ISO international quality standards Explain Six Sigma Explain how benchmarking is used  Explain quality robust products and Taguchi concepts Use the seven tools of TQM
Managing Quality Provides a Competitive Advantage Arnold Palmer Hospital Deliver over 13,000 babies annually Virtually every type of quality tool is employed Continuous improvement Employee empowerment Benchmarking Just-in-time Quality tools
Quality and Strategy Managing quality supports differentiation, low cost, and response strategies Quality helps firms increase sales and reduce costs Building a quality organization is a demanding task
Two Ways Quality  Improves Profitability Figure 6.1 Improved Quality Increased Profits Increased productivity Lower rework and scrap costs Lower warranty costs Reduced Costs via Improved response Flexible pricing Improved reputation Sales Gains via
The Flow of Activities Organizational Practices Leadership, Mission statement, Effective operating procedures, Staff support, Training Yields: What is important and what is to be accomplished Figure 6.2 Quality Principles Customer focus, Continuous improvement, Benchmarking, Just-in-time, Tools of TQM Yields: How to do what is important and to be accomplished Employee Fulfillment Empowerment, Organizational commitment Yields: Employee attitudes that can accomplish what is important Customer Satisfaction Winning orders, Repeat customers Yields: An effective organization with a competitive advantage
Defining Quality The totality of features and characteristics of a product or service that bears on its ability to satisfy stated or implied needs American Society for Quality
Different Views User-based – better performance, more features Manufacturing-based – conformance to standards, making it right the first time Product-based – specific and measurable attributes of the product
Implications of Quality Company reputation Perception of new products Employment practices Supplier relations Product liability Reduce risk Global implications Improved ability to compete
Key Dimensions of Quality Performance Features Reliability Conformance Durability Serviceability Aesthetics Perceived quality Value
Malcom Baldrige National Quality Award Established in 1988 by the U.S. government Designed to promote TQM practices Recent winners Premier Inc., MESA Products, Sunny Fresh Foods, Park Place Lexus, North Mississippi Medical Center, The Bama Companies, Richland College, Texas Nameplate Company, Inc.
Baldrige Criteria Applicants are evaluated on: Categories Points Leadership 120 Strategic Planning  85 Customer & Market Focus 85 Measurement, Analysis, and Knowledge Management  90 Workforce Focus 85 Process Management  85 Results 450
Takumi A Japanese character that symbolizes a broader dimension than quality, a deeper process than education, and a more perfect method than persistence
Costs of Quality Prevention costs - reducing the potential for defects Appraisal costs - evaluating products, parts, and services Internal failure - producing defective parts or service before delivery External costs - defects discovered  after delivery
Costs of Quality External Failure Internal Failure Prevention Appraisal Total Cost Quality Improvement Total Cost
Leaders in Quality W. Edwards Deming 14 Points for Management Joseph M. Juran Top management commitment, fitness for use Armand Feigenbaum Total Quality Control Philip B. Crosby Quality is Free, zero defects
Ethics and Quality Management Operations managers must deliver healthy, safe, quality products and services Poor quality risks injuries, lawsuits, recalls, and regulation Organizations are judged by how they respond to problems All stakeholders much be considered
International Quality Standards ISO 9000 series (Europe/EC) Common quality standards for products sold in Europe (even if made in U.S.) 2000 update places greater emphasis on leadership and customer satisfaction ISO 14000 series (Europe/EC)
ISO 14000 Environmental Standard Core Elements: Environmental management Auditing Performance evaluation Labeling Life cycle assessment
TQM Encompasses entire organization, from supplier to customer Stresses a commitment by management to have a continuing, companywide drive toward excellence in all aspects of products and services that are important to the customer
Deming’s Fourteen Points Create consistency of purpose Lead to promote change Build quality into the product; stop depending on inspection Build long-term relationships based on performance, not price Continuously improve product, quality, and service Start training Emphasize leadership Table 6.1
Deming’s Fourteen Points Drive out fear Break down barriers between departments Stop haranguing workers Support, help, improve Remove barriers to pride in work Institute a vigorous program of education and self-improvement Put everybody in the company to work on the transformation Table 6.1
Seven Concepts of TQM Continuous improvement Six Sigma Employee empowerment Benchmarking Just-in-time (JIT) Taguchi concepts Knowledge of TQM tools
Continuous Improvement Represents continual improvement of all processes  Involves all operations and work centers including suppliers and customers People, Equipment, Materials, Procedures
Shewhart’s PDCA Model Figure 6.3 2. Do Test the plan 3. Check Is the plan working? 4. Act Implement the plan Plan Identify the improvement and make  a plan
Six Sigma Two meanings Statistical definition of a process that is 99.9997% capable, 3.4 defects per million opportunities (DPMO) A program designed to reduce defects, lower costs, and improve customer satisfaction
Six Sigma Two meanings Statistical definition of a process that is 99.9997% capable, 3.4 defects per million opportunities (DPMO) A program designed to reduce defects, lower costs, and improve customer satisfaction Figure 6.4 Mean Lower limits Upper limits 3.4 defects/million ±6  2,700 defects/million ±3 
Six Sigma Program Originally developed by Motorola, adopted and enhanced by Honeywell and GE Highly structured approach to process improvement A strategy A discipline - DMAIC 6 
Six Sigma DMAIC Approach Define critical outputs  and identify gaps for improvement Measure the work and  collect process data Analyze the data Improve the process Control the new process to make sure new performance is maintained
Six Sigma Implementation Emphasize defects per million opportunities as a standard metric Provide extensive training Focus on corporate sponsor support (Champions) Create qualified process improvement experts (Black Belts, Green Belts, etc.) Set stretch objectives This cannot be accomplished without a major commitment from top level management
Employee Empowerment Getting employees involved in product and process improvements 85% of quality problems are due  to process and material   Techniques Build communication networks  that include employees Develop open, supportive supervisors Move responsibility to employees Build a high-morale organization Create formal team structures
Quality Circles Group of employees who meet regularly to solve problems Trained in planning, problem solving, and statistical methods Often led by a facilitator Very effective when done properly
Benchmarking Use internal benchmarking if you’re big enough Selecting best practices to use as a standard for performance Determine what to  benchmark Form a benchmark team Identify benchmarking partners Collect and analyze benchmarking information Take action to match or exceed the benchmark
Benchmarking Factors for  Web Sites Table 6.3 Use of meta tags Yes: 70%, No: 30% Meaningful homepage title Yes: 97%, No: 3% Unique domain name Yes: 91%, No: 9% Search engine registration Above 96% Average loading speed 28K: 19.31, 56K: 10.88, T1: 2.59 Average number of spelling errors 0.16 Visibility of contact information Yes: 74%, No: 26% Presence of search engine Yes: 59%, No: 41% Translation to multiple languages Yes: 11%, No: 89%
Best Practices for Resolving Customer Complaints Make it easy for clients to complain Respond quickly to complaints Resolve complaints on first contact Use computers to manage complaints Recruit the best for customer service jobs
Just-in-Time (JIT) Relationship to quality: JIT cuts the cost of quality JIT improves quality Better quality means less inventory and better, easier-to-employ JIT system
Taguchi Concepts Engineering and experimental design methods to improve product and process design Identify key component and process variables affecting product variation Taguchi Concepts Quality robustness Quality loss function Target-oriented quality
Quality Robustness Ability to produce products uniformly in adverse manufacturing and environmental conditions Remove the effects of adverse conditions Small variations in materials and process do not destroy product quality
Quality Loss Function Shows that costs increase as the product moves away from what the customer wants Costs include customer dissatisfaction, warranty  and service, internal  scrap and repair, and costs to society Traditional conformance specifications are too simplistic Target-oriented quality
Quality Loss Function Figure 6.5 Unacceptable Poor Good Best Fair High loss Loss (to producing organization, customer, and society) Low loss Frequency Lower Target Upper Specification Target-oriented quality yields more product in the “best” category Target-oriented quality brings product toward the target value Conformance-oriented quality keeps products within 3 standard deviations L = D 2 C where L = loss to society D = distance from target value C = cost of deviation
Tools of TQM Tools for Generating Ideas Check sheets Scatter diagrams Cause-and-effect diagrams Tools to Organize the Data Pareto charts Flowcharts Tools for Identifying Problems Histogram Statistical process control chart
Seven Tools of TQM / / / / /// / // /// // //// /// // / Hour Defect 1 2 3 4 5 6 7 8 A B C / / // / (a) Check Sheet: An organized method of recording data Figure 6.6
Seven Tools of TQM (b) Scatter Diagram: A graph of the value of one variable vs. another variable Figure 6.6 Absenteeism Productivity
Seven Tools of TQM (c) Cause-and-Effect Diagram: A tool that identifies process elements (causes) that might effect an outcome Figure 6.6 Cause Materials Methods Manpower Machinery Effect
Seven Tools of TQM (d) Pareto Chart: A graph to identify and plot problems or defects in descending order of frequency Figure 6.6 Frequency Percent A B C D E
Seven Tools of TQM (e) Flowchart (Process Diagram): A chart that describes the steps in a process Figure 6.6
Seven Tools of TQM (f) Histogram: A distribution showing the frequency of occurrences of a variable Figure 6.6 Distribution Repair time (minutes) Frequency
Seven Tools of TQM (g) Statistical Process Control Chart: A chart with time on the horizontal axis to plot values of a statistic Figure 6.6 Upper control limit Target value Lower control limit Time
Cause-and-Effect Diagrams Figure 6.7 Material (ball) Method (shooting process) Machine (hoop & backboard) Manpower (shooter) Missed  free-throws Rim alignment Rim size Backboard stability Rim height Follow-through Hand position Aiming point Bend knees Balance Size of ball Lopsidedness Grain/Feel (grip) Air pressure Training Conditioning Motivation Concentration Consistency
Pareto Charts Number of occurrences Room svc Check-in Pool hours Minibar Misc. 72% 16% 5% 4% 3% 12 4 3 2 54 –   100 –   93 –   88 –   72 70  – 60  – 50  – 40  – 30  – 20  – 10  – 0  – Frequency (number) Causes and percent of the total Cumulative percent Data for October
Flow Charts MRI Flowchart Physician schedules MRI Patient taken to MRI Patient signs in Patient is prepped Technician carries out MRI Technician inspects film If unsatisfactory, repeat Patient taken back to room MRI read by radiologist MRI report transferred to physician Patient and physician discuss 11 10 20% 9 8 80% 1 2 3 4 5 6 7
Statistical Process Control (SPC) Uses statistics and control charts to tell when to take corrective action Drives process improvement Four key steps Measure the process When a change is indicated, find the assignable cause Eliminate or incorporate the cause Restart the revised process
An SPC Chart Figure 6.8 Upper control limit Coach’s target value Lower control limit Game number | | | | | | | | | 1 2 3 4 5 6 7 8 9 20% 10% 0% Plots the percent of free throws missed
Inspection Involves examining items to see if an item is good or defective Detect a defective product Does not correct deficiencies in process or product It is expensive Issues When to inspect Where in process to inspect
When and Where to Inspect At the supplier’s plant while the supplier is producing At your facility upon receipt of goods from the supplier Before costly or irreversible processes During the step-by-step production process When production or service is complete Before delivery to your customer At the point of customer contact
Inspection Many problems Worker fatigue Measurement error Process variability Cannot inspect quality into a product Robust design, empowered employees, and sound processes are better solutions
Source Inspection Also known as source control The next step in the process is your customer Ensure perfect product  to your customer Poka-yoke is the concept of foolproof devices or techniques designed to pass only acceptable product
Service Industry Inspection Table 6.5 Organization What is Inspected Standard Jones Law Office Receptionist performance Billing Attorney Is phone answered by the second ring Accurate, timely, and correct format Promptness in returning calls
Service Industry Inspection Table 6.5 Organization What is Inspected Standard Hard Rock Hotel Reception desk Doorman Room Minibar Use customer’s name Greet guest in less than 30 seconds All lights working, spotless bathroom Restocked and charges accurately posted to bill
Service Industry Inspection Table 6.5 Organization What is Inspected Standard Arnold Palmer Hospital Billing Pharmacy Lab Nurses Admissions Accurate, timely, and correct format Prescription accuracy, inventory accuracy Audit for lab-test accuracy Charts immediately updated Data entered correctly and completely
Service Industry Inspection Table 6.5 Organization What is Inspected Standard Olive Garden Restaurant Busboy Busboy Waiter Serves water and bread within 1 minute Clears all entrée items and crumbs prior to dessert Knows and suggest specials, desserts
Service Industry Inspection Table 6.5 Organization What is Inspected Standard Nordstrom Department  Store Display areas Stockrooms Salesclerks Attractive, well-organized, stocked, good lighting Rotation of goods, organized, clean Neat, courteous, very knowledgeable
Attributes Versus Variables Attributes Items are either good or bad, acceptable or unacceptable Does not address degree of failure Variables Measures dimensions such as weight, speed, height, or strength Falls within an acceptable range Use different statistical techniques
TQM In Services Service quality is more difficult to measure than the quality of goods Service quality perceptions depend on  Intangible differences between products Intangible expectations customers have of those products
Service Quality The Operations Manager must recognize: The tangible component of services is important The service process is important The service is judged against the customer’s expectations Exceptions will occur
Service Specifications at UPS
Determinants of Service Quality Reliability Responsiveness Competence Access Courtesy Communication Credibility Security Understanding/ knowing the customer Tangibles
Service Recovery Strategy Managers should have a plan for when services fail Marriott’s LEARN routine Listen Empathize Apologize React Notify

Session 7_OM

  • 1.
    Operations Management Session7– Managing Quality
  • 2.
    Learning Objectives Whenyou complete this chapter you should be able to: Define quality and TQM Describe the ISO international quality standards Explain Six Sigma Explain how benchmarking is used Explain quality robust products and Taguchi concepts Use the seven tools of TQM
  • 3.
    Managing Quality Providesa Competitive Advantage Arnold Palmer Hospital Deliver over 13,000 babies annually Virtually every type of quality tool is employed Continuous improvement Employee empowerment Benchmarking Just-in-time Quality tools
  • 4.
    Quality and StrategyManaging quality supports differentiation, low cost, and response strategies Quality helps firms increase sales and reduce costs Building a quality organization is a demanding task
  • 5.
    Two Ways Quality Improves Profitability Figure 6.1 Improved Quality Increased Profits Increased productivity Lower rework and scrap costs Lower warranty costs Reduced Costs via Improved response Flexible pricing Improved reputation Sales Gains via
  • 6.
    The Flow ofActivities Organizational Practices Leadership, Mission statement, Effective operating procedures, Staff support, Training Yields: What is important and what is to be accomplished Figure 6.2 Quality Principles Customer focus, Continuous improvement, Benchmarking, Just-in-time, Tools of TQM Yields: How to do what is important and to be accomplished Employee Fulfillment Empowerment, Organizational commitment Yields: Employee attitudes that can accomplish what is important Customer Satisfaction Winning orders, Repeat customers Yields: An effective organization with a competitive advantage
  • 7.
    Defining Quality Thetotality of features and characteristics of a product or service that bears on its ability to satisfy stated or implied needs American Society for Quality
  • 8.
    Different Views User-based– better performance, more features Manufacturing-based – conformance to standards, making it right the first time Product-based – specific and measurable attributes of the product
  • 9.
    Implications of QualityCompany reputation Perception of new products Employment practices Supplier relations Product liability Reduce risk Global implications Improved ability to compete
  • 10.
    Key Dimensions ofQuality Performance Features Reliability Conformance Durability Serviceability Aesthetics Perceived quality Value
  • 11.
    Malcom Baldrige NationalQuality Award Established in 1988 by the U.S. government Designed to promote TQM practices Recent winners Premier Inc., MESA Products, Sunny Fresh Foods, Park Place Lexus, North Mississippi Medical Center, The Bama Companies, Richland College, Texas Nameplate Company, Inc.
  • 12.
    Baldrige Criteria Applicantsare evaluated on: Categories Points Leadership 120 Strategic Planning 85 Customer & Market Focus 85 Measurement, Analysis, and Knowledge Management 90 Workforce Focus 85 Process Management 85 Results 450
  • 13.
    Takumi A Japanesecharacter that symbolizes a broader dimension than quality, a deeper process than education, and a more perfect method than persistence
  • 14.
    Costs of QualityPrevention costs - reducing the potential for defects Appraisal costs - evaluating products, parts, and services Internal failure - producing defective parts or service before delivery External costs - defects discovered after delivery
  • 15.
    Costs of QualityExternal Failure Internal Failure Prevention Appraisal Total Cost Quality Improvement Total Cost
  • 16.
    Leaders in QualityW. Edwards Deming 14 Points for Management Joseph M. Juran Top management commitment, fitness for use Armand Feigenbaum Total Quality Control Philip B. Crosby Quality is Free, zero defects
  • 17.
    Ethics and QualityManagement Operations managers must deliver healthy, safe, quality products and services Poor quality risks injuries, lawsuits, recalls, and regulation Organizations are judged by how they respond to problems All stakeholders much be considered
  • 18.
    International Quality StandardsISO 9000 series (Europe/EC) Common quality standards for products sold in Europe (even if made in U.S.) 2000 update places greater emphasis on leadership and customer satisfaction ISO 14000 series (Europe/EC)
  • 19.
    ISO 14000 EnvironmentalStandard Core Elements: Environmental management Auditing Performance evaluation Labeling Life cycle assessment
  • 20.
    TQM Encompasses entireorganization, from supplier to customer Stresses a commitment by management to have a continuing, companywide drive toward excellence in all aspects of products and services that are important to the customer
  • 21.
    Deming’s Fourteen PointsCreate consistency of purpose Lead to promote change Build quality into the product; stop depending on inspection Build long-term relationships based on performance, not price Continuously improve product, quality, and service Start training Emphasize leadership Table 6.1
  • 22.
    Deming’s Fourteen PointsDrive out fear Break down barriers between departments Stop haranguing workers Support, help, improve Remove barriers to pride in work Institute a vigorous program of education and self-improvement Put everybody in the company to work on the transformation Table 6.1
  • 23.
    Seven Concepts ofTQM Continuous improvement Six Sigma Employee empowerment Benchmarking Just-in-time (JIT) Taguchi concepts Knowledge of TQM tools
  • 24.
    Continuous Improvement Representscontinual improvement of all processes Involves all operations and work centers including suppliers and customers People, Equipment, Materials, Procedures
  • 25.
    Shewhart’s PDCA ModelFigure 6.3 2. Do Test the plan 3. Check Is the plan working? 4. Act Implement the plan Plan Identify the improvement and make a plan
  • 26.
    Six Sigma Twomeanings Statistical definition of a process that is 99.9997% capable, 3.4 defects per million opportunities (DPMO) A program designed to reduce defects, lower costs, and improve customer satisfaction
  • 27.
    Six Sigma Twomeanings Statistical definition of a process that is 99.9997% capable, 3.4 defects per million opportunities (DPMO) A program designed to reduce defects, lower costs, and improve customer satisfaction Figure 6.4 Mean Lower limits Upper limits 3.4 defects/million ±6  2,700 defects/million ±3 
  • 28.
    Six Sigma ProgramOriginally developed by Motorola, adopted and enhanced by Honeywell and GE Highly structured approach to process improvement A strategy A discipline - DMAIC 6 
  • 29.
    Six Sigma DMAICApproach Define critical outputs and identify gaps for improvement Measure the work and collect process data Analyze the data Improve the process Control the new process to make sure new performance is maintained
  • 30.
    Six Sigma ImplementationEmphasize defects per million opportunities as a standard metric Provide extensive training Focus on corporate sponsor support (Champions) Create qualified process improvement experts (Black Belts, Green Belts, etc.) Set stretch objectives This cannot be accomplished without a major commitment from top level management
  • 31.
    Employee Empowerment Gettingemployees involved in product and process improvements 85% of quality problems are due to process and material Techniques Build communication networks that include employees Develop open, supportive supervisors Move responsibility to employees Build a high-morale organization Create formal team structures
  • 32.
    Quality Circles Groupof employees who meet regularly to solve problems Trained in planning, problem solving, and statistical methods Often led by a facilitator Very effective when done properly
  • 33.
    Benchmarking Use internalbenchmarking if you’re big enough Selecting best practices to use as a standard for performance Determine what to benchmark Form a benchmark team Identify benchmarking partners Collect and analyze benchmarking information Take action to match or exceed the benchmark
  • 34.
    Benchmarking Factors for Web Sites Table 6.3 Use of meta tags Yes: 70%, No: 30% Meaningful homepage title Yes: 97%, No: 3% Unique domain name Yes: 91%, No: 9% Search engine registration Above 96% Average loading speed 28K: 19.31, 56K: 10.88, T1: 2.59 Average number of spelling errors 0.16 Visibility of contact information Yes: 74%, No: 26% Presence of search engine Yes: 59%, No: 41% Translation to multiple languages Yes: 11%, No: 89%
  • 35.
    Best Practices forResolving Customer Complaints Make it easy for clients to complain Respond quickly to complaints Resolve complaints on first contact Use computers to manage complaints Recruit the best for customer service jobs
  • 36.
    Just-in-Time (JIT) Relationshipto quality: JIT cuts the cost of quality JIT improves quality Better quality means less inventory and better, easier-to-employ JIT system
  • 37.
    Taguchi Concepts Engineeringand experimental design methods to improve product and process design Identify key component and process variables affecting product variation Taguchi Concepts Quality robustness Quality loss function Target-oriented quality
  • 38.
    Quality Robustness Abilityto produce products uniformly in adverse manufacturing and environmental conditions Remove the effects of adverse conditions Small variations in materials and process do not destroy product quality
  • 39.
    Quality Loss FunctionShows that costs increase as the product moves away from what the customer wants Costs include customer dissatisfaction, warranty and service, internal scrap and repair, and costs to society Traditional conformance specifications are too simplistic Target-oriented quality
  • 40.
    Quality Loss FunctionFigure 6.5 Unacceptable Poor Good Best Fair High loss Loss (to producing organization, customer, and society) Low loss Frequency Lower Target Upper Specification Target-oriented quality yields more product in the “best” category Target-oriented quality brings product toward the target value Conformance-oriented quality keeps products within 3 standard deviations L = D 2 C where L = loss to society D = distance from target value C = cost of deviation
  • 41.
    Tools of TQMTools for Generating Ideas Check sheets Scatter diagrams Cause-and-effect diagrams Tools to Organize the Data Pareto charts Flowcharts Tools for Identifying Problems Histogram Statistical process control chart
  • 42.
    Seven Tools ofTQM / / / / /// / // /// // //// /// // / Hour Defect 1 2 3 4 5 6 7 8 A B C / / // / (a) Check Sheet: An organized method of recording data Figure 6.6
  • 43.
    Seven Tools ofTQM (b) Scatter Diagram: A graph of the value of one variable vs. another variable Figure 6.6 Absenteeism Productivity
  • 44.
    Seven Tools ofTQM (c) Cause-and-Effect Diagram: A tool that identifies process elements (causes) that might effect an outcome Figure 6.6 Cause Materials Methods Manpower Machinery Effect
  • 45.
    Seven Tools ofTQM (d) Pareto Chart: A graph to identify and plot problems or defects in descending order of frequency Figure 6.6 Frequency Percent A B C D E
  • 46.
    Seven Tools ofTQM (e) Flowchart (Process Diagram): A chart that describes the steps in a process Figure 6.6
  • 47.
    Seven Tools ofTQM (f) Histogram: A distribution showing the frequency of occurrences of a variable Figure 6.6 Distribution Repair time (minutes) Frequency
  • 48.
    Seven Tools ofTQM (g) Statistical Process Control Chart: A chart with time on the horizontal axis to plot values of a statistic Figure 6.6 Upper control limit Target value Lower control limit Time
  • 49.
    Cause-and-Effect Diagrams Figure6.7 Material (ball) Method (shooting process) Machine (hoop & backboard) Manpower (shooter) Missed free-throws Rim alignment Rim size Backboard stability Rim height Follow-through Hand position Aiming point Bend knees Balance Size of ball Lopsidedness Grain/Feel (grip) Air pressure Training Conditioning Motivation Concentration Consistency
  • 50.
    Pareto Charts Numberof occurrences Room svc Check-in Pool hours Minibar Misc. 72% 16% 5% 4% 3% 12 4 3 2 54 – 100 – 93 – 88 – 72 70 – 60 – 50 – 40 – 30 – 20 – 10 – 0 – Frequency (number) Causes and percent of the total Cumulative percent Data for October
  • 51.
    Flow Charts MRIFlowchart Physician schedules MRI Patient taken to MRI Patient signs in Patient is prepped Technician carries out MRI Technician inspects film If unsatisfactory, repeat Patient taken back to room MRI read by radiologist MRI report transferred to physician Patient and physician discuss 11 10 20% 9 8 80% 1 2 3 4 5 6 7
  • 52.
    Statistical Process Control(SPC) Uses statistics and control charts to tell when to take corrective action Drives process improvement Four key steps Measure the process When a change is indicated, find the assignable cause Eliminate or incorporate the cause Restart the revised process
  • 53.
    An SPC ChartFigure 6.8 Upper control limit Coach’s target value Lower control limit Game number | | | | | | | | | 1 2 3 4 5 6 7 8 9 20% 10% 0% Plots the percent of free throws missed
  • 54.
    Inspection Involves examiningitems to see if an item is good or defective Detect a defective product Does not correct deficiencies in process or product It is expensive Issues When to inspect Where in process to inspect
  • 55.
    When and Whereto Inspect At the supplier’s plant while the supplier is producing At your facility upon receipt of goods from the supplier Before costly or irreversible processes During the step-by-step production process When production or service is complete Before delivery to your customer At the point of customer contact
  • 56.
    Inspection Many problemsWorker fatigue Measurement error Process variability Cannot inspect quality into a product Robust design, empowered employees, and sound processes are better solutions
  • 57.
    Source Inspection Alsoknown as source control The next step in the process is your customer Ensure perfect product to your customer Poka-yoke is the concept of foolproof devices or techniques designed to pass only acceptable product
  • 58.
    Service Industry InspectionTable 6.5 Organization What is Inspected Standard Jones Law Office Receptionist performance Billing Attorney Is phone answered by the second ring Accurate, timely, and correct format Promptness in returning calls
  • 59.
    Service Industry InspectionTable 6.5 Organization What is Inspected Standard Hard Rock Hotel Reception desk Doorman Room Minibar Use customer’s name Greet guest in less than 30 seconds All lights working, spotless bathroom Restocked and charges accurately posted to bill
  • 60.
    Service Industry InspectionTable 6.5 Organization What is Inspected Standard Arnold Palmer Hospital Billing Pharmacy Lab Nurses Admissions Accurate, timely, and correct format Prescription accuracy, inventory accuracy Audit for lab-test accuracy Charts immediately updated Data entered correctly and completely
  • 61.
    Service Industry InspectionTable 6.5 Organization What is Inspected Standard Olive Garden Restaurant Busboy Busboy Waiter Serves water and bread within 1 minute Clears all entrée items and crumbs prior to dessert Knows and suggest specials, desserts
  • 62.
    Service Industry InspectionTable 6.5 Organization What is Inspected Standard Nordstrom Department Store Display areas Stockrooms Salesclerks Attractive, well-organized, stocked, good lighting Rotation of goods, organized, clean Neat, courteous, very knowledgeable
  • 63.
    Attributes Versus VariablesAttributes Items are either good or bad, acceptable or unacceptable Does not address degree of failure Variables Measures dimensions such as weight, speed, height, or strength Falls within an acceptable range Use different statistical techniques
  • 64.
    TQM In ServicesService quality is more difficult to measure than the quality of goods Service quality perceptions depend on Intangible differences between products Intangible expectations customers have of those products
  • 65.
    Service Quality TheOperations Manager must recognize: The tangible component of services is important The service process is important The service is judged against the customer’s expectations Exceptions will occur
  • 66.
  • 67.
    Determinants of ServiceQuality Reliability Responsiveness Competence Access Courtesy Communication Credibility Security Understanding/ knowing the customer Tangibles
  • 68.
    Service Recovery StrategyManagers should have a plan for when services fail Marriott’s LEARN routine Listen Empathize Apologize React Notify