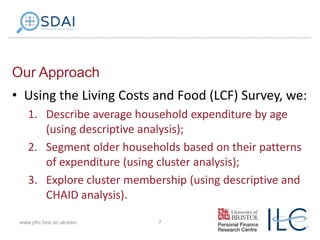
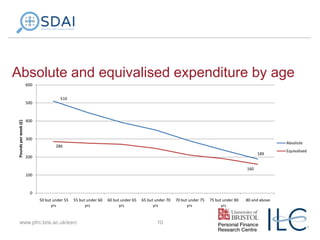
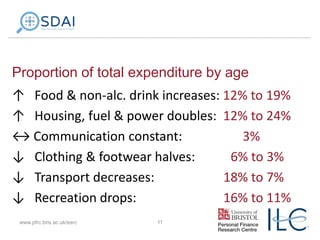
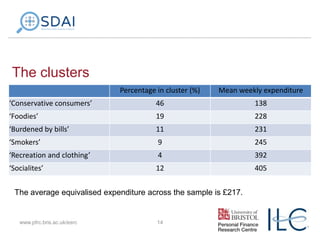
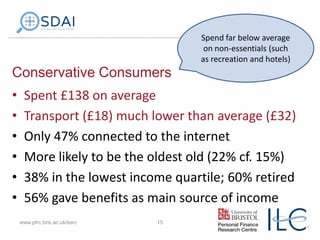
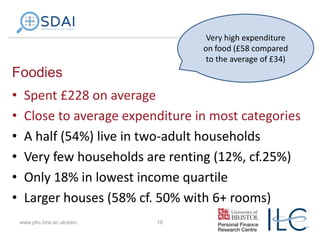
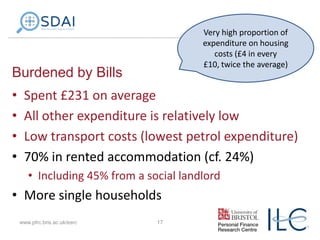
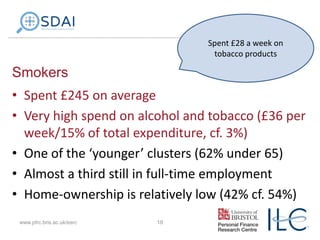
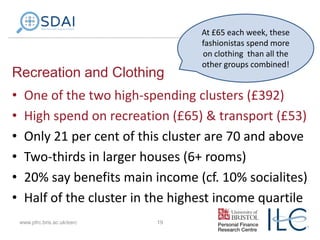
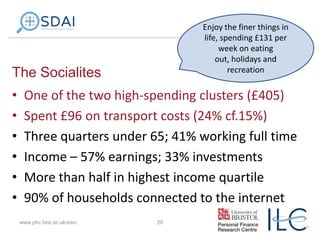
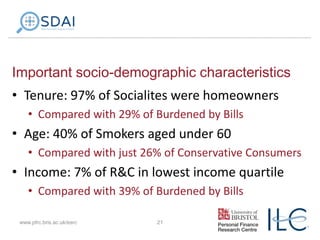
Should we forget about ‘the older
consumer’? An expert roundtable
on market segmentation
22nd October 2013
This event is kindly supported by PFRC
Welcome
David Metz
Visiting Professor
Centre for Transport Studies, University College London

This event is kindly supported by PFRC
David Sinclair
Assistant Director of Policy and Communications
ILC-UK

This event is kindly supported by PFRC
Laurence Miklichansky-Maddocks
Director of Brand and Business Insights for Europe
Brown-Forman Beverages

This event is kindly supported by PFRC
Spending by older people
David Hayes
Research Associate
PFRC

This event is kindly supported by PFRC
Exploring patterns of expenditure:
Segmenting the older UK consumer using
the Living Costs and Food Survey
David Hayes and Sharon Collard

Brown-Forman 22 October 2013
www.pfrc.bris.ac.uk/esrc

6
Our Approach
• Using the Living Costs and Food (LCF) Survey, we:
1. Describe average household expenditure by age
(using descriptive analysis);
2. Segment older households based on their patterns
of expenditure (using cluster analysis);
3. Explore cluster membership (using descriptive and
CHAID analysis).
www.pfrc.bris.ac.uk/esrc

7
Standard LCF expenditure categories
•
•
•
•
•
•
•

•
•
•
•
•

Alcohol & tobacco
Clothing & footwear
Communication
Education
Food & non-alc. drinks
Health
Household goods &
services

www.pfrc.bris.ac.uk/esrc

8

Housing, fuel & power
Recreation & culture
Restaurants & hotels
Transport
Miscellaneous goods &
services
Data Considerations
• Good sample of household heads aged 50+
• To cover transition into and beyond retirement
• Total sample size of 2,769
• Good distribution of age groups (even 80+ ~ 12%)

• Equivalised expenditure
• To take account of household size
www.pfrc.bris.ac.uk/esrc

9
Absolute and equivalised expenditure by age
600

Pounds per week (£)

500

510

400

300

Absolute

286
189

200
160
100

0
50 but under 55
yrs

55 but under 60
yrs

www.pfrc.bris.ac.uk/esrc

60 but under 65
yrs

65 but under 70
yrs

10

70 but under 75
yrs

75 but under 80
yrs

80 and above

Equivalised
Proportion of total expenditure by age
↑ Food & non-alc. drink increases: 12% to 19%
↑ Housing, fuel & power doubles: 12% to 24%
↔ Communication constant:
3%
↓ Clothing & footwear halves:
6% to 3%
↓ Transport decreases:
18% to 7%
↓ Recreation drops:
16% to 11%
www.pfrc.bris.ac.uk/esrc

11
The segmentation (clustering) process
• Exploring how types of expenditure co-vary
• Identifies dominant patterns
• Classifies people into segments based on these

• Clustered on the 12 expenditure categories
• ...the optimal solution contained six clusters
www.pfrc.bris.ac.uk/esrc

12
Drivers of cluster membership
• Highly statistically significant variations in
expenditure for all 12 categories
• Three categories were particularly strong
• Alcohol and tobacco
• Clothing and footwear
• Housing, fuel and power
www.pfrc.bris.ac.uk/esrc

13
The clusters
Percentage in cluster (%)

Mean weekly expenditure

‘Conservative consumers’

46

138

‘Foodies’

19

228

‘Burdened by bills’

11

231

‘Smokers’

9

245

‘Recreation and clothing’

4

392

‘Socialites’

12

405

The average equivalised expenditure across the sample is £217.

www.pfrc.bris.ac.uk/esrc

14
Spend far below average
on non-essentials (such
as recreation and hotels)

Conservative Consumers
•
•
•
•
•
•

Spent £138 on average
Transport (£18) much lower than average (£32)
Only 47% connected to the internet
More likely to be the oldest old (22% cf. 15%)
38% in the lowest income quartile; 60% retired
56% gave benefits as main source of income
www.pfrc.bris.ac.uk/esrc

15
Very high expenditure
on food (£58 compared
to the average of £34)

Foodies
•
•
•
•
•
•

Spent £228 on average
Close to average expenditure in most categories
A half (54%) live in two-adult households
Very few households are renting (12%, cf.25%)
Only 18% in lowest income quartile
Larger houses (58% cf. 50% with 6+ rooms)
www.pfrc.bris.ac.uk/esrc

16
Very high proportion of
expenditure on housing
costs (£4 in every
£10, twice the average)

Burdened by Bills
•
•
•
•

Spent £231 on average
All other expenditure is relatively low
Low transport costs (lowest petrol expenditure)
70% in rented accommodation (cf. 24%)
• Including 45% from a social landlord

• More single households
www.pfrc.bris.ac.uk/esrc

17
Spent £28 a week on
tobacco products

Smokers
• Spent £245 on average
• Very high spend on alcohol and tobacco (£36 per
week/15% of total expenditure, cf. 3%)
• One of the ‘younger’ clusters (62% under 65)
• Almost a third still in full-time employment
• Home-ownership is relatively low (42% cf. 54%)
www.pfrc.bris.ac.uk/esrc

18
Recreation and Clothing
•
•
•
•
•
•

At £65 each week, these
fashionistas spend more
on clothing than all the
other groups combined!

One of the two high-spending clusters (£392)
High spend on recreation (£65) & transport (£53)
Only 21 per cent of this cluster are 70 and above
Two-thirds in larger houses (6+ rooms)
20% say benefits main income (cf. 10% socialites)
Half of the cluster in the highest income quartile
www.pfrc.bris.ac.uk/esrc

19
Enjoy the finer things in
life, spending £131 per
week on eating
out, holidays and
recreation

The Socialites
•
•
•
•
•
•

One of the two high-spending clusters (£405)
Spent £96 on transport costs (24% cf.15%)
Three quarters under 65; 41% working full time
Income – 57% earnings; 33% investments
More than half in highest income quartile
90% of households connected to the internet
www.pfrc.bris.ac.uk/esrc

20
Important socio-demographic characteristics
• Tenure: 97% of Socialites were homeowners
• Compared with 29% of Burdened by Bills

• Age: 40% of Smokers aged under 60
• Compared with just 26% of Conservative Consumers

• Income: 7% of R&C in lowest income quartile
• Compared with 39% of Burdened by Bills
www.pfrc.bris.ac.uk/esrc

21
What does this research tell us?
•
•
•
•
•
•

Equivalised expenditure decreases with age...
...but other factors important
No such thing as the ‘older consumer?’
Depends on preferences, resources, mobility
However - Smokers are young (stop/morbidity)
Housing costs key in wellbeing (+/- constraints)
www.pfrc.bris.ac.uk/esrc

22
But, we only know so much...
• Conservative Consumers are a diverse group
• And need unpacking further to understand why they
spend comparatively little

• Hostels, boarding houses, and institutions such
as rest/care and nursing homes are excluded
• The true effect of ageing vs. generational effects
remains unclear – further analysis needed
www.pfrc.bris.ac.uk/esrc

23
Exploring patterns of expenditure:
Segmenting the older UK consumer using
the Living Costs and Food Survey
David Hayes and Sharon Collard

Brown-Forman 22 October 2013
www.pfrc.bris.ac.uk/esrc

24
Response
Dick Stroud
Managing Director
20plus30

This event is kindly supported by PFRC
Debate and Q&A

This event is kindly supported by PFRC
Should we forget about ‘the older
consumer’? An expert roundtable
on market segmentation
22nd October 2013

This event is kindly supported by PFRC

Should we forget about ‘the older consumer’? An expert roundtable on market segmentation - 22.10.2013

  • 1.
    Should we forgetabout ‘the older consumer’? An expert roundtable on market segmentation 22nd October 2013 This event is kindly supported by PFRC
  • 2.
    Welcome David Metz Visiting Professor Centrefor Transport Studies, University College London This event is kindly supported by PFRC
  • 3.
    David Sinclair Assistant Directorof Policy and Communications ILC-UK This event is kindly supported by PFRC
  • 4.
    Laurence Miklichansky-Maddocks Director ofBrand and Business Insights for Europe Brown-Forman Beverages This event is kindly supported by PFRC
  • 5.
    Spending by olderpeople David Hayes Research Associate PFRC This event is kindly supported by PFRC
  • 6.
    Exploring patterns ofexpenditure: Segmenting the older UK consumer using the Living Costs and Food Survey David Hayes and Sharon Collard Brown-Forman 22 October 2013 www.pfrc.bris.ac.uk/esrc 6
  • 7.
    Our Approach • Usingthe Living Costs and Food (LCF) Survey, we: 1. Describe average household expenditure by age (using descriptive analysis); 2. Segment older households based on their patterns of expenditure (using cluster analysis); 3. Explore cluster membership (using descriptive and CHAID analysis). www.pfrc.bris.ac.uk/esrc 7
  • 8.
    Standard LCF expenditurecategories • • • • • • • • • • • • Alcohol & tobacco Clothing & footwear Communication Education Food & non-alc. drinks Health Household goods & services www.pfrc.bris.ac.uk/esrc 8 Housing, fuel & power Recreation & culture Restaurants & hotels Transport Miscellaneous goods & services
  • 9.
    Data Considerations • Goodsample of household heads aged 50+ • To cover transition into and beyond retirement • Total sample size of 2,769 • Good distribution of age groups (even 80+ ~ 12%) • Equivalised expenditure • To take account of household size www.pfrc.bris.ac.uk/esrc 9
  • 10.
    Absolute and equivalisedexpenditure by age 600 Pounds per week (£) 500 510 400 300 Absolute 286 189 200 160 100 0 50 but under 55 yrs 55 but under 60 yrs www.pfrc.bris.ac.uk/esrc 60 but under 65 yrs 65 but under 70 yrs 10 70 but under 75 yrs 75 but under 80 yrs 80 and above Equivalised
  • 11.
    Proportion of totalexpenditure by age ↑ Food & non-alc. drink increases: 12% to 19% ↑ Housing, fuel & power doubles: 12% to 24% ↔ Communication constant: 3% ↓ Clothing & footwear halves: 6% to 3% ↓ Transport decreases: 18% to 7% ↓ Recreation drops: 16% to 11% www.pfrc.bris.ac.uk/esrc 11
  • 12.
    The segmentation (clustering)process • Exploring how types of expenditure co-vary • Identifies dominant patterns • Classifies people into segments based on these • Clustered on the 12 expenditure categories • ...the optimal solution contained six clusters www.pfrc.bris.ac.uk/esrc 12
  • 13.
    Drivers of clustermembership • Highly statistically significant variations in expenditure for all 12 categories • Three categories were particularly strong • Alcohol and tobacco • Clothing and footwear • Housing, fuel and power www.pfrc.bris.ac.uk/esrc 13
  • 14.
    The clusters Percentage incluster (%) Mean weekly expenditure ‘Conservative consumers’ 46 138 ‘Foodies’ 19 228 ‘Burdened by bills’ 11 231 ‘Smokers’ 9 245 ‘Recreation and clothing’ 4 392 ‘Socialites’ 12 405 The average equivalised expenditure across the sample is £217. www.pfrc.bris.ac.uk/esrc 14
  • 15.
    Spend far belowaverage on non-essentials (such as recreation and hotels) Conservative Consumers • • • • • • Spent £138 on average Transport (£18) much lower than average (£32) Only 47% connected to the internet More likely to be the oldest old (22% cf. 15%) 38% in the lowest income quartile; 60% retired 56% gave benefits as main source of income www.pfrc.bris.ac.uk/esrc 15
  • 16.
    Very high expenditure onfood (£58 compared to the average of £34) Foodies • • • • • • Spent £228 on average Close to average expenditure in most categories A half (54%) live in two-adult households Very few households are renting (12%, cf.25%) Only 18% in lowest income quartile Larger houses (58% cf. 50% with 6+ rooms) www.pfrc.bris.ac.uk/esrc 16
  • 17.
    Very high proportionof expenditure on housing costs (£4 in every £10, twice the average) Burdened by Bills • • • • Spent £231 on average All other expenditure is relatively low Low transport costs (lowest petrol expenditure) 70% in rented accommodation (cf. 24%) • Including 45% from a social landlord • More single households www.pfrc.bris.ac.uk/esrc 17
  • 18.
    Spent £28 aweek on tobacco products Smokers • Spent £245 on average • Very high spend on alcohol and tobacco (£36 per week/15% of total expenditure, cf. 3%) • One of the ‘younger’ clusters (62% under 65) • Almost a third still in full-time employment • Home-ownership is relatively low (42% cf. 54%) www.pfrc.bris.ac.uk/esrc 18
  • 19.
    Recreation and Clothing • • • • • • At£65 each week, these fashionistas spend more on clothing than all the other groups combined! One of the two high-spending clusters (£392) High spend on recreation (£65) & transport (£53) Only 21 per cent of this cluster are 70 and above Two-thirds in larger houses (6+ rooms) 20% say benefits main income (cf. 10% socialites) Half of the cluster in the highest income quartile www.pfrc.bris.ac.uk/esrc 19
  • 20.
    Enjoy the finerthings in life, spending £131 per week on eating out, holidays and recreation The Socialites • • • • • • One of the two high-spending clusters (£405) Spent £96 on transport costs (24% cf.15%) Three quarters under 65; 41% working full time Income – 57% earnings; 33% investments More than half in highest income quartile 90% of households connected to the internet www.pfrc.bris.ac.uk/esrc 20
  • 21.
    Important socio-demographic characteristics •Tenure: 97% of Socialites were homeowners • Compared with 29% of Burdened by Bills • Age: 40% of Smokers aged under 60 • Compared with just 26% of Conservative Consumers • Income: 7% of R&C in lowest income quartile • Compared with 39% of Burdened by Bills www.pfrc.bris.ac.uk/esrc 21
  • 22.
    What does thisresearch tell us? • • • • • • Equivalised expenditure decreases with age... ...but other factors important No such thing as the ‘older consumer?’ Depends on preferences, resources, mobility However - Smokers are young (stop/morbidity) Housing costs key in wellbeing (+/- constraints) www.pfrc.bris.ac.uk/esrc 22
  • 23.
    But, we onlyknow so much... • Conservative Consumers are a diverse group • And need unpacking further to understand why they spend comparatively little • Hostels, boarding houses, and institutions such as rest/care and nursing homes are excluded • The true effect of ageing vs. generational effects remains unclear – further analysis needed www.pfrc.bris.ac.uk/esrc 23
  • 24.
    Exploring patterns ofexpenditure: Segmenting the older UK consumer using the Living Costs and Food Survey David Hayes and Sharon Collard Brown-Forman 22 October 2013 www.pfrc.bris.ac.uk/esrc 24
  • 25.
  • 26.
    Debate and Q&A Thisevent is kindly supported by PFRC
  • 27.
    Should we forgetabout ‘the older consumer’? An expert roundtable on market segmentation 22nd October 2013 This event is kindly supported by PFRC

Editor's Notes

  • #12 Little variation in expenditure on alcohol & tobacco and household goods & services