Downloaded 433 times

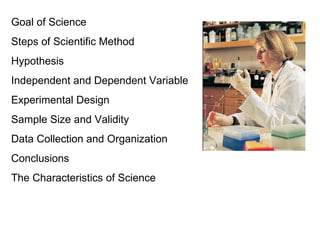
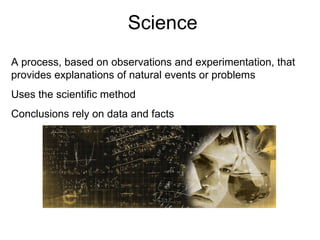
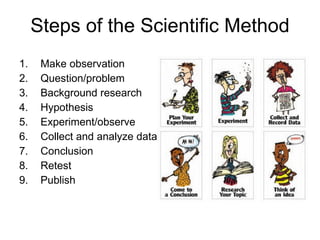
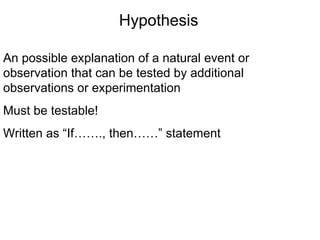
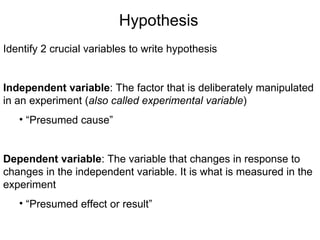
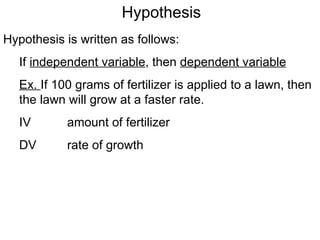
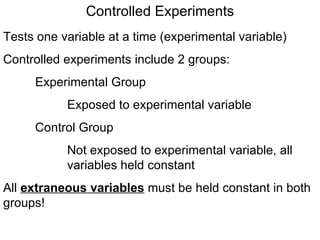
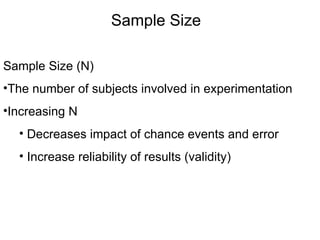
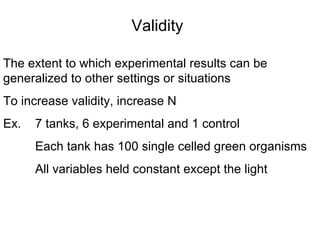
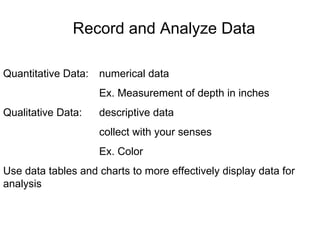


The document outlines the scientific method as a structured process that involves making observations, formulating a hypothesis, conducting experiments, and analyzing data to reach a conclusion. It highlights the importance of independent and dependent variables, the need for controlled experiments, and the significance of sample size in validating results. Additionally, it emphasizes that scientific conclusions must be based on repeatable evidence and can be refuted if contradicted by data.