CSSS 科学计量与知识图谱系列
3
学习资源
图 0.1 科学知识图谱学习微信学习社区
QQ 群 A 303640837
QQ 群 B 535200942
科学计量与知识图谱指南系列出版物
图 0. 2 已出版
计划待出版
R 科学计量数据可视化(首都经济贸易大学出版社-2018)
科学知识图谱原理及应用-VOSviewer 与 CitNetExplorer(高等教育出版社-2017)
已分享在线指南
CiteSpace 中文版指南
http://blog.sciencenet.cn/blog-554179-1027923.html
如何使用 CiteSpace 的一组示范及常见问题解答
http://blog.sciencenet.cn/blog-554179-838345.html
知识图谱学习推荐博客:
陈超美教授:http://blog.sciencenet.cn/u/ChaomeiChen
李杰博士:http://blog.sciencenet.cn/u/jerrycueb
科学计量学暑期学校
Chinese Summer School for Scientometrics
4.
CSSS 科学计量与知识图谱系列
第1讲 SCI2软件功能简介
1.1 软件概况
SCI2(sci of sci,简称 sci2)①
是由美国印第安那大学信息与计算学院信息与
图书馆学系在美国科学基金 No. SBE-0738111、IIS-0715303 以及 James S. McDonnell
基金会的支持下开发。Sci2 的主要成员有来自印第安纳大学的 Katy Börner 和
SciTech Strategies 公司的 Kevin W. Boyack。项目具体开发由 Daniel Halsey, Adam
Simpson, Saumya Pandey, Sumit Samant, Vivek Karihaloo, Chin Hua Kong, Steven
Corenflos, Joseph Biberstine, Thomas G. Smith, David M. Coe, Micah W. Linnemeier,
Patrick A. Phillips, Chintan Tank 和 Russell J. Duhon 组 成 的 开 发 团 队 基 于
Cyberinfrastructure Shell 开发。
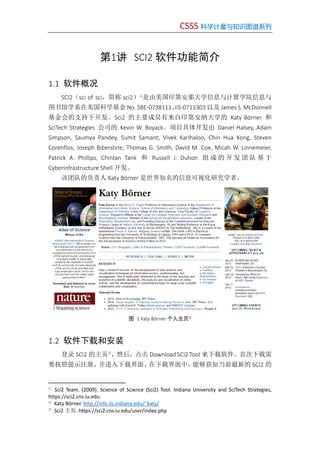
该团队的负责人 Katy Börner 是世界知名的信息可视化研究学者。
图 1 Katy Börner 个人主页②
1.2 软件下载和安装
登录 SCI2 的主页③
,然后,点击 Download SCI2 Tool 来下载软件。首次下载需
要按照提示注册,并进入下载界面。在下载界面中,能够获知当前最新的 SCI2 的
①
Sci2 Team. (2009). Science of Science (Sci2) Tool. Indiana University and SciTech Strategies,
https://sci2.cns.iu.edu.
②
Katy Börner. http://info.ils.indiana.edu/~katy/
③
Sci2 主页. https://sci2.cns.iu.edu/user/index.php
5.
CSSS 科学计量与知识图谱系列
5
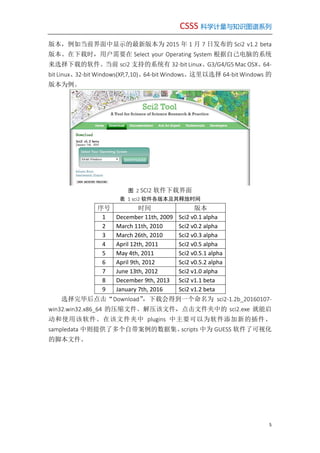
版本,例如当前界面中显示的最新版本为 2015年 1 月 7 日发布的 Sci2 v1.2 beta
版本。在下载时,用户需要在 Select your Operating System 根据自己电脑的系统
来选择下载的软件。当前 sci2 支持的系统有 32-bit Linux、G3/G4/G5 Mac OSX、64-
bit Linux、32-bit Windows(XP,7,10)、64-bit Windows。这里以选择 64-bit Windows 的
版本为例。
图 2 SCI2 软件下载界面
表 1 sci2 软件各版本及其释放时间
序号 时间 版本
1 December 11th, 2009 Sci2 v0.1 alpha
2 March 11th, 2010 Sci2 v0.2 alpha
3 March 26th, 2010 Sci2 v0.3 alpha
4 April 12th, 2011 Sci2 v0.5 alpha
5 May 4th, 2011 Sci2 v0.5.1 alpha
6 April 9th, 2012 Sci2 v0.5.2 alpha
7 June 13th, 2012 Sci2 v1.0 alpha
8 December 9th, 2013 Sci2 v1.1 beta
9 January 7th, 2016 Sci2 v1.2 beta
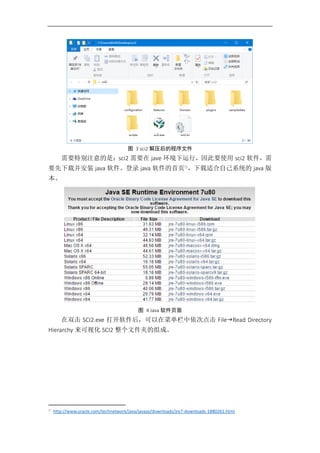
选择完毕后点击“Download”,下载会得到一个命名为 sci2-1.2b_20160107-
win32.win32.x86_64 的压缩文件。解压该文件,点击文件夹中的 sci2.exe 就能启
动和使用该软件。在该文件夹中 plugins 中主要可以为软件添加新的插件、
sampledata 中则提供了多个自带案例的数据集、scripts 中为 GUESS 软件了可视化
的脚本文件。
CSSS 科学计量与知识图谱系列
7
图 5SCI2 文件夹包含的主要子文件夹
这里需要提醒用户,sci2 在更新过程中去除了以数据库形式来加载 web of
science 数据的功能,若用户还需要使用该功能,则需要点击下载页面的 HIDE
ARCHIVED VERSIONS,找到 Sci2 v0.5.2 alpha(April 9th, 2012)①
版本进行下载。最后,
需要在软件的 Additional Plugins②
界面下载 DatabasePlugins.zip, WOS-plugins.zip 和
the default_menu.xml.对软件进行配置处理。
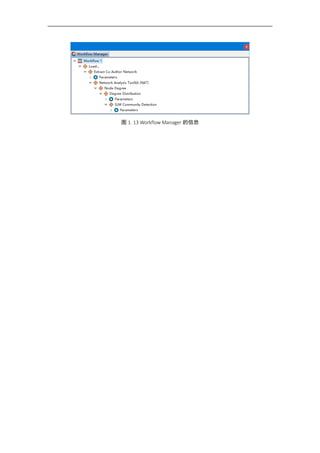
1.3 软件界面功能
点击解压后文件夹中的 sci2,打开软件。软件界面主要可以分为两大部分,
第一部分为菜单栏,包含了 File(文件)、Data Preparation(数据准备)、preprocessing
(预处理)、Analysis(分析)、Modeling(建模)、Visualization(可视化)、R(与
R 软件配合)和 Help(帮助)。第二部分主要为软件界面信息,包含 Console(处
理过程及整体结果的展示)、Scheduler(数据的处理状态)、Data Manager(数据
管理)和 Workflow Manager(工作流程)③
。
①
Sci2 v0.5.2 alpha April 9th, 2012 . https://sci2.cns.iu.edu/user/download.php
②
3.2 Additional Plugins. http://wiki.cns.iu.edu/display/SCI2TUTORIAL/3.2+Additional+Plugins
③
Sci2 Algorithms and Tools-软件菜单详解.
http://wiki.cns.iu.edu/display/SCI2TUTORIAL/3.1+Sci2+Algorithms+and+Tools
8.
图 6 软件无任务界面
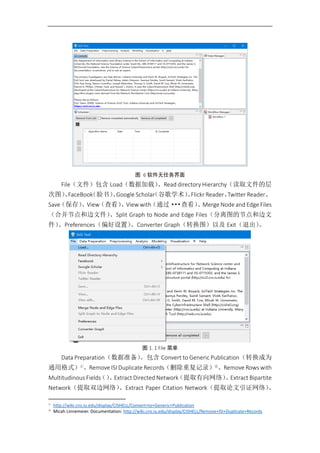
File(文件)包含Load(数据加载)、Read directory Hierarchy(读取文件的层
次图)、FaceBook(脸书)、Google Scholar(谷歌学术)、Flickr Reader、Twitter Reader、
Save(保存)、View(查看)、View with(通过···查看)、Merge Node and Edge Files
(合并节点和边文件)、Split Graph to Node and Edge Files(分离图的节点和边文
件)、Preferences(偏好设置)、Converter Graph(转换图)以及 Exit(退出)。
图 1. 1 File 菜单
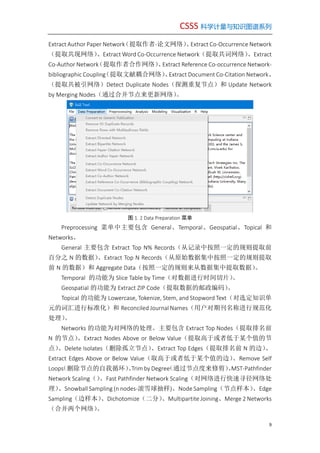
Data Preparation(数据准备)。包含 Convert to Generic Publication(转换成为
通用格式)①
、Remove ISI Duplicate Records(删除重复记录)②
、Remove Rows with
Multitudinous Fields()、Extract Directed Network(提取有向网络)、Extract Bipartite
Network(提取双边网络)、Extract Paper Citation Network(提取论文引证网络)、
①
http://wiki.cns.iu.edu/display/CISHELL/Convert+to+Generic+Publication
②
Micah Linnemeier. Documentation: http://wiki.cns.iu.edu/display/CISHELL/Remove+ISI+Duplicate+Records
9.
CSSS 科学计量与知识图谱系列
9
Extract AuthorPaper Network(提取作者-论文网络)、Extract Co-Occurrence Network
(提取共现网络)、Extract Word Co-Occurrence Network(提取共词网络)、Extract
Co-Author Network(提取作者合作网络)、Extract Reference Co-occurrence Network-
bibliographic Coupling(提取文献耦合网络)、Extract Document Co-Citation Network、
(提取共被引网络)Detect Duplicate Nodes(探测重复节点)和 Update Network
by Merging Nodes(通过合并节点来更新网络)。
图 1. 2 Data Preparation 菜单
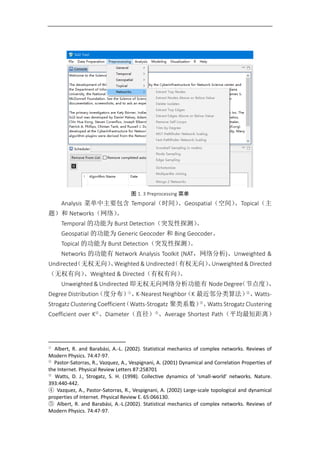
Preprocessing 菜单中主要包含 General、Temporal、Geospatial、Topical 和
Networks。
General 主要包含 Extract Top N% Records(从记录中按照一定的规则提取前
百分之 N 的数据)、Extract Top N Records(从原始数据集中按照一定的规则提取
前 N 的数据)和 Aggregate Data(按照一定的规则来从数据集中提取数据)。
Temporal 的功能为 Slice Table by Time(对数据进行时间切片)。
Geospatial 的功能为 Extract ZIP Code(提取数据的邮政编码)。
Topical 的功能为 Lowercase, Tokenize, Stem, and Stopword Text(对选定知识单
元的词汇进行标准化)和 Reconciled Journal Names(用户对期刊名称进行规范化
处理)。
Networks 的功能为对网络的处理。主要包含 Extract Top Nodes(提取排名前
N 的节点)、Extract Nodes Above or Below Value(提取高于或者低于某个值的节
点)、Delete Isolates(删除孤立节点)、Extract Top Edges(提取排名前 N 的边)、
Extract Edges Above or Below Value(取高于或者低于某个值的边)、Remove Self
Loops(删除节点的自我循环)、Trim by Degree(通过节点度来修剪)、MST-Pathfinder
Network Scaling()、Fast Pathfinder Network Scaling(对网络进行快速寻径网络处
理)、Snowball Sampling (n nodes-滚雪球抽样)、Node Sampling(节点样本)、Edge
Sampling(边样本)、Dichotomize(二分)、Multipartite Joining、Merge 2 Networks
(合并两个网络)。
10.
图 1. 3Preprocessing 菜单
Analysis 菜单中主要包含 Temporal(时间)、Geospatial(空间)、Topical(主
题)和 Networks(网络)。
Temporal 的功能为 Burst Detection(突发性探测)。
Geospatial 的功能为 Generic Geocoder 和 Bing Geocoder。
Topical 的功能为 Burst Detection(突发性探测)。
Networks 的功能有 Network Analysis Toolkit (NAT,网络分析)、Unweighted &
Undirected(无权无向)、Weighted & Undirected(有权无向)、Unweighted & Directed
(无权有向)、Weighted & Directed(有权有向)。
Unweighted & Undirected 即无权无向网络分析功能有 Node Degree(节点度)、
Degree Distribution(度分布)①
、K-Nearest Neighbor(K 最近邻分类算法)②
、Watts-
Strogatz Clustering Coefficient(Watts-Strogatz 聚类系数)③
、Watts Strogatz Clustering
Coefficient over K④
、Diameter(直径)⑤
、Average Shortest Path(平均最短距离)
①
Albert, R. and Barabási, A.-L. (2002). Statistical mechanics of complex networks. Reviews of
Modern Physics. 74:47-97.
②
Pastor-Satorras, R., Vazquez, A., Vespignani, A. (2001) Dynamical and Correlation Properties of
the Internet. Physical Review Letters 87:258701
③
Watts, D. J., Strogatz, S. H. (1998). Collective dynamics of 'small-world' networks. Nature.
393:440-442.
④ Vazquez, A., Pastor-Satorras, R., Vespignani, A. (2002) Large-scale topological and dynamical
properties of Internet. Physical Review E. 65:066130.
⑤ Albert, R. and Barabási, A.-L.(2002). Statistical mechanics of complex networks. Reviews of
Modern Physics. 74:47-97.
11.
CSSS 科学计量与知识图谱系列
11
①
、Shortest PathDistribution(最短路径分布)②
、Node Betweenness Centrality(节
点中介中心性)、Weak Component Clustering、Global Connected Components③
、
Extract K-Core(K 核分析)、Annotate K-Coreness、Blondel Community Detection
(Blondel 聚类)④
、Louvain Community Detection (with resolution parameter,Louvain
聚类-有分辨率参数)、Louvain Multilevel Refinement Community Detection、SLM
Community Detection(SLM 聚类)⑤
以及 HITS。
Weighted & Undirected 即有权无向网络分析功能有 Clustering Coefficient、
Nearest Neighbor Degree、Strength vs Degree、Degree && Strength、Average Weight
vs End-point Degree、Strength Distribution、Weight Distribution、Randomize Weights、
Node Betweenness Centrality、Blondel Community Detection、Louvain Community
Detection (with resolution parameter)、Louvain Multilevel Refinement Community
Detection、SLM Community Detection 以及 HITS。
Unweighted & Directed 即无权有向网络分析功能有 Node Indegree、Node
Outdegree、Indegree Distribution(入度)、Outdegree Distribution(出度)、K-Nearest
Neighbor、Single Node In-Out Degree Correlations、Dyad Reciprocity、Arc Reciprocity、
Adjacency Transitivity、Node Betweenness Centrality、Weak Component Clustering、
Strong Component Clustering、Blondel Community Detection、Louvain Community
Detection (with resolution parameter)、Louvain Multilevel Refinement Community
Detection、SLM Community Detection、Extract K-Core、Annotate K-Coreness、HITS
以及 PageRank。
Weighted & Directed 即有权有向网络分析功能有 Blondel Community Detection、
Louvain Community Detection (with resolution parameter) 、 Louvain Multilevel
Refinement Community Detection、SLM Community Detection、HITS 以及 PageRank。
① Albert, R. and Barabási, A.-L.(2002). Statistical mechanics of complex networks. Reviews of
Modern Physics. 74:47-97
② Albert, R. and Barabási, A.-L. (2002). Statistical mechanics of complex networks. Reviews of
Modern Physics. 74:47-97.
③ Albert, R. and Barabási, A.-L.(2002). Statistical mechanics of complex networks. Reviews of
Modern Physics. 74:47-97.
④ BLONDEL VD, 2008, J STAT MECH-THEO OCT, ARTN P10008
⑤ Ludo Waltman, Nees Jan van Eck, 2013. "A smart local moving algorithm for large-scale
modularity-based community detection". Eur. Phys. J. B (2013) 86: 471.
12.
图 1. 4Analysis 菜单
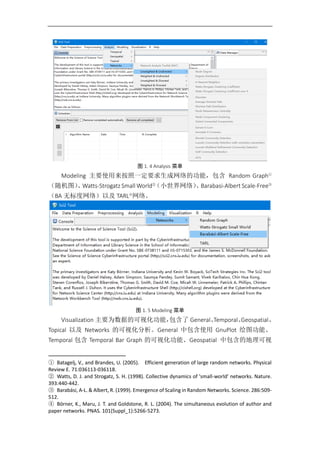
Modeling 主要使用来按照一定要求生成网络的功能,包含 Random Graph①
(随机图)、Watts-Strogatz Small World②
(小世界网络)、Barabasi-Albert Scale-Free③
(BA 无标度网络)以及 TARL④
网络。
图 1. 5 Modeling 菜单
Visualization 主要为数据的可视化功能,包含了 General、Temporal、Geospatial、
Topical 以及 Networks 的可视化分析。General 中包含使用 GnuPlot 绘图功能、
Temporal 包含 Temporal Bar Graph 的可视化功能、Geospatial 中包含的地理可视
① Batagelj, V., and Brandes, U. (2005). Efficient generation of large random networks. Physical
Review E. 71:036113-036118.
② Watts, D. J. and Strogatz, S. H. (1998). Collective dynamics of 'small-world' networks. Nature.
393:440-442.
③ Barabási, A-L. & Albert, R. (1999). Emergence of Scaling in Random Networks. Science. 286:509-
512.
④ Börner, K., Maru, J. T. and Goldstone, R. L. (2004). The simultaneous evolution of author and
paper networks. PNAS. 101(Suppl_1):5266-5273.
13.
CSSS 科学计量与知识图谱系列
13
化功能有 ProportionalSymbol Map、Choropleth Map 和 Geospatial Network Layout
with Base Map。Topical 包含的可视化功能为 Map of Science via Journals 和 Map of
Science via 554。
Networks 的 可 视 化 分 析 包 含 的 功 能 有 GUESS ①
、 Gephi ②
、 Radial
Tree/Graph(Prefuse alpha)、Radial Tree/ Graph with Annotation(Prefuse beta)、Tree
View(Prefuse beta)、Tree map(Prefuse beta)、Force directed with annotation (Prefuse
beta) 、 Fruchterman-Reingold with Annotation(Prefuse beta) 、 DrL(Vx Ord) 、
Specified(Prefuse beta)、Bipartite Network Graph、Circular Hierarchy。
图 1. 6 Visualization 菜单
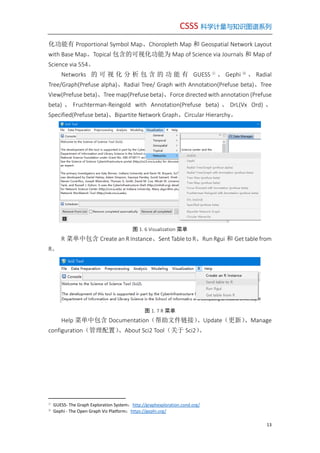
R 菜单中包含 Create an R Instance、Sent Table to R、Run Rgui 和 Get table from
R。
图 1. 7 R 菜单
Help 菜单中包含 Documentation(帮助文件链接)、Update(更新)、Manage
configuration(管理配置)、About Sci2 Tool(关于 Sci2)。
①
GUESS- The Graph Exploration System:http://graphexploration.cond.org/
②
Gephi - The Open Graph Viz Platform:https://gephi.org/
CSSS 科学计量与知识图谱系列
17
第2讲 WOS数据的采集
(1)从用户所在单位的电子资源中找到 Web of Science 链接或直接在 IE 中
输入 webofknowledge.com 以进入 web of Science 的主页。需要特别注意的是,该
资源为订购资源,若单位没有访问权限是无法登陆的。此外,即使单位已经订购,
该数据库也有购买的数据年限范围,因此各个针对同一主题的数据,检索结果可
能存在差异。
在进入 WoS 主页后,通常默认的数据库为“所有数据库”,具体是指检索的
数据将从单位所订购的 WoS 中所有的子数据库中检索结果。所有各个数据库在
数据结构上会存在一些差异,因此在分析时候往往选择单独的子数据库进行分析。
在科学知识网络可视化中,最常用 WoS 子数据库为“Web of Science 核心数据集
合”。
图 7 WoS 数据库的子数据库切换
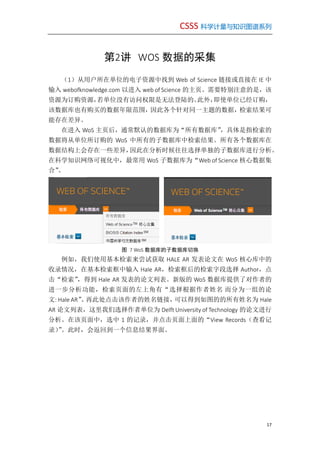
例如,我们使用基本检索来尝试获取 HALE AR 发表论文在 WoS 核心库中的
收录情况,在基本检索框中输入 Hale AR,检索框后的检索字段选择 Author,点
击“检索”,得到 Hale AR 发表的论文列表。新版的 WoS 数据库提供了对作者的
进一步分析功能,检索页面的左上角有“选择根据作者姓名 而分为一组的论
文: Hale AR”。再此处点击该作者的姓名链接,可以得到如图的的所有姓名为 Hale
AR 论文列表,这里我们选择作者单位为 Delft University of Technology 的论文进行
分析。在该页面中,选中 1 的记录,并点击页面上面的“View Records(查看记
录)”。此时,会返回到一个信息结果界面。
18.
图 8 WoS中获取 Hale A 的论文
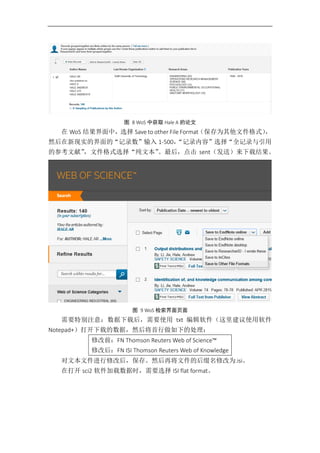
在 WoS 结果界面中,选择 Save to other File Format(保存为其他文件格式),
然后在新现实的界面的“记录数”输入 1-500,“记录内容”选择“全记录与引用
的参考文献”,文件格式选择“纯文本”。最后,点击 sent(发送)来下载结果。
图 9 WoS 检索界面页面
需要特别注意:数据下载后,需要使用 txt 编辑软件(这里建议使用软件
Notepad+)打开下载的数据,然后将首行做如下的处理:
修改前:FN Thomson Reuters Web of Science™
修改后:FN ISI Thomson Reuters Web of Knowledge
对文本文件进行修改后,保存。然后再将文件的后缀名修改为.isi。
在打开 sci2 软件加载数据时,需要选择 ISI flat format。
19.
CSSS 科学计量与知识图谱系列
19
第3讲 SCI2对数据的预处理
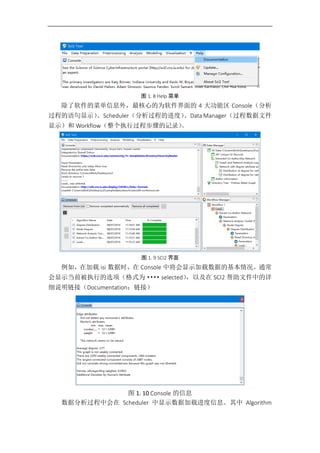
3.1 记录提取
在分析的数据量很大时,可以对下载后的数据进一步精炼。
将数据加载到 sci2 软件后,选择菜单栏的 PreprocessingGeneral 会有三个
选择来处理数据,分别为 Extract Top N% Records、Extract Top N Records 和 Aggregate
Data。
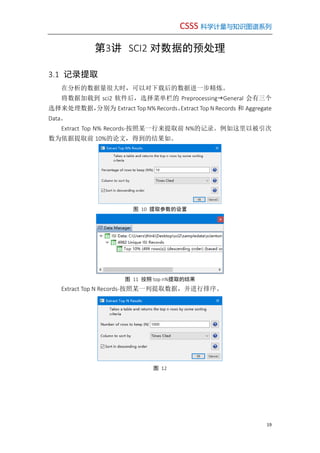
Extract Top N% Records-按照某一行来提取前 N%的记录。例如这里以被引次
数为依据提取前 10%的论文,得到的结果如。
图 10 提取参数的设置
图 11 按照 top n%提取的结果
Extract Top N Records-按照某一列提取数据,并进行排序。
图 12
20.
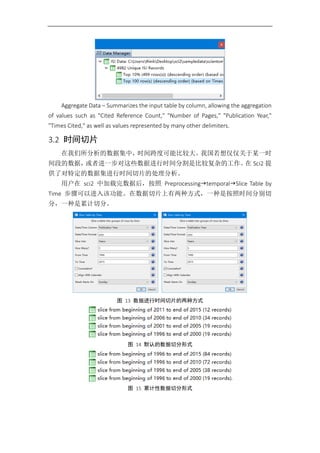
Aggregate Data –Summarizes the input table by column, allowing the aggregation
of values such as "Cited Reference Count," "Number of Pages," "Publication Year,"
"Times Cited," as well as values represented by many other delimiters.
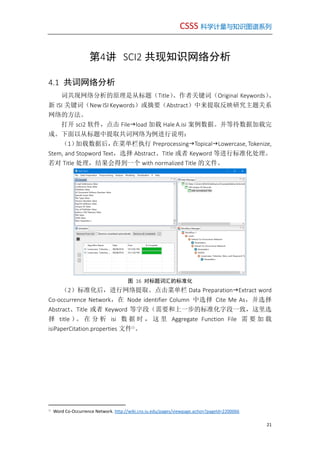
3.2 时间切片
在我们所分析的数据集中,时间跨度可能比较大。我国若想仅仅关于某一时
间段的数据,或者进一步对这些数据进行时间分割是比较复杂的工作。在 Sci2 提
供了对特定的数据集进行时间切片的处理分析。
用户在 sci2 中加载完数据后,按照 PreprocessingtemporalSlice Table by
Time 步骤可以进入该功能。在数据切片上有两种方式,一种是按照时间分别切
分,一种是累计切分。
图 13 数据进行时间切片的两种方式
图 14 默认的数据切分形式
图 15 累计性数据切分形式
21.
CSSS 科学计量与知识图谱系列
21
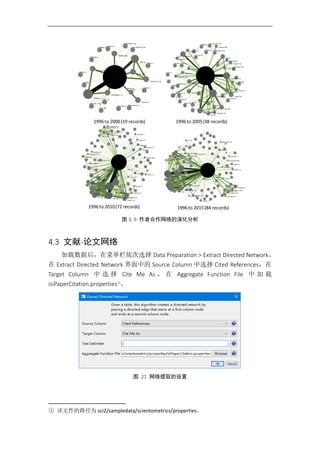
第4讲 SCI2共现知识网络分析
4.1 共词网络分析
词共现网络分析的原理是从标题(Title)、作者关键词(Original Keywords)、
新 ISI 关键词(New ISI Keywords)或摘要(Abstract)中来提取反映研究主题关系
网络的方法。
打开 sci2 软件,点击 Fileload 加载 Hale A.isi 案例数据。并等待数据加载完
成。下面以从标题中提取共词网络为例进行说明:
(1)加载数据后,在菜单栏执行 PreprocessingTopicalLowercase, Tokenize,
Stem, and Stopword Text,选择 Abstract、Title 或者 Keyword 等进行标准化处理。
若对 Title 处理,结果会得到一个 with normalized Title 的文件。
图 16 对标题词汇的标准化
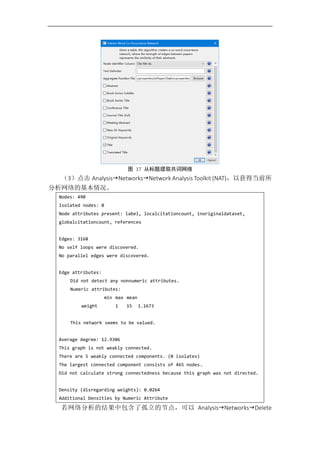
(2)标准化后,进行网络提取。点击菜单栏 Data PreparationExtract word
Co-occurrence Network,在 Node identifier Column 中选择 Cite Me As,并选择
Abstract、Title 或者 Keyword 等字段(需要和上一步的标准化字段一致,这里选
择 title )。 在 分 析 isi 数 据 时 , 这 里 Aggregate Function File 需 要 加 载
isiPaperCitation.properties 文件①
。
①
Word Co-Occurrence Network. http://wiki.cns.iu.edu/pages/viewpage.action?pageId=2200066
22.
图 17 从标题提取共词网络
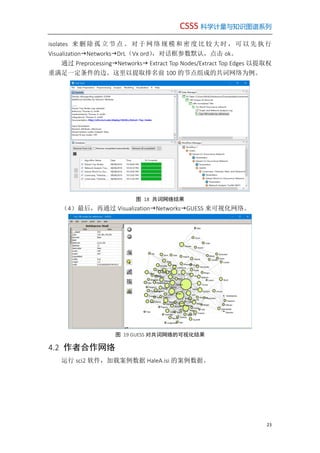
(3)点击AnalysisNetworksNetwork Analysis Toolkit (NAT),以获得当前所
分析网络的基本情况。
Nodes: 490
Isolated nodes: 0
Node attributes present: label, localcitationcount, inoriginaldataset,
globalcitationcount, references
Edges: 3168
No self loops were discovered.
No parallel edges were discovered.
Edge attributes:
Did not detect any nonnumeric attributes.
Numeric attributes:
min max mean
weight 1 15 1.1673
This network seems to be valued.
Average degree: 12.9306
This graph is not weakly connected.
There are 5 weakly connected components. (0 isolates)
The largest connected component consists of 465 nodes.
Did not calculate strong connectedness because this graph was not directed.
Density (disregarding weights): 0.0264
Additional Densities by Numeric Attribute
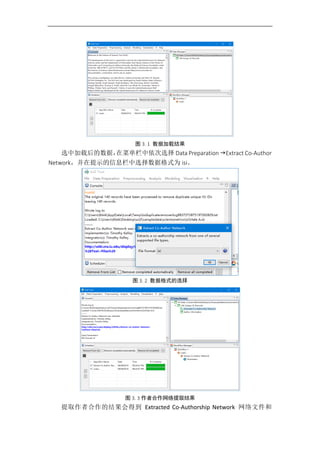
若网络分析的结果中包含了孤立的节点,可以 AnalysisNetworksDelete
CSSS 科学计量与知识图谱系列
25
Author information的列表文件。我们使用 EXCEl 表格打开 Author information 文
件,会发现有一些作者是需要合并的。例如,作者 Hale, Ar 和 Hale, A。为了快速
识别出相同和相似的作者,选中 Extracted Co-Authorship Network 文件,在菜单栏
中依次点击 Data Preparation Detect Duplicate Nodes。在 Detect Duplicate Nodes
中 Attribute to compare on 选择 label,其他参数默认。最后,点击 ok 完成识别。
图 3. 4 相似节点的识别
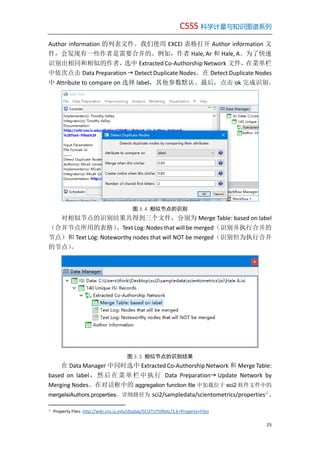
对相似节点的识别结果共得到三个文件,分别为 Merge Table: based on label
(合并节点所用的表格)、Text Log: Nodes that will be merged(识别并执行合并的
节点)和 Text Log: Noteworthy nodes that will NOT be merged(识别但为执行合并
的节点)。
图 3. 5 相似节点的识别结果
在 Data Manager 中同时选中 Extracted Co-Authorship Network 和 Merge Table:
based on label,然后在菜单栏中执行 Data Preparation Update Network by
Merging Nodes。在对话框中的 aggregation function file 中加载位于 sci2 软件文件中的
mergeIsiAuthors.properties。详细路径为 sci2/sampledata/scientometrics/properties①
。
①
Property Files. http://wiki.cns.iu.edu/display/SCI2TUTORIAL/3.6+Property+Files
CSSS 科学计量与知识图谱系列
29
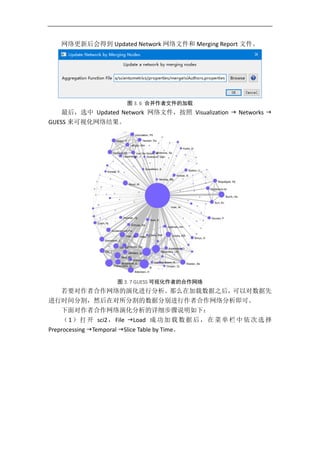
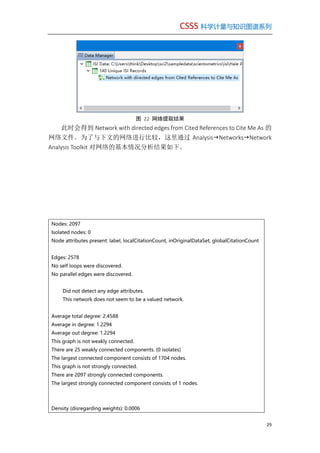
图 22网络提取结果
此时会得到 Network with directed edges from Cited References to Cite Me As 的
网络文件。为了与下文的网络进行比较,这里通过 AnalysisNetworksNetwork
Analysis Toolkit 对网络的基本情况分析结果如下。
Nodes: 2097
Isolated nodes: 0
Node attributes present: label, localCitationCount, inOriginalDataSet, globalCitationCount
Edges: 2578
No self loops were discovered.
No parallel edges were discovered.
Did not detect any edge attributes.
This network does not seem to be a valued network.
Average total degree: 2.4588
Average in degree: 1.2294
Average out degree: 1.2294
This graph is not weakly connected.
There are 25 weakly connected components. (0 isolates)
The largest connected component consists of 1704 nodes.
This graph is not strongly connected.
There are 2097 strongly connected components.
The largest strongly connected component consists of 1 nodes.
Density (disregarding weights): 0.0006
30.
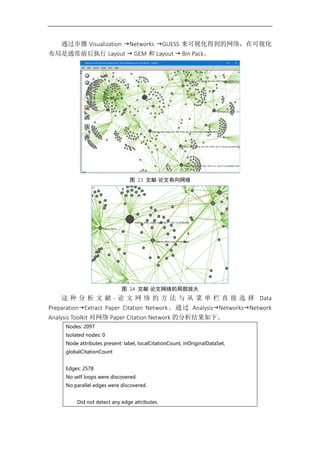
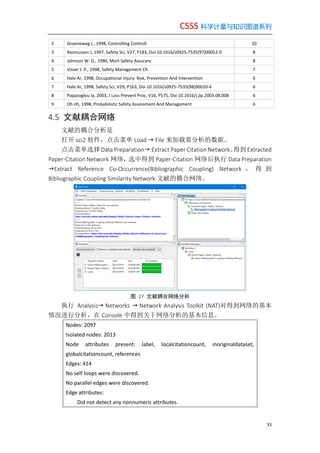
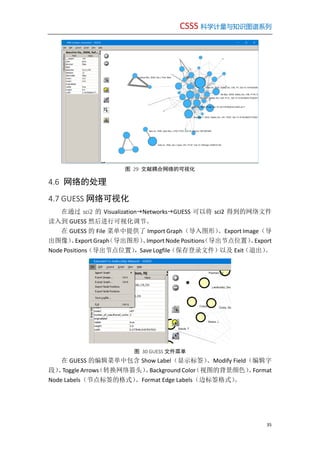
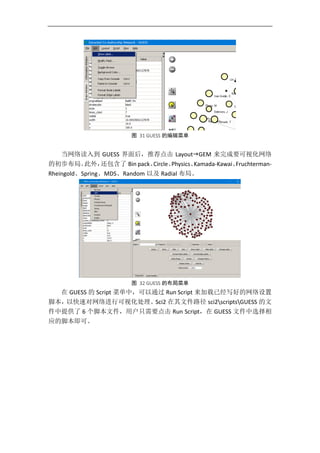
通过步骤 Visualization NetworksGUESS 来可视化得到的网络,在可视化
布局是通常前后执行 Layout GEM 和 Layout Bin Pack。
图 23 文献-论文有向网络
图 24 文献-论文网络的局部放大
这 种 分 析 文 献 - 论 文 网 络 的 方 法 与 从 菜 单 栏 直 接 选 择 Data
PreparationExtract Paper Citation Network。通过 AnalysisNetworksNetwork
Analysis Toolkit 对网络 Paper Citation Network 的分析结果如下。
Nodes: 2097
Isolated nodes: 0
Node attributes present: label, localCitationCount, inOriginalDataSet,
globalCitationCount
Edges: 2578
No self loops were discovered.
No parallel edges were discovered.
Did not detect any edge attributes.
31.
CSSS 科学计量与知识图谱系列
31
This networkdoes not seem to be a valued network.
Average total degree: 2.4588
Average in degree: 1.2294
Average out degree: 1.2294
This graph is not weakly connected.
There are 25 weakly connected components. (0 isolates)
The largest connected component consists of 1704 nodes.
This graph is not strongly connected.
There are 2097 strongly connected components.
The largest strongly connected component consists of 1 nodes.
Density (disregarding weights): 0.0006
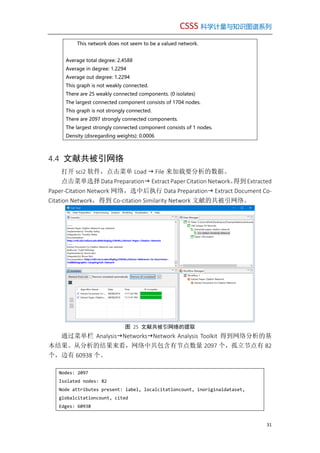
4.4 文献共被引网络
打开 sci2 软件,点击菜单 Load File 来加载要分析的数据。
点击菜单选择 Data Preparation Extract Paper Citation Network。得到Extracted
Paper-Citation Network 网络,选中后执行 Data Preparation Extract Document Co-
Citation Network,得到 Co-citation Similarity Network 文献的共被引网络。
图 25 文献共被引网络的提取
通过菜单栏 AnalysisNetworksNetwork Analysis Toolkit 得到网络分析的基
本结果。从分析的结果来看,网络中共包含有节点数量 2097 个,孤立节点有 82
个,边有 60938 个。
Nodes: 2097
Isolated nodes: 82
Node attributes present: label, localcitationcount, inoriginaldataset,
globalcitationcount, cited
Edges: 60938
32.
No self loopswere discovered.
No parallel edges were discovered.
Edge attributes:
Did not detect any nonnumeric attributes.
Numeric attributes:
min max mean
weight 1 4 1.06605
This network seems to be valued.
Average degree: 58.1192
This graph is not weakly connected.
There are 104 weakly connected components. (82 isolates)
The largest connected component consists of 1639 nodes.
Did not calculate strong connectedness because this graph was not directed.
Density (disregarding weights): 0.0277
Additional Densities by Numeric Attribute
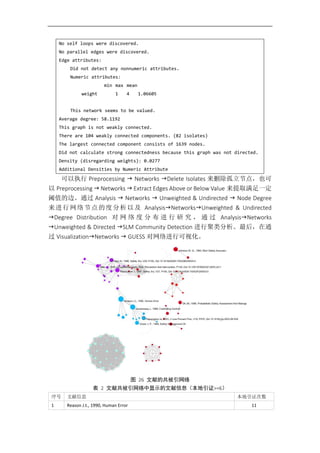
可以执行 Preprocessing Networks Delete Isolates 来删除孤立节点,也可
以 Preprocessing Networks Extract Edges Above or Below Value 来提取满足一定
阈值的边。通过 Analysis Networks Unweighted & Undirected Node Degree
来进行网络节点的度分析以及 AnalysisNetworksUnweighted & Undirected
Degree Distribution 对 网 络 度 分 布 进 行 研 究 , 通 过 AnalysisNetworks
Unweighted & Directed SLM Community Detection 进行聚类分析。最后,在通
过 VisualizationNetworks GUESS 对网络进行可视化。
图 26 文献的共被引网络
表 2 文献共被引网络中显示的文献信息(本地引证>=6)
序号 文献信息 本地引证次数
1 Reason J.t., 1990, Human Error 11
33.
CSSS 科学计量与知识图谱系列
33
2 GroenewegJ., 1998, Controlling Controll 10
3 Rasmussen J, 1997, Safety Sci, V27, P183, Doi 10.1016/s0925-7535(97)00052-0 8
4 Johnson W. G., 1980, Mort Safety Assuranc 8
5 Visser J. P., 1998, Safety Management Ch 7
6 Hale Ar, 1998, Occupational Injury: Risk, Prevention And Intervention 6
7 Hale Ar, 1998, Safety Sci, V29, P163, Doi 10.1016/s0925-7535(98)00020-4 6
8 Papazoglou Ia, 2003, J Loss Prevent Proc, V16, P575, Doi 10.1016/j.jlp.2003.08.008 6
9 Oh Jih, 1998, Probabilistic Safety Assessment And Management 6
4.5 文献耦合网络
文献的耦合分析是
打开 sci2 软件,点击菜单 Load File 来加载要分析的数据。
点击菜单选择 Data Preparation Extract Paper Citation Network。得到Extracted
Paper-Citation Network 网络,选中得到 Paper-Citation 网络后执行 Data Preparation
Extract Reference Co-Occurrence(Bibliographic Coupling) Network , 得 到
Bibliographic Coupling Similarity Network 文献的耦合网络。
图 27 文献耦合网络分析
执行 Analysis Networks Network Analysis Toolkit (NAT)对得到网络的基本
情况进行分析,在 Console 中得到关于网络分析的基本信息。
Nodes: 2097
Isolated nodes: 2013
Node attributes present: label, localcitationcount, inoriginaldataset,
globalcitationcount, references
Edges: 414
No self loops were discovered.
No parallel edges were discovered.
Edge attributes:
Did not detect any nonnumeric attributes.
34.
Numeric attributes:
min maxmean
weight 1 58 2.2657
This network seems to be valued.
Average degree: 0.3948
This graph is not weakly connected.
There are 2019 weakly connected components. (2013 isolates)
The largest connected component consists of 73 nodes.
Did not calculate strong connectedness because this graph was not directed.
Density (disregarding weights): 0.0002
Additional Densities by Numeric Attribute
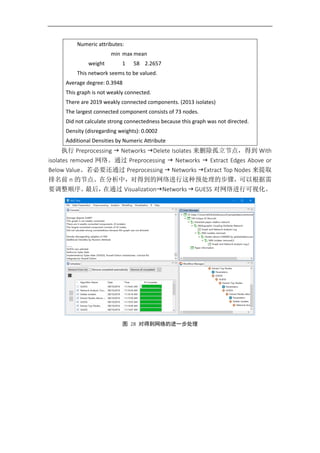
执行 Preprocessing Networks Delete Isolates 来删除孤立节点,得到 With
isolates removed 网络。通过 Preprocessing Networks Extract Edges Above or
Below Value。若必要还通过 Preprocessing Networks Extract Top Nodes 来提取
排名前 n 的节点。在分析中,对得到的网络进行这种预处理的步骤,可以根据需
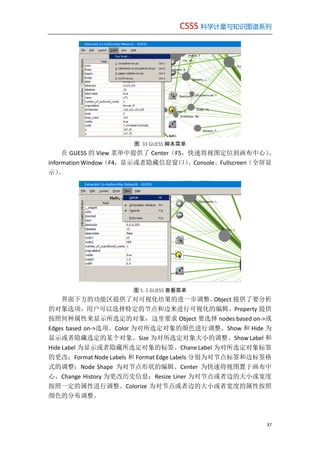
要调整顺序。最后,在通过 VisualizationNetworks GUESS 对网络进行可视化。
图 28 对得到网络的进一步处理
图 5. 2可视化参数设置
例如,在分析 Hale A 的合作时,按照下面的步骤进行。
在 Object 中先选择 all node,在点击 show label 为节点加上标签。在 Object
中选择 nodes based on->,然后 Property 中选择 community_level_0,在 Value 中
分别选择 community_ 0、community_ 1、community_ 2····等,并点击 colour 来
为各个类别加上颜色。点击 Resize linear 可以分别对节点的大小和边的权重分布
进行调整。例如这里让节点以频次显示,比例控制在 10-50。边的权重按照权重
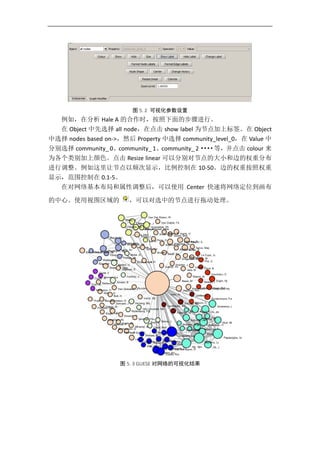
显示,范围控制在 0.1-5。
在对网络基本布局和属性调整后,可以使用 Center 快速将网络定位到画布
的中心。使用视图区域的 ,可以对选中的节点进行拖动处理。
图 5. 3 GUESE 对网络的可视化结果
39.
CSSS 科学计量与知识图谱系列
39
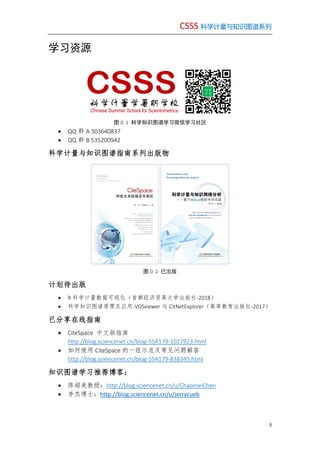
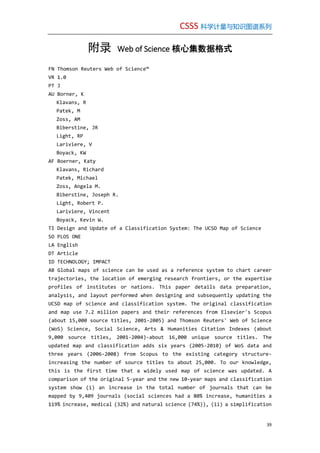
附录 Webof Science 核心集数据格式
FN Thomson Reuters Web of Science™
VR 1.0
PT J
AU Borner, K
Klavans, R
Patek, M
Zoss, AM
Biberstine, JR
Light, RP
Lariviere, V
Boyack, KW
AF Boerner, Katy
Klavans, Richard
Patek, Michael
Zoss, Angela M.
Biberstine, Joseph R.
Light, Robert P.
Lariviere, Vincent
Boyack, Kevin W.
TI Design and Update of a Classification System: The UCSD Map of Science
SO PLOS ONE
LA English
DT Article
ID TECHNOLOGY; IMPACT
AB Global maps of science can be used as a reference system to chart career
trajectories, the location of emerging research frontiers, or the expertise
profiles of institutes or nations. This paper details data preparation,
analysis, and layout performed when designing and subsequently updating the
UCSD map of science and classification system. The original classification
and map use 7.2 million papers and their references from Elsevier's Scopus
(about 15,000 source titles, 2001-2005) and Thomson Reuters' Web of Science
(WoS) Science, Social Science, Arts & Humanities Citation Indexes (about
9,000 source titles, 2001-2004)-about 16,000 unique source titles. The
updated map and classification adds six years (2005-2010) of WoS data and
three years (2006-2008) from Scopus to the existing category structure-
increasing the number of source titles to about 25,000. To our knowledge,
this is the first time that a widely used map of science was updated. A
comparison of the original 5-year and the new 10-year maps and classification
system show (i) an increase in the total number of journals that can be
mapped by 9,409 journals (social sciences had a 80% increase, humanities a
119% increase, medical (32%) and natural science (74%)), (ii) a simplification
40.
of the mapby assigning all but five highly interdisciplinary journals to
exactly one discipline, (iii) a more even distribution of journals over the
554 subdisciplines and 13 disciplines when calculating the coefficient of
variation, and (iv) a better reflection of journal clusters when compared
with paper-level citation data. When evaluating the map with a listing of
desirable features for maps of science, the updated map is shown to have
higher mapping accuracy, easier understandability as fewer journals are
multiply classified, and higher usability for the generation of data overlays,
among others.
C1 [Boerner, Katy; Zoss, Angela M.; Biberstine, Joseph R.; Light, Robert
P.; Lariviere, Vincent] Indiana Univ, Sch Lib & Informat Sci,
Cyberinfrastruct Network Sci Ctr, Bloomington, IN 47401 USA.
[Boerner, Katy] Royal Netherlands Acad Arts & Sci KNAW, Amsterdam,
Netherlands.
[Klavans, Richard; Patek, Michael] SciTech Strategies Inc, Berwyn, PA
USA.
[Lariviere, Vincent] Univ Montreal, Ecole Bibliothecon & Sci Informat,
Montreal, PQ, Canada.
[Lariviere, Vincent] Univ Quebec, CIRST, OST, Montreal, PQ H3C 3P8,
Canada.
[Boyack, Kevin W.] SciTech Strategies Inc, Albuquerque, NM USA.
RP Borner, K (reprint author), Indiana Univ, Sch Lib & Informat Sci,
Cyberinfrastruct Network Sci Ctr, Bloomington, IN 47401 USA.
EM katy@indiana.edu
OI Light, Robert/0000-0001-7067-5562; Boyack, Kevin/0000-0001-7814-8951
FU James S. McDonnell Foundation; National Science Foundation
[SBE-0738111]; National Institutes of Health [U24RR029822, U01GM098959];
University of California, San Diego (UCSD)
FX The generation of the 2010 UCSD map of science and classification system
is funded in part by the James S. McDonnell Foundation, the National
Science Foundation under award SBE-0738111, and the National Institutes
of Health under awards U24RR029822 and U01GM098959. Any opinions,
findings, and conclusions or recommendations expressed in this material
are those of the author(s) and do not necessarily reflect the views of
the National Science Foundation. The funders had no role in study
design, data collection and analysis, decision to publish, or
preparation of the manuscript.; The original 2005 UCSD map of science
was created by SciTech Strategies as part of a research contract funded
by the University of California, San Diego (UCSD). UCSD holds the
copyright for both the original classification system and the map, and
has given permission for them to be used in the instantiations mentioned
in this work. We would like to thank Andrea Scharnhorst for detailed
comments on an earlier version of this paper and Thomson Reuters and
Elsevier for their permission to publish the journal name conversion
41.
CSSS 科学计量与知识图谱系列
41
tables.
CR KoseckiS, 2011, SCIENTOMETRICS, V88, P707, DOI 10.1007/s11192-011-0359-
0
[Anonymous], SCI METRIX SCI J ONT
Lewison G, 1998, SCIENTOMETRICS, V41, P17, DOI 10.1007/BF02457963
Klavans R, 2009, J AM SOC INF SCI TEC, V60, P455, DOI 10.1002/asi.20991
Bourke P, 1999, RES POLICY, V28, P489, DOI 10.1016/S0048-7333(99)00009-8
Boyack KW, 2005, SCIENTOMETRICS, V64, P351, DOI 10.1007/s11192-005-0255-
6
Boyack KW, 2009, SCIENTOMETRICS, V79, P27, DOI 10.1007/s11192-009-0402-6
Boyack KW, 2009, SCIENTOMETRICS, V79, P45, DOI 10.1007/s11192-009-0403-5
Small H, 1999, J AM SOC INFORM SCI, V50, P799, DOI 10.1002/(SICI)1097-
4571(1999)50:9<799::AID-ASI9>3.3.CO;2-7
Boyack KW, 2003, J AM SOC INF SCI TEC, V54, P447, DOI 10.1002/asi.10230
Klavans R, 2010, SCIENTOMETRICS, V82, P539, DOI 10.1007/s11192-010-0188-
6
Klavans R, 2011, J AM SOC INF SCI TEC, V62, P1, DOI 10.1002/asi.21444
Lewison G, 1998, GUT, V43, P288
[Anonymous], MACE BROWS CLASS
Leydesdorff L, 2009, J AM SOC INF SCI TEC, V60, P348, DOI
10.1002/asi.20967
Boyack KW, 2002, J AM SOC INF SCI TEC, V53, P764, DOI 10.1002/asi.10066
Borner K, 2003, VISUAL INTERFACES DI
Borner K, 2010, SCI TOOL TOOL SCI SC
Borner K, 2003, ANNU REV INFORM SCI, P179
Borner Katy, 2010, ATLAS SCI VISUALIZIN
Boyack KW, 2011, PLOS ONE, V6, P1
Crane Diana, 1972, INVISIBLE COLL DIFFU
de Nooy W., 2011, EXPLORATORY SOCIAL N
Irvine J, 1984, FORESIGHT SCI PICKIN
Jain A, 1998, SCIENTOMETRICS, V41, P357, DOI 10.1007/BF02459051
Polanco X, 2001, SCIENTOMETRICS, V51, P267, DOI 10.1023/A:1010537316758
Scharnhorst A, 2012, UNDERST COMPLEX SYST, P1, DOI 10.1007/978-3-642-
23068-4
Schwechheimer H, 2001, SCIENTOMETRICS, V51, P311, DOI
10.1023/A:1010541418576
Schwechheimer H, 1999, SCIENTOMETRICS, V44, P547, DOI 10.1007/BF02458495
Shiffrin RM, 2004, PNAS S1, P5183
Shneiderman B., 1996, Proceedings. IEEE Symposium on Visual Languages
(Cat. No.96TB100066), DOI 10.1109/VL.1996.545307
Vargas-Quesada B., 2007, VISUALIZING STRUCTUR
VIVO, EN NAT SCI
NR 33
TC 19
42.
Z9 20
U1 5
U249
PU PUBLIC LIBRARY SCIENCE
PI SAN FRANCISCO
PA 1160 BATTERY STREET, STE 100, SAN FRANCISCO, CA 94111 USA
SN 1932-6203
J9 PLOS ONE
JI PLoS One
PD JUL 12
PY 2012
VL 7
IS 7
AR e39464
DI 10.1371/journal.pone.0039464
PG 10
WC Multidisciplinary Sciences
SC Science & Technology - Other Topics
GA 973NH
UT WOS:000306366400009
PM 22808037
ER
EF

![of the map by assigning all but five highly interdisciplinary journals to
exactly one discipline, (iii) a more even distribution of journals over the
554 subdisciplines and 13 disciplines when calculating the coefficient of
variation, and (iv) a better reflection of journal clusters when compared
with paper-level citation data. When evaluating the map with a listing of
desirable features for maps of science, the updated map is shown to have
higher mapping accuracy, easier understandability as fewer journals are
multiply classified, and higher usability for the generation of data overlays,
among others.
C1 [Boerner, Katy; Zoss, Angela M.; Biberstine, Joseph R.; Light, Robert
P.; Lariviere, Vincent] Indiana Univ, Sch Lib & Informat Sci,
Cyberinfrastruct Network Sci Ctr, Bloomington, IN 47401 USA.
[Boerner, Katy] Royal Netherlands Acad Arts & Sci KNAW, Amsterdam,
Netherlands.
[Klavans, Richard; Patek, Michael] SciTech Strategies Inc, Berwyn, PA
USA.
[Lariviere, Vincent] Univ Montreal, Ecole Bibliothecon & Sci Informat,
Montreal, PQ, Canada.
[Lariviere, Vincent] Univ Quebec, CIRST, OST, Montreal, PQ H3C 3P8,
Canada.
[Boyack, Kevin W.] SciTech Strategies Inc, Albuquerque, NM USA.
RP Borner, K (reprint author), Indiana Univ, Sch Lib & Informat Sci,
Cyberinfrastruct Network Sci Ctr, Bloomington, IN 47401 USA.
EM katy@indiana.edu
OI Light, Robert/0000-0001-7067-5562; Boyack, Kevin/0000-0001-7814-8951
FU James S. McDonnell Foundation; National Science Foundation
[SBE-0738111]; National Institutes of Health [U24RR029822, U01GM098959];
University of California, San Diego (UCSD)
FX The generation of the 2010 UCSD map of science and classification system
is funded in part by the James S. McDonnell Foundation, the National
Science Foundation under award SBE-0738111, and the National Institutes
of Health under awards U24RR029822 and U01GM098959. Any opinions,
findings, and conclusions or recommendations expressed in this material
are those of the author(s) and do not necessarily reflect the views of
the National Science Foundation. The funders had no role in study
design, data collection and analysis, decision to publish, or
preparation of the manuscript.; The original 2005 UCSD map of science
was created by SciTech Strategies as part of a research contract funded
by the University of California, San Diego (UCSD). UCSD holds the
copyright for both the original classification system and the map, and
has given permission for them to be used in the instantiations mentioned
in this work. We would like to thank Andrea Scharnhorst for detailed
comments on an earlier version of this paper and Thomson Reuters and
Elsevier for their permission to publish the journal name conversion](https://image.slidesharecdn.com/sci2-170721021912/85/Sci2-40-320.jpg)
![CSSS 科学计量与知识图谱系列
41
tables.
CR Kosecki S, 2011, SCIENTOMETRICS, V88, P707, DOI 10.1007/s11192-011-0359-
0
[Anonymous], SCI METRIX SCI J ONT
Lewison G, 1998, SCIENTOMETRICS, V41, P17, DOI 10.1007/BF02457963
Klavans R, 2009, J AM SOC INF SCI TEC, V60, P455, DOI 10.1002/asi.20991
Bourke P, 1999, RES POLICY, V28, P489, DOI 10.1016/S0048-7333(99)00009-8
Boyack KW, 2005, SCIENTOMETRICS, V64, P351, DOI 10.1007/s11192-005-0255-
6
Boyack KW, 2009, SCIENTOMETRICS, V79, P27, DOI 10.1007/s11192-009-0402-6
Boyack KW, 2009, SCIENTOMETRICS, V79, P45, DOI 10.1007/s11192-009-0403-5
Small H, 1999, J AM SOC INFORM SCI, V50, P799, DOI 10.1002/(SICI)1097-
4571(1999)50:9<799::AID-ASI9>3.3.CO;2-7
Boyack KW, 2003, J AM SOC INF SCI TEC, V54, P447, DOI 10.1002/asi.10230
Klavans R, 2010, SCIENTOMETRICS, V82, P539, DOI 10.1007/s11192-010-0188-
6
Klavans R, 2011, J AM SOC INF SCI TEC, V62, P1, DOI 10.1002/asi.21444
Lewison G, 1998, GUT, V43, P288
[Anonymous], MACE BROWS CLASS
Leydesdorff L, 2009, J AM SOC INF SCI TEC, V60, P348, DOI
10.1002/asi.20967
Boyack KW, 2002, J AM SOC INF SCI TEC, V53, P764, DOI 10.1002/asi.10066
Borner K, 2003, VISUAL INTERFACES DI
Borner K, 2010, SCI TOOL TOOL SCI SC
Borner K, 2003, ANNU REV INFORM SCI, P179
Borner Katy, 2010, ATLAS SCI VISUALIZIN
Boyack KW, 2011, PLOS ONE, V6, P1
Crane Diana, 1972, INVISIBLE COLL DIFFU
de Nooy W., 2011, EXPLORATORY SOCIAL N
Irvine J, 1984, FORESIGHT SCI PICKIN
Jain A, 1998, SCIENTOMETRICS, V41, P357, DOI 10.1007/BF02459051
Polanco X, 2001, SCIENTOMETRICS, V51, P267, DOI 10.1023/A:1010537316758
Scharnhorst A, 2012, UNDERST COMPLEX SYST, P1, DOI 10.1007/978-3-642-
23068-4
Schwechheimer H, 2001, SCIENTOMETRICS, V51, P311, DOI
10.1023/A:1010541418576
Schwechheimer H, 1999, SCIENTOMETRICS, V44, P547, DOI 10.1007/BF02458495
Shiffrin RM, 2004, PNAS S1, P5183
Shneiderman B., 1996, Proceedings. IEEE Symposium on Visual Languages
(Cat. No.96TB100066), DOI 10.1109/VL.1996.545307
Vargas-Quesada B., 2007, VISUALIZING STRUCTUR
VIVO, EN NAT SCI
NR 33
TC 19](https://image.slidesharecdn.com/sci2-170721021912/85/Sci2-41-320.jpg)