Download to read offline
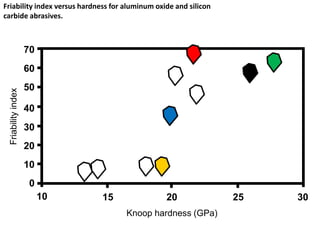
This document shows a graph comparing the friability index and hardness of two abrasive materials, aluminum oxide and silicon carbide. The y-axis represents friability index and the x-axis represents Knoop hardness measured in GigaPascals (GPa). Data points are plotted showing the friability index and hardness values for both aluminum oxide and silicon carbide abrasives.


