Downloaded 3,589 times


![References
Bu.edu, 'Why Study Statistics » Statistics » Boston University', 2014. [Online]. Available:
http://www.bu.edu/stat/undergraduate-program-information/why-study-statistics/. [Accessed: 23- Oct-
2014].
Understanding Descriptive and Inferential Statistics. 2014. Understanding Descriptive and Inferential Statistics.
[ONLINE] Available at:https://statistics.laerd.com/statistical-guides/descriptive-inferential-statistics.php.
[Accessed 27 October 2014].
Kent, J 2013, ' Why Statistics Is Important To A Research?', Viewed 24 October 2014,
http://education.blurtit.com/335945/why-statistics-is-important-to-a-research
Journalists Resources 2014, 'Statistical terms used in research studies', Viewed 24 October 2014,
http://journalistsresource.org/skills/research/statistics-for-journalists#
Theanalysisfactor.com, 'Factor Analysis: A Short Introduction, Part 1', 2014. [Online]. Available:
http://www.theanalysisfactor.com/factor-analysis-1-introduction/. [Accessed: 25- Oct- 2014].
Stattrek.com, 'Regression Example', 2014. [Online]. Available: http://stattrek.com/regression/regression-example.
aspx. [Accessed: 26- Oct- 2014].
Ats.ucla.edu, (2014). What statistical analysis should I use? Statistical analyses using Stata. [online] Available
at: http://www.ats.ucla.edu/stat/stata/whatstat/whatstat.htm [Accessed 26 Oct. 2014].](https://image.slidesharecdn.com/roleofstatisticsinscientificresearch-141105204535-conversion-gate02/75/Role-of-Statistics-in-Scientific-Research-26-2048.jpg)


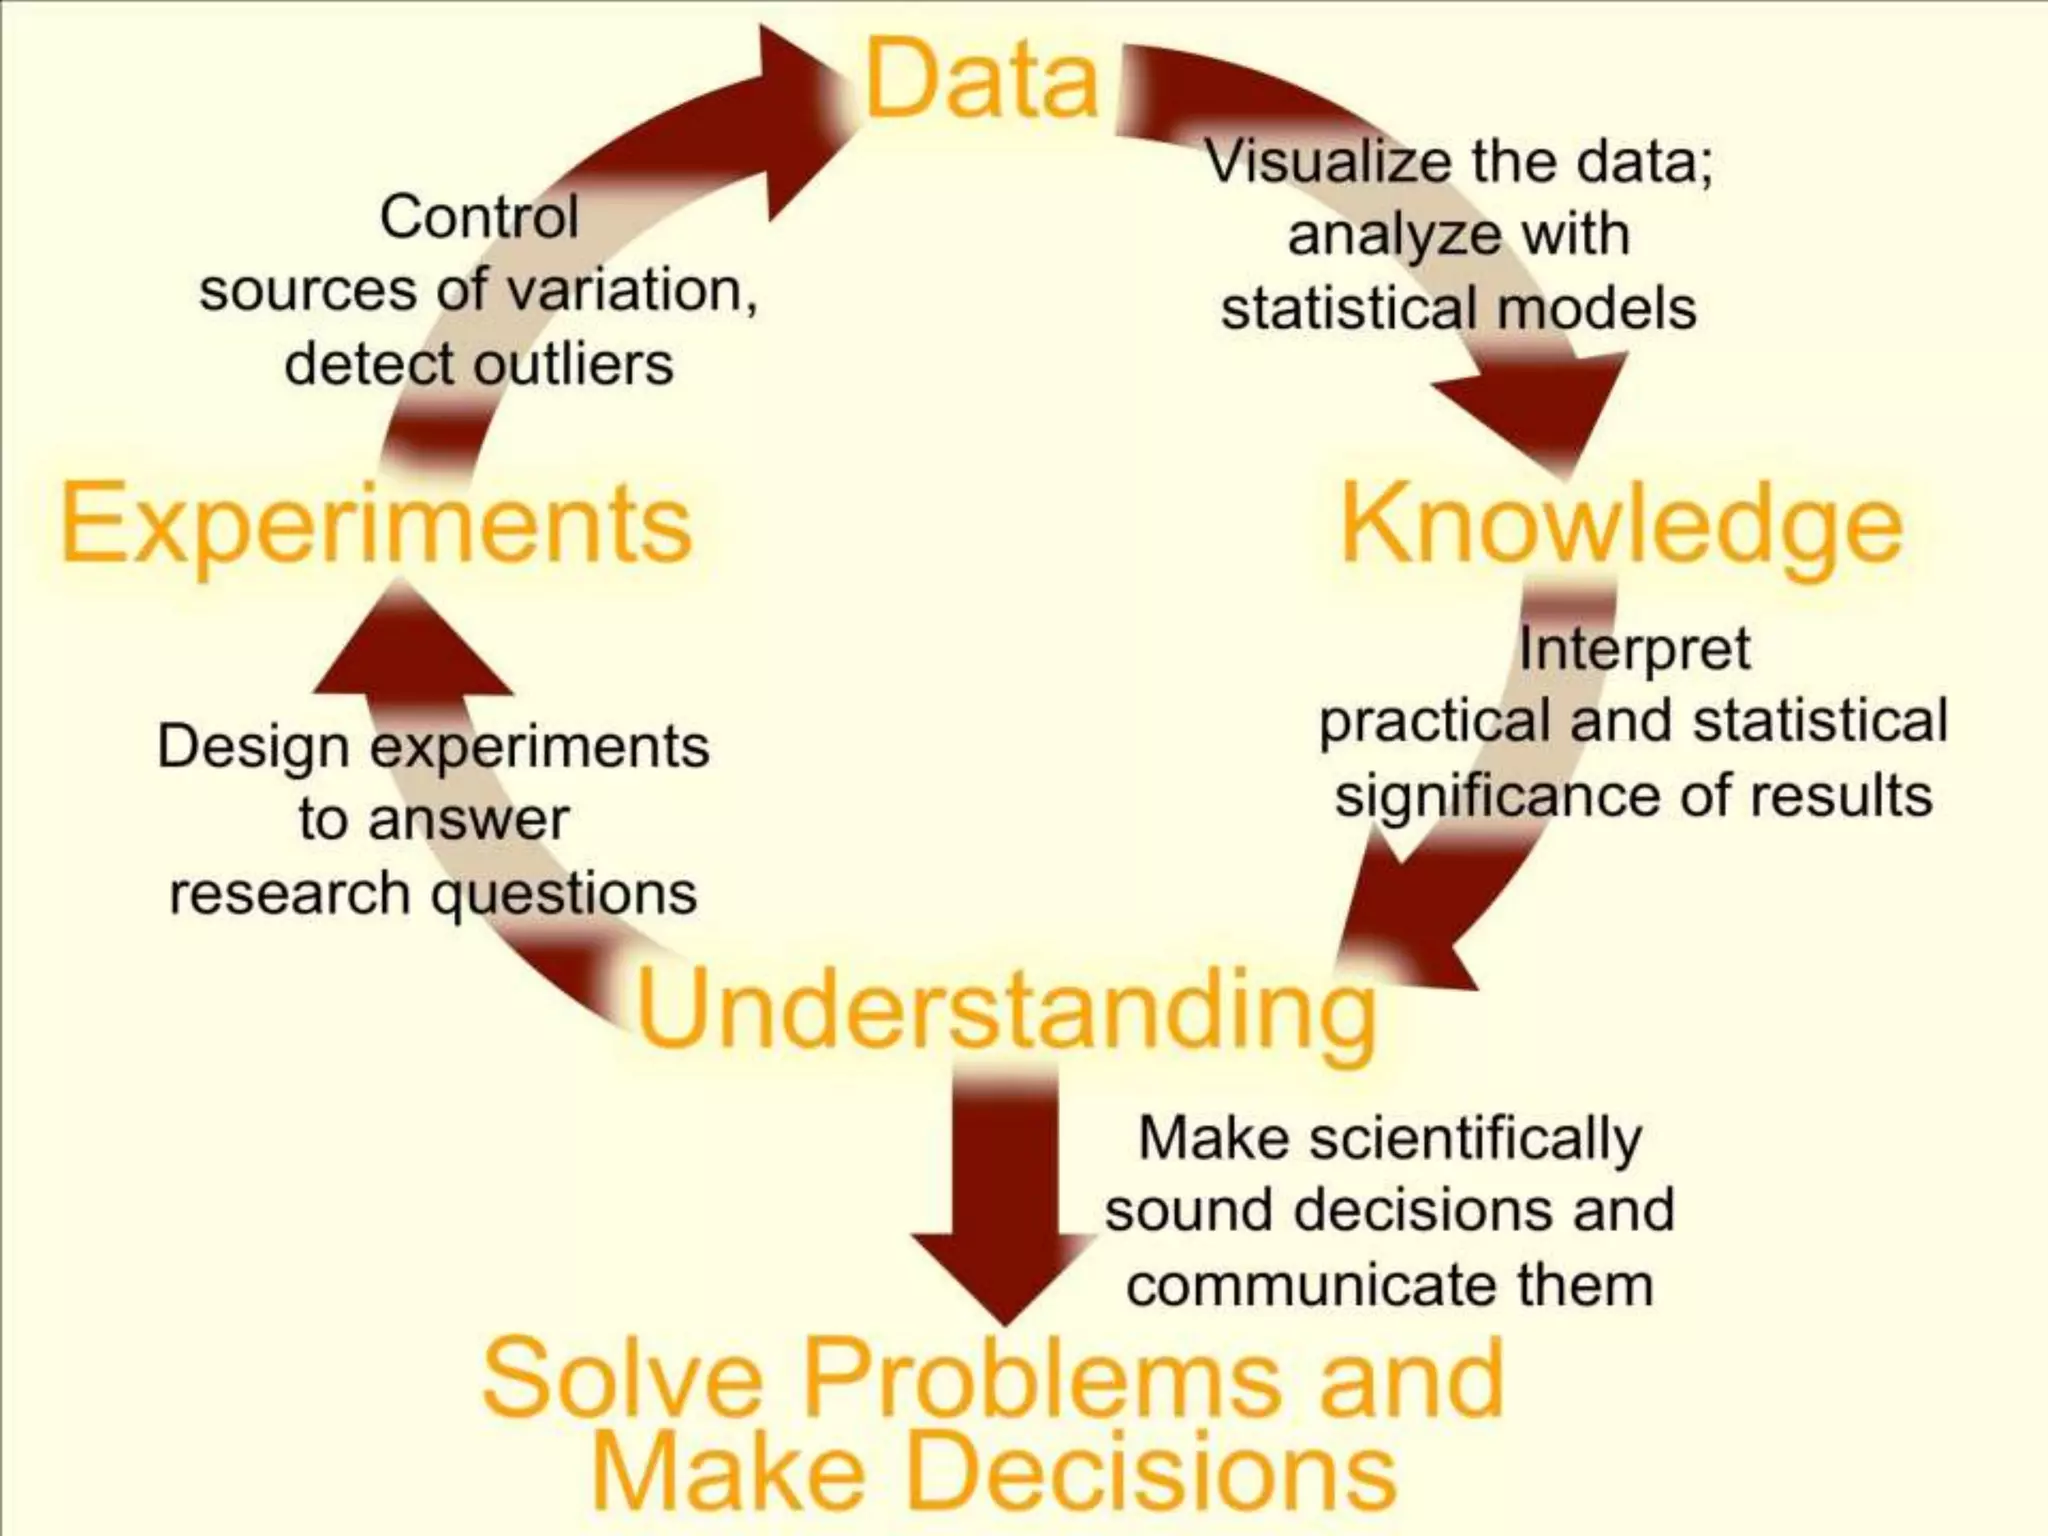
This document discusses the role and importance of statistics in scientific research. It begins by defining statistics as the science of learning from data and communicating uncertainty. Statistics are important for summarizing, analyzing, and drawing inferences from data in research studies. They also allow researchers to effectively present their findings and support their conclusions. The document then describes how statistics are used and are important in many fields of scientific research like biology, economics, physics, and more. It also provides examples of statistical terms commonly used in research studies and some common misuses of statistics.