Download to read offline


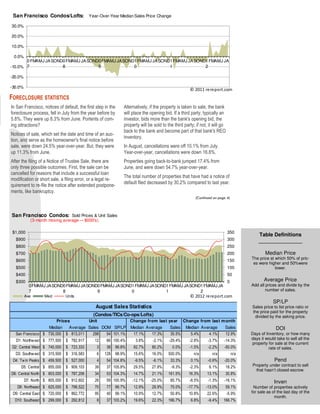

The document provides an analysis of real estate market trends in San Francisco for September/October 2012. It discusses slowing home sales growth and rising prices due to low inventory levels. It also examines mortgage rates, construction spending, and foreclosure statistics. Key points include: - Home sales rose 12.3% in August but were down 14.2% year-over-year due to lack of inventory. Median home prices increased 29.1% year-over-year. - Condo sales rose 35.5% from the previous June. Median condo prices increased 17.3% year-over-year. - Mortgage rates retreated in recent weeks but construction spending declined in July, pausing growth.


