The document discusses the critical issues surrounding poor data quality, including its financial impacts on organizations and the common causes of inconsistencies, such as human error and weak enforcement of constraints. It highlights the importance of integrity constraints in maintaining data accuracy and outlines steps for data cleaning. Additionally, it includes anecdotes on various data quality failures and offers advice on data presentation and project planning for improving data management.
![1/18/18
1
DATA CLEANING & DATA
QUALITY
Admin
¨ Sign-up for presentations
¤ Volunteers for next week
¨ Projects
¤ Finalize project topics by end of the month
2
Poor Data Quality
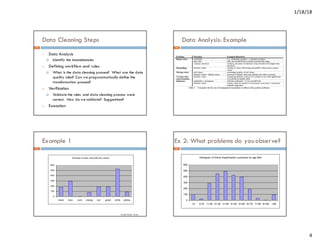
Poor data quality is a serious problem for organizations
¤ Incorrect decision making
q “multiple versions of the truth”, lack of user confidence in data
¤ Operational inefficiencies and mistakes
q Major Canadian bankfaxed sensitive customerdata to US junk yard
(incorrect extra digit in fax number)
¤ Waste of time and money [Gartner Research Report]
q Organizations are each losing an average of $8.2M annually
q More than 25% of critical data in Fortune 1000 companies will
continue to be inaccurate andincomplete
3
Examples
Class EDUC MR OCC REL SAL
private Bachelor Married Exec Husband >50k
private Bachelor Married Prof Husband >50k
self-emp Masters Married Exec Wife >50k
? HS Divorced ? Not-fam <50k
self-emp Masters Married Admin Wife <50k
nev-work Primary Single ? child >50k
? Bachelor Divorced ? Not-fam >50k
Sample fromUS Census
City # Beds # Baths Monthly Rent
Toronto, ON 1 1 $1000
Toronto, ON 1 1 $900
Toronto 1 1 $380
Toronto, Ohio, USA?
About: IBM
An Entity of Type : Public company
LocationCity: United States
Armonk, New York
NumberOfEmployees: 426751
DateOfDeath: 1956
4
4](https://image.slidesharecdn.com/datacleaning-240906174544-bd25e18e/85/Remediating-Data-Quality-by-using-Data-cleaning-1-320.jpg)
![1/18/18
1
DATA CLEANING & DATA
QUALITY
Admin
¨ Sign-up for presentations
¤ Volunteers for next week
¨ Projects
¤ Finalize project topics by end of the month
2
Poor Data Quality
Poor data quality is a serious problem for organizations
¤ Incorrect decision making
q “multiple versions of the truth”, lack of user confidence in data
¤ Operational inefficiencies and mistakes
q Major Canadian bankfaxed sensitive customerdata to US junk yard
(incorrect extra digit in fax number)
¤ Waste of time and money [Gartner Research Report]
q Organizations are each losing an average of $8.2M annually
q More than 25% of critical data in Fortune 1000 companies will
continue to be inaccurate andincomplete
3
Examples
Class EDUC MR OCC REL SAL
private Bachelor Married Exec Husband >50k
private Bachelor Married Prof Husband >50k
self-emp Masters Married Exec Wife >50k
? HS Divorced ? Not-fam <50k
self-emp Masters Married Admin Wife <50k
nev-work Primary Single ? child >50k
? Bachelor Divorced ? Not-fam >50k
Sample fromUS Census
City # Beds # Baths Monthly Rent
Toronto, ON 1 1 $1000
Toronto, ON 1 1 $900
Toronto 1 1 $380
Toronto, Ohio, USA?
About: IBM
An Entity of Type : Public company
LocationCity: United States
Armonk, New York
NumberOfEmployees: 426751
DateOfDeath: 1956
4
4](https://image.slidesharecdn.com/datacleaning-240906174544-bd25e18e/75/Remediating-Data-Quality-by-using-Data-cleaning-1-2048.jpg)
![1/18/18
2
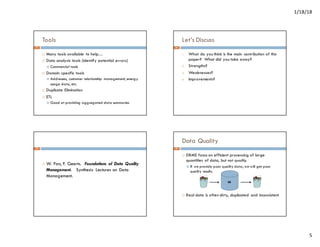
Causes of Inconsistencies
¨ Human Error
¨ Weak enforcement of constraints (or lack of constraints)
¨ Results of data integration or information extraction
¨ Violation of constraints due to errors or schema/data evolution
C1: [Salary < $100k] à [rate = 5%]
C2: [Salary > $100k] à [rate = 3%]
ClientID Name NetWorth Salary OtherProducts Amt Rate
225 Jane Walters $300k $85k $15k $150k 5%
420 Tracy Smith $800k $150k $90k $350k 3%
333 Jen Wright $100k $65k $0 $200k 5%
128 Ron Maples $235k $70k $45k $200k 4%
5
Objective
¨ Integrity constraints are the primary means for preserving data
integrity
¨ Use constraints as the benchmark for defining conditions the data
should satisfy
¨ Constraints may be stale, or better constraints may be available
to meet the application needs
Leverage the power of constraints to improve data quality.
6
F
|
I
and
[Y],
t
[Y]
t
then
[X]
t
[X]
t
if
I,
t
,
t
2
1
2
1
2
1
=
=
=
F1: [Income] à [Privileges]
New Semantic Constraints
ClientID Income Privileges Country Amt Status
225 Low None USA $150k Approved
420 High Full USA $350k Approved
333 Middle Limited USA $200k Approved
128 Middle Limited USA $200k Approved
193 Middle Limited UK $0 Pending
550 Low None UK $0 Pending
243 High Full UK $200k Incomplete
376 High Full UK $175k Approved
Functional Dependency (FD) F: X à Y
F2: [Amt] à [Status]
Conditional Functional Dependencies (CFD)
[Maher97,Bohannon+
07]
[Country = ‘USA’, Amt] à [Status]
7
[Status = ‘Pending’] à [Amt = $0]
7
Data and Constraint Repair
ClientID Income OtherProd Rate Country City State
225 High A 2.1% USA San Francisco MD
420 High A 2.1% USA San Francisco CA
333 High B 3.0% USA San Francisco CA
576 High B 3.0% USA San Francisco CA
128 Low C 4.5% UK Reading Berkshire
193 Low C 4.5% UK London London
550 Low B 3.5% UK London London
F1: [Income ] à [Rate]
∧
F2: [Country, City] à [State]
1) Repair the data or the constraints?
2) How to find the repairs?
8](https://image.slidesharecdn.com/datacleaning-240906174544-bd25e18e/85/Remediating-Data-Quality-by-using-Data-cleaning-2-320.jpg)
![1/18/18
7
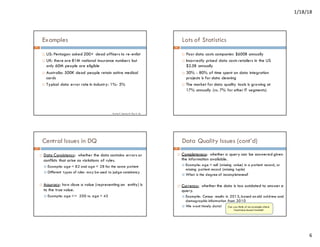
Data Quality Issues (cont’d)
¨ Deduplication: whether two records refer to the
same entity
¤ Example: If Jane Smith and Joan Smith have the same
email address, are they referring to the same person?
25
Improving DQ with Constraints
¨ Need constraints to help improve DQ, how:
¨ Types of errors:
¤ Syntactic : values do not conform to type, length, domain
range [easier to identify]
¤ Semantic: data values deviate from the true values of the
entity they represent [harder]
¨ Constraints model the intended application semantics
¤ Many different types of constraints exist
¤ Identify patterns, similarity, containment of tuples,
timeliness of data
26
Constraint Considerations
¨ Discovering data quality rules
¨ Identifying errors
¨ Repairing the data (or the constraints)
27
Interactions BetweenDQ Issues
¨ These issues clearly do not occur in isolation!
¨ Let’s consider a case study…
28](https://image.slidesharecdn.com/datacleaning-240906174544-bd25e18e/85/Remediating-Data-Quality-by-using-Data-cleaning-7-320.jpg)