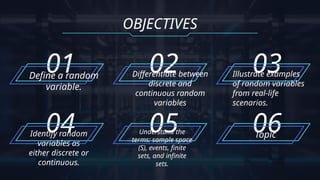
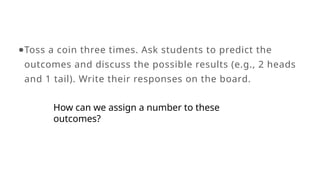
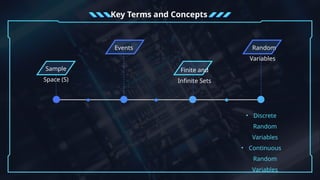
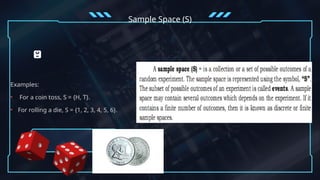
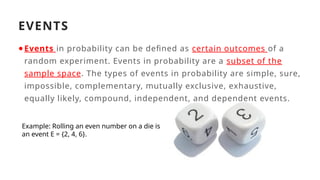
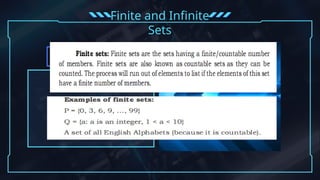
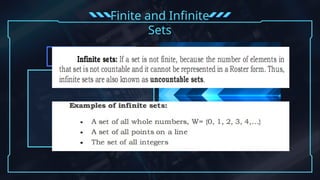
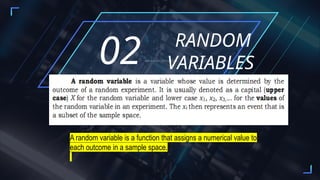
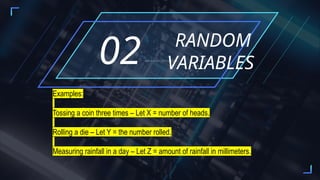
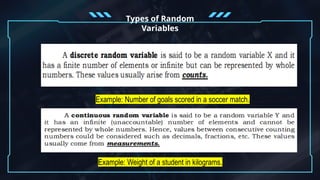
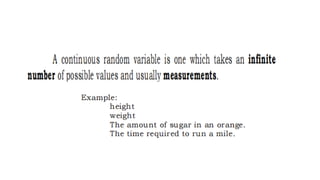
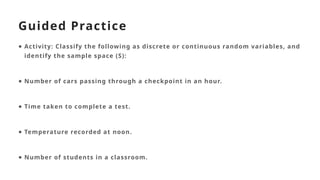
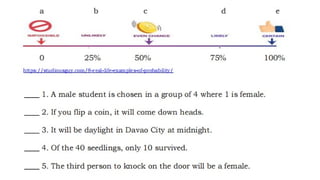
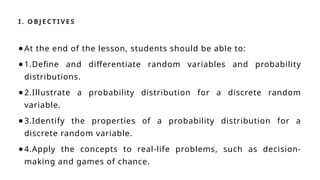
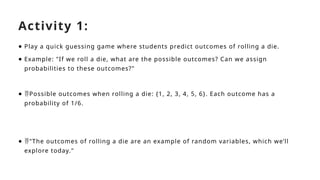
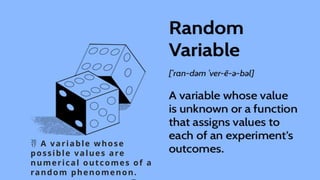
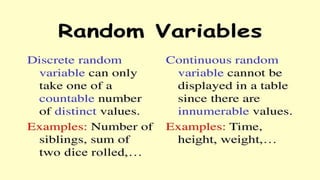
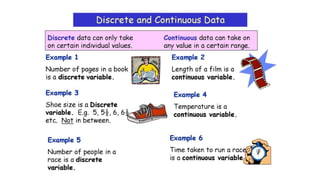
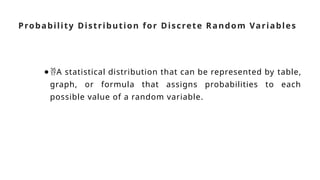
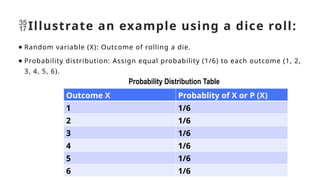
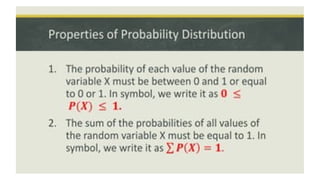
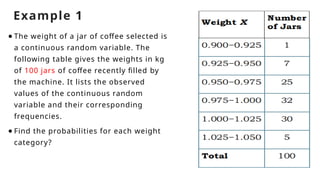
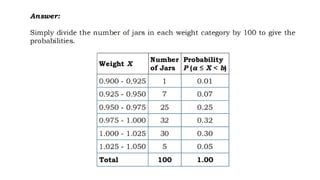
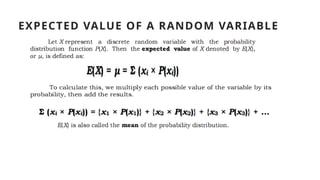
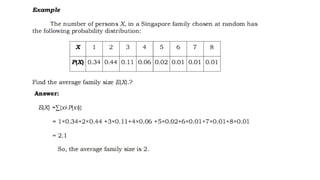
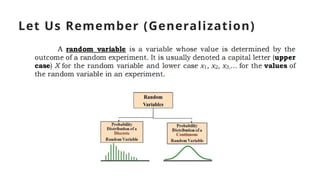
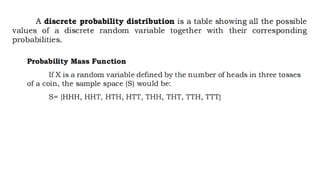
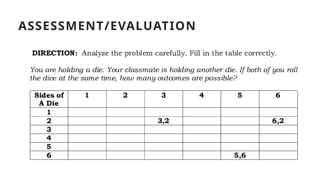
Statistics and
Probability
Random Variables
Sir Julius
YOUR LOGO
SCIENCE
01
Define a random
variable.
OBJECTIVES
02
Differentiate between
discrete and
continuous random
variables
03
Illustrate examples
of random variables
from real-life
scenarios.
04
Identify random
variables as
either discrete or
continuous.
05
Understand the
terms: sample space
(S), events, finite
sets, and infinite
sets.
06
Topic
ACTIVITY 1
01ADD A SHORT DESCRIPTION
●Toss a coin three times. Ask students to predict the
outcomes and discuss the possible results (e.g., 2 heads
and 1 tail). Write their responses on the board.
How can we assign a number to these
outcomes?
Key Terms and Concepts
Random
Variables
• Discrete
Random
Variables
• Continuous
Random
Variables
Sample
Space (S)
Events
Finite and
Infinite Sets
Examples:
• For a coin toss, S = {H, T}.
• For rolling a die, S = {1, 2, 3, 4, 5, 6}.
Sample Space (S)
EVENTS
●Events in probability can be defined as certain outcomes of a
random experiment. Events in probability are a subset of the
sample space. The types of events in probability are simple, sure,
impossible, complementary, mutually exclusive, exhaustive,
equally likely, compound, independent, and dependent events.
Example: Rolling an even number on a die is
an event E = {2, 4, 6}.
Finite and Infinite
Sets
Finite and Infinite
Sets
RANDOM
VARIABLES
02ADD A SHORT DESCRIPTION
RANDOM
VARIABLES
02ADD A SHORT DESCRIPTION
A random variable is a function that assigns a numerical value to
each outcome in a sample space.
RANDOM
VARIABLES
02ADD A SHORT DESCRIPTION
Examples:
Tossing a coin three times – Let X = number of heads.
Rolling a die – Let Y = the number rolled.
Measuring rainfall in a day – Let Z = amount of rainfall in millimeters.
Types of Random
Variables
Example: Number of goals scored in a soccer match.
Example: Weight of a student in kilograms.
Guided Practice
● Activity: Classify the following as discrete or continuous random variables, and
identify the sample space (S):
● Number of cars passing through a checkpoint in an hour.
● Time taken to complete a test.
● Temperature recorded at noon.
● Number of students in a classroom.
Rev iew: Re c a p t he prev ious le ss on o n ba s ic proba bilit y c o nc e pt s
a nd c onnec t it t o t he da y ’s t o pic .
I. OBJ E CT IVE S
●At the end of the lesson, students should be able to:
●1.Define and differentiate random variables and probability
distributions.
●2.Illustrate a probability distribution for a discrete random
variable.
●3.Identify the properties of a probability distribution for a
discrete random variable.
●4.Apply the concepts to real-life problems, such as decision-
making and games of chance.
Activity 1:
● Play a quick guessing game where students predict outcomes of rolling a die.
● Example: "If we roll a die, what are the possible outcomes? Can we assign
probabilities to these outcomes?"
● Possible outcomes when rolling a die: {1, 2, 3, 4, 5, 6}. Each outcome has a
probability of 1/6.
● "The outcomes of rolling a die are an example of random variables, which we’ll
explore today."
 A variable whose
possible values are
numerical outcomes of a
random phenomenon.
Probability Distribution for Discrete Random Variables
●A statistical distribution that can be represented by table,
graph, or formula that assigns probabilities to each
possible value of a random variable.
Illustrate an example using a dice roll:
● Random variable (X): Outcome of rolling a die.
● Probability distribution: Assign equal probability (1/6) to each outcome (1, 2,
3, 4, 5, 6).
Probability Distribution Table
Outcome X Probablity of X or P (X)
1 1/6
2 1/6
3 1/6
4 1/6
5 1/6
6 1/6
Application to Real-Life Problems
PROBABILITIES AS RELATIVE FREQUENCY
●In an experiment or survey, relative frequency of an event is the
number of times the event occurs divided by the total number of
trials. For instance, if you observed 100 passing cars and found
that 23 of them were red, the relative frequency would be
23/100.
Example 1
● The weight of a jar of coffee selected is
a continuous random variable. The
following table gives the weights in kg
of 100 jars of coffee recently filled by
the machine. It lists the observed
values of the continuous random
variable and their corresponding
frequencies.
● Find the probabilities for each weight
category?
EXPECTED VALUE OF A RANDOM VARIABLE
Let Us Remember (Generalization)
ASSESSMENT/EVALUATION
ASSIGNMENT
●Research a real-life problem that involves a random variable
(e.g., lottery, weather prediction). Identify the random variable
and construct a probability distribution table. Prepare to present
your findings in the next class. (20 Points)

Random-Variables.pptx grade 11 topic shs

  • 1.
  • 2.
    01 Define a random variable. OBJECTIVES 02 Differentiatebetween discrete and continuous random variables 03 Illustrate examples of random variables from real-life scenarios. 04 Identify random variables as either discrete or continuous. 05 Understand the terms: sample space (S), events, finite sets, and infinite sets. 06 Topic
  • 3.
    ACTIVITY 1 01ADD ASHORT DESCRIPTION
  • 4.
    ●Toss a cointhree times. Ask students to predict the outcomes and discuss the possible results (e.g., 2 heads and 1 tail). Write their responses on the board. How can we assign a number to these outcomes?
  • 5.
    Key Terms andConcepts Random Variables • Discrete Random Variables • Continuous Random Variables Sample Space (S) Events Finite and Infinite Sets
  • 6.
    Examples: • For acoin toss, S = {H, T}. • For rolling a die, S = {1, 2, 3, 4, 5, 6}. Sample Space (S)
  • 7.
    EVENTS ●Events in probabilitycan be defined as certain outcomes of a random experiment. Events in probability are a subset of the sample space. The types of events in probability are simple, sure, impossible, complementary, mutually exclusive, exhaustive, equally likely, compound, independent, and dependent events. Example: Rolling an even number on a die is an event E = {2, 4, 6}.
  • 8.
  • 9.
  • 10.
  • 11.
    RANDOM VARIABLES 02ADD A SHORTDESCRIPTION A random variable is a function that assigns a numerical value to each outcome in a sample space.
  • 12.
    RANDOM VARIABLES 02ADD A SHORTDESCRIPTION Examples: Tossing a coin three times – Let X = number of heads. Rolling a die – Let Y = the number rolled. Measuring rainfall in a day – Let Z = amount of rainfall in millimeters.
  • 13.
    Types of Random Variables Example:Number of goals scored in a soccer match. Example: Weight of a student in kilograms.
  • 15.
    Guided Practice ● Activity:Classify the following as discrete or continuous random variables, and identify the sample space (S): ● Number of cars passing through a checkpoint in an hour. ● Time taken to complete a test. ● Temperature recorded at noon. ● Number of students in a classroom.
  • 18.
    Rev iew: Rec a p t he prev ious le ss on o n ba s ic proba bilit y c o nc e pt s a nd c onnec t it t o t he da y ’s t o pic .
  • 19.
    I. OBJ ECT IVE S ●At the end of the lesson, students should be able to: ●1.Define and differentiate random variables and probability distributions. ●2.Illustrate a probability distribution for a discrete random variable. ●3.Identify the properties of a probability distribution for a discrete random variable. ●4.Apply the concepts to real-life problems, such as decision- making and games of chance.
  • 20.
    Activity 1: ● Playa quick guessing game where students predict outcomes of rolling a die. ● Example: "If we roll a die, what are the possible outcomes? Can we assign probabilities to these outcomes?" ● Possible outcomes when rolling a die: {1, 2, 3, 4, 5, 6}. Each outcome has a probability of 1/6. ● "The outcomes of rolling a die are an example of random variables, which we’ll explore today."
  • 21.
     A variablewhose possible values are numerical outcomes of a random phenomenon.
  • 24.
    Probability Distribution forDiscrete Random Variables ●A statistical distribution that can be represented by table, graph, or formula that assigns probabilities to each possible value of a random variable.
  • 25.
    Illustrate an exampleusing a dice roll: ● Random variable (X): Outcome of rolling a die. ● Probability distribution: Assign equal probability (1/6) to each outcome (1, 2, 3, 4, 5, 6). Probability Distribution Table Outcome X Probablity of X or P (X) 1 1/6 2 1/6 3 1/6 4 1/6 5 1/6 6 1/6
  • 27.
    Application to Real-LifeProblems PROBABILITIES AS RELATIVE FREQUENCY ●In an experiment or survey, relative frequency of an event is the number of times the event occurs divided by the total number of trials. For instance, if you observed 100 passing cars and found that 23 of them were red, the relative frequency would be 23/100.
  • 28.
    Example 1 ● Theweight of a jar of coffee selected is a continuous random variable. The following table gives the weights in kg of 100 jars of coffee recently filled by the machine. It lists the observed values of the continuous random variable and their corresponding frequencies. ● Find the probabilities for each weight category?
  • 30.
    EXPECTED VALUE OFA RANDOM VARIABLE
  • 32.
    Let Us Remember(Generalization)
  • 34.
  • 35.
    ASSIGNMENT ●Research a real-lifeproblem that involves a random variable (e.g., lottery, weather prediction). Identify the random variable and construct a probability distribution table. Prepare to present your findings in the next class. (20 Points)