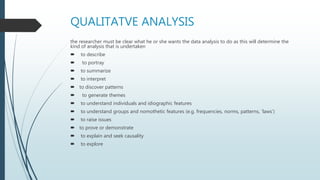
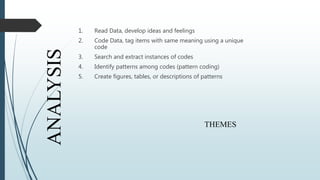
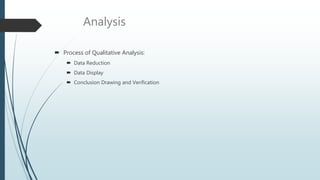
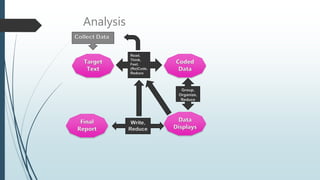
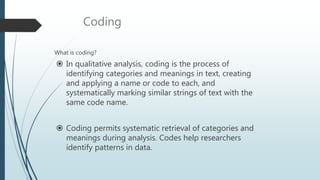
QUALITATIVE DATA
ANALYSIS
QUALITATIVE DATA
Qualitative data analysis involves organizing,
accounting for and explaining the data; in
short, making sense of data in terms of the
participants’ definitions of the situation, noting
patterns, themes, categories and regularities.
QUALITATIVE DATA
 There is no one single or correct way to analyse and present qualitative data; how
one does it should abide by the issue of fitness for purpose. Further, qualitative
data analysis, is often heavy on interpretation, and one has to note that there are
frequently multiple interpretations to be made of qualitative data – that is their
glory and their headache! In abiding by the principle of fitness for purpose,
QUALITATVE ANALYSIS
the researcher must be clear what he or she wants the data analysis to do as this will determine the
kind of analysis that is undertaken
 to describe
 to portray
 to summarize
 to interpret
 to discover patterns
 to generate themes
 to understand individuals and idiographic features
 to understand groups and nomothetic features (e.g. frequencies, norms, patterns, ‘laws’)
 to raise issues
 to prove or demonstrate
 to explain and seek causality
 to explore
 The significance of deciding the purpose is that it will determine the kind of
analysis performed on the data. This, in turn, will influence the way in which the
analysis is written up. The data analysis will also be influenced by the kind of
qualitative study that is being undertaken.
 For example, a biography and a case study may be most suitably written as
descriptive narrative, often chronologically, with issues raised throughout. An
ethnography may be written as narrative or stories, with issues raised, but not
necessarily conforming to a chronology of events, and including description,
analysis, interpretation and explanation of the key features of a group or culture. A
grounded theory and content analysis will proceed through a systematic series of
analyses, including coding and categorization, until theory emerges that explains
the phenomena being studied or which can be used for predictive purposes.
QUALITATIVE DATA
 The analysis will also be influenced by the number of data sets and people
from whom data have been collected. Qualitative data often focus on
smaller numbers of people than quantitative data, yet the data tend to be
detailed and rich. Researchers will need to decide, for example, whether to
present data individual by individual, and then, if desired, to amalgamate
key issues emerging across the individuals, or whether to proceed by
working within a largely predetermined analytical frame of issues that
crosses the individuals concerned qualitative studies deliberately focus on
individuals and the responses of significant players in a particular scenario,
often quoting verbatim responses in the final account; others are content to
summarize issues without necessarily identifying exactly from whom the
specific data were derived. Later on here we discuss methods to be used
with respect to people and issues
Qualitative analysis
 Some studies include a lot of verbatim conversations; others
use fewer verbatim data. Some researchers feel that it is
important to keep the flavour of the original data, so they
report direct phrases and sentences, not only because they
are often more illuminative and direct than the researchers’
own words, but also because they feel that it is important to
be faithful to the exact words used.
Qualitative data
 At a practical level, qualitative research rapidly amasses huge amounts of data, and
early analysis reduces the problem of data overload by selecting out significant
features for future focus.
 careful data display is an important element of data reduction and selection.
‘Progressive focusing’ starts with the researcher taking a wide angle lens to gather
data, and then, by sifting, sorting, reviewing and reflecting on them, the salient
features of the situation emerge. These are then used as the agenda for
subsequent focusing.
Tabulating data
ways of organizing and presenting data analysis
 The methods are by people, and by issue, and the final method is by instrument.
Data
Text is generally collected from or in the form of…
 Field notes -- Newspaper or magazine stories
 Interviews (recorded and transcribed)
 Focus groups -- Web pages
 Audio & video tapes (transcribed and described)
 Copies of documents -- Photographs (described)
 Narrative descriptions
 Diaries
1. Read Data, develop ideas and feelings
2. Code Data, tag items with same meaning using a unique
code
3. Search and extract instances of codes
4. Identify patterns among codes (pattern coding)
5. Create figures, tables, or descriptions of patterns
ANALYSIS
THEMES
Analysis
 Process of Qualitative Analysis:
 Data Reduction
 Data Display
 Conclusion Drawing and Verification
Analysis
Coding
Coding
What is coding?
 In qualitative analysis, coding is the process of
identifying categories and meanings in text, creating
and applying a name or code to each, and
systematically marking similar strings of text with the
same code name.
 Coding permits systematic retrieval of categories and
meanings during analysis. Codes help researchers
identify patterns in data.
Coding
 One codes only relevant data (Not all text must be
coded to complete the project)
 Codes may be based on:
Actions, Behaviors,Topics, Ideas, Concepts,
Terms, Phrases, Keywords, and so forth
 Coding is purposeful interpretation, with mindful
reflection on the meanings of the persons, context,
interactions, statements, assumptions, and so forth
Coding
Source: http://onlineqda.hud.ac.uk/Intro_QDA/phpechopage_titleOnlineQDA-Examples_QDA.php
An example of
“old school”
coding
Coding
Sources of codes (typically both):
1.A priori codes—expected, looked for
 Previous research
 Previous theory
 Research question
 Your intuition of the data or setting
2.Grounded codes—discovered
(suspend ideas about the subject and let the data determine codes)
Coding
 It helps if code names are meaningful.
 When new relevant content is discovered, a new code is created.
 Codes may evolve
 A string of text may contain more than one code.
Coding
 Codes must be consistently applied
 Keeping a list of codes helps to:
› Identify the content of each code, and
› Reveal the contents of the text.
 Codes should be grouped in some form (e.g., related clusters) to advance
analysis
Coding
http://www.qualitative-research.net/index.php/fqs/article/view/209/461
Displays
Making sense of the data
Displays
 There are numerous legitimate ways to move from
codes to final narrative, but core among them is
systematic work and adherence to logic.
 Systematic analysis is advanced when codes are put
into “data displays” which reflect the researcher’s
judgments about the data
 Data displays link various codes and help to build
themes
Displays
Source: http://journals.culture-communication.unimelb.edu.au/platform/yecrea_2011_kaprans.html
Thematic
network of
YouTube
comments
about Borat
Displays
 Such arrangements help researchers:
1. “dimensionalize,” or recognize dimensions of similar
thoughts or
 E.g., thoughts about how to appear masculine:
 Clothes Presence
 Short hair -- Confidence
 Plain shoes -- Taking up space
 Shirt with collar
2. Connect codes in more sophisticated ways
3. Document patterns in “user-friendly” ways (never
rely on memory)
Displays
 Relationships between codes become more
apparent as codes are grouped
 Themes should be explored
› Why do some codes co-occur?
› Why are some dimensions related to other codes while
others are not?
› Are some codes linked to particular emotions?
 Exploration of themes is analysis. The discoveries
should be written down. These eventually (with very
heavy and serious editing) turn into your written
text.
Analysis
 Process of Qualitative Analysis:
 Data Reduction
 Data Display
 Conclusion Drawing and Verification
 As one creates and views displays, the salient components
meaning and activities become apparent.
 Research may be:
› Descriptive: Represents the data (meanings, observations) to
readers in such a way that they will “understand” what the
researcher “sees” in the data.
› Causal: Links concepts in the data together to explain observed
meanings or phenomena, and to write in such a way that readers
will “understand” what the researcher “sees.”
 This stage relies very heavily on logical evaluation and
systematic description
Drawing Conclusions and Verification
The researcher WRITES what he or she sees as
logical descriptions of themes
The researcher always refers back to the data
displays and raw data as descriptions or causal
statements are made.
Systematic, organized, and good coding and notes
will really pay off at this point, allowing efficient,
accurate access to data
Conclusions are made through this process
Drawing Conclusions and Verification
Drawing Conclusions and Verification Articles and reports often include quotes. They are not the text “speaking for
itself.”
 Quotes are used for:
 Evidence
 Explanation
 Illustration
 Deepening understanding
 Giving participants a voice
 Enhancing readability
Drawing Conclusions and Verification
In the end, like good quantitative research, good
qualitative research gives a portrayal of the human
experience that is as accurate as possible, but which
always has limitations.
Qualitative Methods
 It is often difficult to plan qualitative research
 Group Discussion:
 Spend several minutes generating ideas for a qualitative
research study. What are you going to study and why?
 Create a plan for:
 Sampling
 How will you determine whether your sample is representative of
a target group?
 Data Collection
 Data Analysis
 How will you evaluate causality?
 How will you write about or present your findings?
Introduction

Qualitative data analysis

  • 1.
  • 2.
    QUALITATIVE DATA Qualitative dataanalysis involves organizing, accounting for and explaining the data; in short, making sense of data in terms of the participants’ definitions of the situation, noting patterns, themes, categories and regularities.
  • 3.
    QUALITATIVE DATA  Thereis no one single or correct way to analyse and present qualitative data; how one does it should abide by the issue of fitness for purpose. Further, qualitative data analysis, is often heavy on interpretation, and one has to note that there are frequently multiple interpretations to be made of qualitative data – that is their glory and their headache! In abiding by the principle of fitness for purpose,
  • 4.
    QUALITATVE ANALYSIS the researchermust be clear what he or she wants the data analysis to do as this will determine the kind of analysis that is undertaken  to describe  to portray  to summarize  to interpret  to discover patterns  to generate themes  to understand individuals and idiographic features  to understand groups and nomothetic features (e.g. frequencies, norms, patterns, ‘laws’)  to raise issues  to prove or demonstrate  to explain and seek causality  to explore
  • 5.
     The significanceof deciding the purpose is that it will determine the kind of analysis performed on the data. This, in turn, will influence the way in which the analysis is written up. The data analysis will also be influenced by the kind of qualitative study that is being undertaken.  For example, a biography and a case study may be most suitably written as descriptive narrative, often chronologically, with issues raised throughout. An ethnography may be written as narrative or stories, with issues raised, but not necessarily conforming to a chronology of events, and including description, analysis, interpretation and explanation of the key features of a group or culture. A grounded theory and content analysis will proceed through a systematic series of analyses, including coding and categorization, until theory emerges that explains the phenomena being studied or which can be used for predictive purposes.
  • 6.
    QUALITATIVE DATA  Theanalysis will also be influenced by the number of data sets and people from whom data have been collected. Qualitative data often focus on smaller numbers of people than quantitative data, yet the data tend to be detailed and rich. Researchers will need to decide, for example, whether to present data individual by individual, and then, if desired, to amalgamate key issues emerging across the individuals, or whether to proceed by working within a largely predetermined analytical frame of issues that crosses the individuals concerned qualitative studies deliberately focus on individuals and the responses of significant players in a particular scenario, often quoting verbatim responses in the final account; others are content to summarize issues without necessarily identifying exactly from whom the specific data were derived. Later on here we discuss methods to be used with respect to people and issues
  • 7.
    Qualitative analysis  Somestudies include a lot of verbatim conversations; others use fewer verbatim data. Some researchers feel that it is important to keep the flavour of the original data, so they report direct phrases and sentences, not only because they are often more illuminative and direct than the researchers’ own words, but also because they feel that it is important to be faithful to the exact words used.
  • 8.
    Qualitative data  Ata practical level, qualitative research rapidly amasses huge amounts of data, and early analysis reduces the problem of data overload by selecting out significant features for future focus.  careful data display is an important element of data reduction and selection. ‘Progressive focusing’ starts with the researcher taking a wide angle lens to gather data, and then, by sifting, sorting, reviewing and reflecting on them, the salient features of the situation emerge. These are then used as the agenda for subsequent focusing.
  • 9.
  • 10.
    ways of organizingand presenting data analysis  The methods are by people, and by issue, and the final method is by instrument.
  • 14.
    Data Text is generallycollected from or in the form of…  Field notes -- Newspaper or magazine stories  Interviews (recorded and transcribed)  Focus groups -- Web pages  Audio & video tapes (transcribed and described)  Copies of documents -- Photographs (described)  Narrative descriptions  Diaries
  • 15.
    1. Read Data,develop ideas and feelings 2. Code Data, tag items with same meaning using a unique code 3. Search and extract instances of codes 4. Identify patterns among codes (pattern coding) 5. Create figures, tables, or descriptions of patterns ANALYSIS THEMES
  • 16.
    Analysis  Process ofQualitative Analysis:  Data Reduction  Data Display  Conclusion Drawing and Verification
  • 17.
  • 18.
  • 19.
    Coding What is coding? In qualitative analysis, coding is the process of identifying categories and meanings in text, creating and applying a name or code to each, and systematically marking similar strings of text with the same code name.  Coding permits systematic retrieval of categories and meanings during analysis. Codes help researchers identify patterns in data.
  • 20.
    Coding  One codesonly relevant data (Not all text must be coded to complete the project)  Codes may be based on: Actions, Behaviors,Topics, Ideas, Concepts, Terms, Phrases, Keywords, and so forth  Coding is purposeful interpretation, with mindful reflection on the meanings of the persons, context, interactions, statements, assumptions, and so forth
  • 21.
  • 22.
    Coding Sources of codes(typically both): 1.A priori codes—expected, looked for  Previous research  Previous theory  Research question  Your intuition of the data or setting 2.Grounded codes—discovered (suspend ideas about the subject and let the data determine codes)
  • 23.
    Coding  It helpsif code names are meaningful.  When new relevant content is discovered, a new code is created.  Codes may evolve  A string of text may contain more than one code.
  • 24.
    Coding  Codes mustbe consistently applied  Keeping a list of codes helps to: › Identify the content of each code, and › Reveal the contents of the text.  Codes should be grouped in some form (e.g., related clusters) to advance analysis
  • 25.
  • 26.
  • 27.
    Displays  There arenumerous legitimate ways to move from codes to final narrative, but core among them is systematic work and adherence to logic.  Systematic analysis is advanced when codes are put into “data displays” which reflect the researcher’s judgments about the data  Data displays link various codes and help to build themes
  • 28.
  • 29.
    Displays  Such arrangementshelp researchers: 1. “dimensionalize,” or recognize dimensions of similar thoughts or  E.g., thoughts about how to appear masculine:  Clothes Presence  Short hair -- Confidence  Plain shoes -- Taking up space  Shirt with collar 2. Connect codes in more sophisticated ways 3. Document patterns in “user-friendly” ways (never rely on memory)
  • 30.
    Displays  Relationships betweencodes become more apparent as codes are grouped  Themes should be explored › Why do some codes co-occur? › Why are some dimensions related to other codes while others are not? › Are some codes linked to particular emotions?  Exploration of themes is analysis. The discoveries should be written down. These eventually (with very heavy and serious editing) turn into your written text.
  • 31.
    Analysis  Process ofQualitative Analysis:  Data Reduction  Data Display  Conclusion Drawing and Verification
  • 32.
     As onecreates and views displays, the salient components meaning and activities become apparent.  Research may be: › Descriptive: Represents the data (meanings, observations) to readers in such a way that they will “understand” what the researcher “sees” in the data. › Causal: Links concepts in the data together to explain observed meanings or phenomena, and to write in such a way that readers will “understand” what the researcher “sees.”  This stage relies very heavily on logical evaluation and systematic description Drawing Conclusions and Verification
  • 33.
    The researcher WRITESwhat he or she sees as logical descriptions of themes The researcher always refers back to the data displays and raw data as descriptions or causal statements are made. Systematic, organized, and good coding and notes will really pay off at this point, allowing efficient, accurate access to data Conclusions are made through this process Drawing Conclusions and Verification
  • 34.
    Drawing Conclusions andVerification Articles and reports often include quotes. They are not the text “speaking for itself.”  Quotes are used for:  Evidence  Explanation  Illustration  Deepening understanding  Giving participants a voice  Enhancing readability
  • 35.
    Drawing Conclusions andVerification In the end, like good quantitative research, good qualitative research gives a portrayal of the human experience that is as accurate as possible, but which always has limitations.
  • 36.
    Qualitative Methods  Itis often difficult to plan qualitative research  Group Discussion:  Spend several minutes generating ideas for a qualitative research study. What are you going to study and why?  Create a plan for:  Sampling  How will you determine whether your sample is representative of a target group?  Data Collection  Data Analysis  How will you evaluate causality?  How will you write about or present your findings? Introduction