This document describes a simulation of a quadcopter's dynamic system and interactive control system created by researchers at George Mason University. The simulation models the quadcopter's behavior in different environments based on parameters like payload, desired altitude, ascent/descent speeds and hover time. It includes equations of motion for the quadcopter in the z-axis and models forces like thrust, drag, weight. The simulation was able to follow user-specified altitude profiles within 1m of accuracy even with payloads over half the quadcopter's weight, demonstrating the potential for quadcopters as safe and effective delivery systems.
![George Mason University
Quadcopter Dyamics
Dynamic Systems Model and Interactive Control System
George Mason University
Systems Engineering and Operational Research
Fairfax, United States of America
Adnan Khan
Pwint Htwe
Luis Soto
Waqar Chaudhry
Badar Alwetaid
Unmanned aerial vehicles (UAV) have transformed our world
by enabling us to remotely perform actions never before possible.
From military purposes to filmmaking, UAV’s are now even
available to everyday citizens with little oversight. Due to the
increasing use of these machines in industry and now the civilian
sphere, it is in our interest to model their behavior in different
environments and explore their capabilities.
I. INTRODUCTION
The control systems of quadcopters are a major subject of
research as these vehicles find their place in the aerial world.
Their interaction with other aerial and ground-based units
requires us to refine and develop their controls so they maintain
safety standards and better serve our needs.
This report covers an exercise in which a quadcopter was
modeled to follow a user-specified altitude profile which
includes parameters such as payload, desired altitude, desired
ascent and descent speeds, and hover time.
II. MODEL DESCRIPTION AND EQUATIONS
A. Assumptions
The model was simplified in order to place greater
emphasis on user-interaction and system response than
physical quadcopter design parameters. Relationships between
rotor speed, battery life, and lift were not taken into account.
All four rotors are seen to be providing one upward thrust force
which is assumed to be 31.4 Newtons [1]. Note that maximum
thrust is not used in the “Max Thrust” gain as it was not
required to meet system requirements. The unit weight,
dimensions, and temperature range were modeled after the DJI
Phantom 3 professional [2].
Drag force is modeled using an air density value based on a
median temperature of 68°F, a mean national elevation of
2500ft and 50% humidity. Noise blocks were added to both the
position and velocity to simulate atmospheric changes, wind
turbulence and other minor weather behavior. The body was
modeled as a cube and a coefficient value of 0.8 was used [3].
A delay is added after the controller via the “Action Delay”
block which consists of a transfer function. This provides a
one-second delay which models the delay in system response
after the command executes. An altitude sensor is added to
provide a feedback loop allowing the system to conform to the
altitude profile.
Figure 1: Free body diagram (Ascent)
B. Model Description
The free body diagram for the system can be seen in figure
1 above. Individual thrust forces are shown in the diagram on
each rotor (Tx forces were summed into a single upward
thrust) and the downward thrust and weight forces are
represented by a single vector. Only movement in the z-axis is
modeled and the three phases are ascent, descent and hover. In
the hover phase, the drag force is absent and in the descent
phase it faces in the opposite direction (upward). The figure
below shows both of these phases:
Figure 2: Hover (left) and descent (right)
C. Equations
The equation of motion shown on the next page gives the
acceleration of the quadcopter in the z-axis as 𝑧̈. The parameter
T represents thrust which is the control. m represents the mass
of the quadcopter, while mp represents the mass of the payload.
This mass is entered in the MATLAB script file provided with
the simulation as a weight in pounds and exported to the
Simulink diagram. The drag equation complicates the model](https://image.slidesharecdn.com/caacf669-449f-4be2-9525-2444f7d5e51b-151228083756/85/Quadcopter-Simulation-1-320.jpg)
![George Mason University
Quadcopter Dyamics
Dynamic Systems Model and Interactive Control System
George Mason University
Systems Engineering and Operational Research
Fairfax, United States of America
Adnan Khan
Pwint Htwe
Luis Soto
Waqar Chaudhry
Badar Alwetaid
Unmanned aerial vehicles (UAV) have transformed our world
by enabling us to remotely perform actions never before possible.
From military purposes to filmmaking, UAV’s are now even
available to everyday citizens with little oversight. Due to the
increasing use of these machines in industry and now the civilian
sphere, it is in our interest to model their behavior in different
environments and explore their capabilities.
I. INTRODUCTION
The control systems of quadcopters are a major subject of
research as these vehicles find their place in the aerial world.
Their interaction with other aerial and ground-based units
requires us to refine and develop their controls so they maintain
safety standards and better serve our needs.
This report covers an exercise in which a quadcopter was
modeled to follow a user-specified altitude profile which
includes parameters such as payload, desired altitude, desired
ascent and descent speeds, and hover time.
II. MODEL DESCRIPTION AND EQUATIONS
A. Assumptions
The model was simplified in order to place greater
emphasis on user-interaction and system response than
physical quadcopter design parameters. Relationships between
rotor speed, battery life, and lift were not taken into account.
All four rotors are seen to be providing one upward thrust force
which is assumed to be 31.4 Newtons [1]. Note that maximum
thrust is not used in the “Max Thrust” gain as it was not
required to meet system requirements. The unit weight,
dimensions, and temperature range were modeled after the DJI
Phantom 3 professional [2].
Drag force is modeled using an air density value based on a
median temperature of 68°F, a mean national elevation of
2500ft and 50% humidity. Noise blocks were added to both the
position and velocity to simulate atmospheric changes, wind
turbulence and other minor weather behavior. The body was
modeled as a cube and a coefficient value of 0.8 was used [3].
A delay is added after the controller via the “Action Delay”
block which consists of a transfer function. This provides a
one-second delay which models the delay in system response
after the command executes. An altitude sensor is added to
provide a feedback loop allowing the system to conform to the
altitude profile.
Figure 1: Free body diagram (Ascent)
B. Model Description
The free body diagram for the system can be seen in figure
1 above. Individual thrust forces are shown in the diagram on
each rotor (Tx forces were summed into a single upward
thrust) and the downward thrust and weight forces are
represented by a single vector. Only movement in the z-axis is
modeled and the three phases are ascent, descent and hover. In
the hover phase, the drag force is absent and in the descent
phase it faces in the opposite direction (upward). The figure
below shows both of these phases:
Figure 2: Hover (left) and descent (right)
C. Equations
The equation of motion shown on the next page gives the
acceleration of the quadcopter in the z-axis as 𝑧̈. The parameter
T represents thrust which is the control. m represents the mass
of the quadcopter, while mp represents the mass of the payload.
This mass is entered in the MATLAB script file provided with
the simulation as a weight in pounds and exported to the
Simulink diagram. The drag equation complicates the model](https://image.slidesharecdn.com/caacf669-449f-4be2-9525-2444f7d5e51b-151228083756/75/Quadcopter-Simulation-1-2048.jpg)
![George Mason University
due to the 𝑧̇2
term which is not a common Laplace transform.
Laplace-domain analyses such as the final value theorem and
root-locus plots are no longer possible. The reliance then shifts
toward the numerical method provided by Simulink.
𝑧̈ =
𝑇
𝑚 + 𝑚 𝑝
−
9.8(𝑚 + 𝑚 𝑝) + 0.11𝑧̇2
𝑚 + 𝑚 𝑝
Once the altitude profile is added and the feedback loop is run
from the output, the thrust parameter T becomes a gain and is
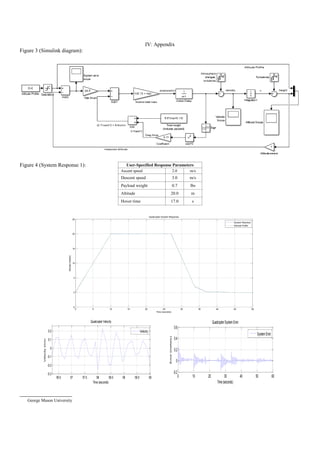
used to control the system. The implementation can be seen in
figure 3 of the Appendix where the T parameter is named
“Max thrust”. Note the saturation block added after the altitude
profile. This block serves no other purpose than to filter out all
negative inputs from the altitude profile. The “sign” block
before the squared velocity term allows the system to retain the
negative sign of the velocity despite the term being squared.
III. RESULTS
A. Tables and Figures
The Appendix contains the Simulink diagram for the model
(Figure 3) as well as various plots (Figures 4-6). The noise
function makes the graphs difficult to interpret but this is a
realistic constraint because at only 2.8lbs, the vehicle is fairly
sensitive to wind and other external forces. The tables
accompanying the plots display the inputs entered by the user.
A wide range of values were chosen for each response to
model system behavior at different states. The response
plotted in figure 6 has particularly large values which are
extreme cases designed to test the system at its limits. The DJI
Phantom 3 Professional has maximum ascent and descent
speeds of 5m/s and 3m/s, respectively.
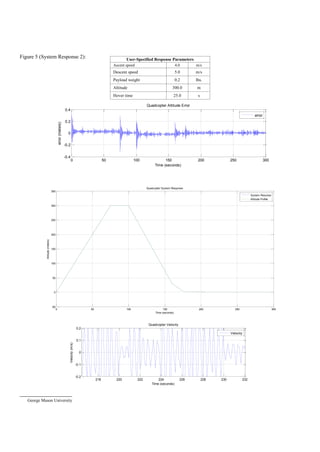
B. Analysis
One system requirements dictates that it must not deviate
from the user-specified altitude profile by more than 1m. The
standard error plot shows the actual altitude subtracted by the
input profile altitude. The scope is connected before the thrust
gain which gives an accurate representation of deviation. In
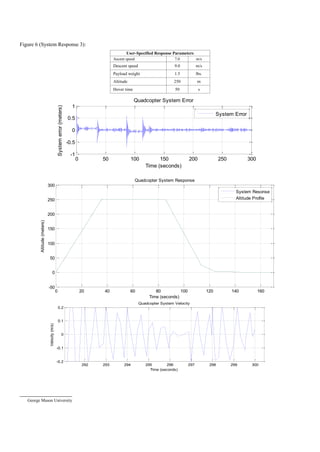
“System Response 3”, the effect of the large payload of 1.5lbs
(more than half the weight of the vehicle) is evident by the
larger standard error. However, the system still meets the
project specifications with considerable room for error. Due to
the large thrust potential of the rotors, deviation from the
specified profile is quick and enough to keep the quadcopter on
course with great accuracy. It is also less sensitive to higher
payloads and has a high payload capacity. It should be noted
that the error may be caused by large velocity values as well,
since the other two system responses have lower magnitudes of
standard error.
The system meets the landing velocity requirement as well
in every case despite visible oscillation from the noise blocks.
System velocity appears to be much smoother in response 1
which is likely due to the smaller ascent and descent speeds.
Velocity oscillations are also caused by the abrupt changes in
the altitude profile which can be seen in the landing phases of
each system response. Same-size matrices were used to
produce the altitude profile which may not be the best way of
modeling a flight plan. A decaying exponential or another
continuously time-based function may allow for a smoother
landing, especially when the ascent and descent speeds are of
larger magnitude. At t = 10 in the first response plot, the
oscillations caused by the abrupt change in command can be
seen in the velocity plot. The same destabilizing behavior can
be seen in the same plot at approximately t =28, and t = 35. I is
worthy of noting that the abrupt rise in error is more prevalent
at other parts of the graph than the landing phases. System
performance could be utilized further if a smoother altitude
profile was made. A smoother input would cause fewer
oscillations, increase vehicle payload and maximize ascent and
descent speeds.
CONCLUSION
The model shows the potential of the four-rotor quadcopter
to be safe, efficient and extremely useful. The maximum thrust
value used in this model shows that the vehicle can pick up
more than half its weight as a payload and still meet the
required deviation limits. As a general rule, greater payload or
mass seems to require a proportional increase in the maximum
allowable thrust that the rotors produce. The simulation
conducted demonstrates the viability of the quadcopter as a
safe and effective low-cost delivery system. Moreover, the
model can be modified for use with different physical
parameters with ease. In conclusion, this model can be used to
explore the limits of quadcopters as their immense application
potential is explored.
References
[1] E310 - Specs | DJI. (n.d.). Retrieved December 11, 2015, from
http://www.dji.com/product/e310/spec?www=v1
[2] Phantom 3 Professional - Specs, FAQ, Tutorials, Downloads
and DJI GO | DJI. (n.d.). Retrieved December 11, 2015, from
http://www.dji.com/product/phantom-3-pro/info#spec
[3] Drag Coefficient. (n.d.). Retrieved December 11, 2015, from
http://www.engineeringtoolbox.com/drag-coefficient-d_627.html](https://image.slidesharecdn.com/caacf669-449f-4be2-9525-2444f7d5e51b-151228083756/85/Quadcopter-Simulation-2-320.jpg)