QNBFS Daily Technical Trader - Qatar April 02, 2017QNB Group
The Index ended last week on the red; it
lost 0.25% of the session and lost 0.52%
for the week on weaker volumes. Unless
the Index moves above the 10,500 mark,
it could struggle further with weakness.
QNBFS Daily Technical Trader - Qatar May 08, 2017QNB Group
The Index dropped further but remains above our expected support of 9,800. The RSI has been positively diverging against the Index; a relief rally is probable.
QNBFS Daily Technical Trader - Qatar April 13, 2017QNB Group
The Index created a bullish engulfing
candlestick but the Index remains under
the 10,500 level but indecision overrules
the general sentiment in the market.
QNBFS Daily Technical Trader - Qatar April 10, 2017QNB Group
Now that the Index moved up and reached the 10,500 level, we see indecision among traders on the possible direction of the market. Indicators are mostly flat for that matter.
QNBFS Daily Technical Trader - Qatar June 14, 2017QNB Group
The Index has stabilized above a critical psychological support at the 9,000 mark. The current status on the daily RSI indicates a possible bounce but keep an eye if the Index breaks below the mentioned level.
QNBFS Daily Technical Trader - Qatar March 08, 2017QNB Group
The Index has weakened even further and
broke below the 10,500 support (which is
now a resistance level). The possibility for
a relief bounce is there but the trend, in
the shorter term, turned bearish.
QNBFS Daily Technical Trader - Qatar for January 14, 2018Aicha El-Mamy
The Index closed at the highest in four months. The current bullish move could continue after it cleared the 9,000 level. Moreover, the recent rally has created stronger support points in case the market
corrects.
QNBFS Daily Technical Trader - Qatar February 07, 2017QNB Group
The Index closed marginally higher after
the bullish Engulfing candlestick created
the session before. The Index has been
maintaining its level above the 10,500
mark and above its moving averages,
which is positive.
QNBFS Daily Technical Trader - Qatar March 19, 2017QNB Group
We keep the support level at 10,365, even
though the Index closed just below that
level. We expect the Index to possibly
bounce off the lower part of the
downtrend channel seen on the intraday
chart.
QNBFS Daily Technical Trader - Qatar February 15, 2017QNB Group
The Index closed flat last Monday but
looks fairly bullish on the intraday chart
as it bounced off an intra-day support
level and it is moving above the 50SMA
on the daily chart.
QNBFS Daily Technical Trader - Qatar March 07, 2017QNB Group
The Index weakened and remains in a
range like we expected last week.
Weakness is expected to continue,
especially if the Index drops below the
10,500 mark.
QNBFS Daily Technical Trader - Qatar January 05, 2017QNB Group
The RSI reached the overbought area on the daily chart, which means the market could be overheating. That been said, the Index’s movement remains positive. We keep the resistance at the 10,680, even though the Index closed marginally higher than the level.
QNBFS Daily Technical Trader - Qatar March 23, 2017QNB Group
The Index closed down and the Index
losing its signals except for a possible
inverse Head and Shoulders that has not
been confirmed yet. Once confirmed, we
may see a stronger move on the green
side.
QNBFS Daily Technical Trader - Qatar April 20, 2017QNB Group
The bearish Flag formation we mentioned in the previous report got confirmed. That said, the Index reached a support line (seen on the daily chart). We may
QNBFS Daily Technical Trader - Qatar February 02, 2017QNB Group
The Index closed flat and created a
narrow downtrend channel on the
intraday chart. If the Index manages to
break above that channel then the chance
for a corrective rally would become
possible.
QNBFS Daily Technical Trader - Qatar March 27, 2017QNB Group
The Index created the inverted Head and
Shoulders formation, which is a bullish
formation, but the Index retraced below
the neckline to test it. We need a solid
break above that neckline to see a bullish
move.
QNBFS Daily Technical Trader - Qatar June 19, 2017QNB Group
The Index created a corrective candlestick pattern; we may see some selling pressure but as long as it stays above the 9,000 level, it is considered stable.
QNBFS Daily Technical Trader - Qatar August 15, 2016QNB Group
The Index broke above the important and
psychological level of 11,000 points and
managed to close above it. The
bullishness of the Index is expected to
continue but corrections remain possible
and these corrections could be used as
buying points.
QNBFS Daily Technical Trader - Qatar May 29, 2017QNB Group
The Index remains flat as seen on the daily chart; the moving averages are flat and the RSI is also neutral. On the Intraday chart, we see the Index trying to breakout above the downtrend channel.
QNBFS Daily Technical Trader - Qatar February 08, 2017QNB Group
The Index closed lower but its intraday
chart indicates stability and probable
uptick. The reason is the possible Double-
Bottom formation seen on the 30-minute
chart.
Turin Startup Ecosystem 2024 - Ricerca sulle Startup e il Sistema dell'Innov...Quotidiano Piemontese
Turin Startup Ecosystem 2024
Una ricerca de il Club degli Investitori, in collaborazione con ToTeM Torino Tech Map e con il supporto della ESCP Business School e di Growth Capital
how can I sell pi coins after successfully completing KYCDOT TECH
Pi coins is not launched yet in any exchange 💱 this means it's not swappable, the current pi displaying on coin market cap is the iou version of pi. And you can learn all about that on my previous post.
RIGHT NOW THE ONLY WAY you can sell pi coins is through verified pi merchants. A pi merchant is someone who buys pi coins and resell them to exchanges and crypto whales. Looking forward to hold massive quantities of pi coins before the mainnet launch.
This is because pi network is not doing any pre-sale or ico offerings, the only way to get my coins is from buying from miners. So a merchant facilitates the transactions between the miners and these exchanges holding pi.
I and my friends has sold more than 6000 pi coins successfully with this method. I will be happy to share the contact of my personal pi merchant. The one i trade with, if you have your own merchant you can trade with them. For those who are new.
Message: @Pi_vendor_247 on telegram.
I wouldn't advise you selling all percentage of the pi coins. Leave at least a before so its a win win during open mainnet. Have a nice day pioneers ♥️
#kyc #mainnet #picoins #pi #sellpi #piwallet
#pinetwork
Resume
• Real GDP growth slowed down due to problems with access to electricity caused by the destruction of manoeuvrable electricity generation by Russian drones and missiles.
• Exports and imports continued growing due to better logistics through the Ukrainian sea corridor and road. Polish farmers and drivers stopped blocking borders at the end of April.
• In April, both the Tax and Customs Services over-executed the revenue plan. Moreover, the NBU transferred twice the planned profit to the budget.
• The European side approved the Ukraine Plan, which the government adopted to determine indicators for the Ukraine Facility. That approval will allow Ukraine to receive a EUR 1.9 bn loan from the EU in May. At the same time, the EU provided Ukraine with a EUR 1.5 bn loan in April, as the government fulfilled five indicators under the Ukraine Plan.
• The USA has finally approved an aid package for Ukraine, which includes USD 7.8 bn of budget support; however, the conditions and timing of the assistance are still unknown.
• As in March, annual consumer inflation amounted to 3.2% yoy in April.
• At the April monetary policy meeting, the NBU again reduced the key policy rate from 14.5% to 13.5% per annum.
• Over the past four weeks, the hryvnia exchange rate has stabilized in the UAH 39-40 per USD range.
how can I sell my pi coins for cash in a pi APPDOT TECH
You can't sell your pi coins in the pi network app. because it is not listed yet on any exchange.
The only way you can sell is by trading your pi coins with an investor (a person looking forward to hold massive amounts of pi coins before mainnet launch) .
You don't need to meet the investor directly all the trades are done with a pi vendor/merchant (a person that buys the pi coins from miners and resell it to investors)
I Will leave The telegram contact of my personal pi vendor, if you are finding a legitimate one.
@Pi_vendor_247
#pi network
#pi coins
#money
The secret way to sell pi coins effortlessly.DOT TECH
Well as we all know pi isn't launched yet. But you can still sell your pi coins effortlessly because some whales in China are interested in holding massive pi coins. And they are willing to pay good money for it. If you are interested in selling I will leave a contact for you. Just telegram this number below. I sold about 3000 pi coins to him and he paid me immediately.
Telegram: @Pi_vendor_247
If you are looking for a pi coin investor. Then look no further because I have the right one he is a pi vendor (he buy and resell to whales in China). I met him on a crypto conference and ever since I and my friends have sold more than 10k pi coins to him And he bought all and still want more. I will drop his telegram handle below just send him a message.
@Pi_vendor_247
Empowering the Unbanked: The Vital Role of NBFCs in Promoting Financial Inclu...Vighnesh Shashtri
In India, financial inclusion remains a critical challenge, with a significant portion of the population still unbanked. Non-Banking Financial Companies (NBFCs) have emerged as key players in bridging this gap by providing financial services to those often overlooked by traditional banking institutions. This article delves into how NBFCs are fostering financial inclusion and empowering the unbanked.
what is the future of Pi Network currency.DOT TECH
The future of the Pi cryptocurrency is uncertain, and its success will depend on several factors. Pi is a relatively new cryptocurrency that aims to be user-friendly and accessible to a wide audience. Here are a few key considerations for its future:
Message: @Pi_vendor_247 on telegram if u want to sell PI COINS.
1. Mainnet Launch: As of my last knowledge update in January 2022, Pi was still in the testnet phase. Its success will depend on a successful transition to a mainnet, where actual transactions can take place.
2. User Adoption: Pi's success will be closely tied to user adoption. The more users who join the network and actively participate, the stronger the ecosystem can become.
3. Utility and Use Cases: For a cryptocurrency to thrive, it must offer utility and practical use cases. The Pi team has talked about various applications, including peer-to-peer transactions, smart contracts, and more. The development and implementation of these features will be essential.
4. Regulatory Environment: The regulatory environment for cryptocurrencies is evolving globally. How Pi navigates and complies with regulations in various jurisdictions will significantly impact its future.
5. Technology Development: The Pi network must continue to develop and improve its technology, security, and scalability to compete with established cryptocurrencies.
6. Community Engagement: The Pi community plays a critical role in its future. Engaged users can help build trust and grow the network.
7. Monetization and Sustainability: The Pi team's monetization strategy, such as fees, partnerships, or other revenue sources, will affect its long-term sustainability.
It's essential to approach Pi or any new cryptocurrency with caution and conduct due diligence. Cryptocurrency investments involve risks, and potential rewards can be uncertain. The success and future of Pi will depend on the collective efforts of its team, community, and the broader cryptocurrency market dynamics. It's advisable to stay updated on Pi's development and follow any updates from the official Pi Network website or announcements from the team.
What website can I sell pi coins securely.DOT TECH
Currently there are no website or exchange that allow buying or selling of pi coins..
But you can still easily sell pi coins, by reselling it to exchanges/crypto whales interested in holding thousands of pi coins before the mainnet launch.
Who is a pi merchant?
A pi merchant is someone who buys pi coins from miners and resell to these crypto whales and holders of pi..
This is because pi network is not doing any pre-sale. The only way exchanges can get pi is by buying from miners and pi merchants stands in between the miners and the exchanges.
How can I sell my pi coins?
Selling pi coins is really easy, but first you need to migrate to mainnet wallet before you can do that. I will leave the telegram contact of my personal pi merchant to trade with.
Tele-gram.
@Pi_vendor_247
how to swap pi coins to foreign currency withdrawable.DOT TECH
As of my last update, Pi is still in the testing phase and is not tradable on any exchanges.
However, Pi Network has announced plans to launch its Testnet and Mainnet in the future, which may include listing Pi on exchanges.
The current method for selling pi coins involves exchanging them with a pi vendor who purchases pi coins for investment reasons.
If you want to sell your pi coins, reach out to a pi vendor and sell them to anyone looking to sell pi coins from any country around the globe.
Below is the contact information for my personal pi vendor.
Telegram: @Pi_vendor_247
how to sell pi coins in South Korea profitably.DOT TECH
Yes. You can sell your pi network coins in South Korea or any other country, by finding a verified pi merchant
What is a verified pi merchant?
Since pi network is not launched yet on any exchange, the only way you can sell pi coins is by selling to a verified pi merchant, and this is because pi network is not launched yet on any exchange and no pre-sale or ico offerings Is done on pi.
Since there is no pre-sale, the only way exchanges can get pi is by buying from miners. So a pi merchant facilitates these transactions by acting as a bridge for both transactions.
How can i find a pi vendor/merchant?
Well for those who haven't traded with a pi merchant or who don't already have one. I will leave the telegram id of my personal pi merchant who i trade pi with.
Tele gram: @Pi_vendor_247
#pi #sell #nigeria #pinetwork #picoins #sellpi #Nigerian #tradepi #pinetworkcoins #sellmypi
US Economic Outlook - Being Decided - M Capital Group August 2021.pdfpchutichetpong
The U.S. economy is continuing its impressive recovery from the COVID-19 pandemic and not slowing down despite re-occurring bumps. The U.S. savings rate reached its highest ever recorded level at 34% in April 2020 and Americans seem ready to spend. The sectors that had been hurt the most by the pandemic specifically reduced consumer spending, like retail, leisure, hospitality, and travel, are now experiencing massive growth in revenue and job openings.
Could this growth lead to a “Roaring Twenties”? As quickly as the U.S. economy contracted, experiencing a 9.1% drop in economic output relative to the business cycle in Q2 2020, the largest in recorded history, it has rebounded beyond expectations. This surprising growth seems to be fueled by the U.S. government’s aggressive fiscal and monetary policies, and an increase in consumer spending as mobility restrictions are lifted. Unemployment rates between June 2020 and June 2021 decreased by 5.2%, while the demand for labor is increasing, coupled with increasing wages to incentivize Americans to rejoin the labor force. Schools and businesses are expected to fully reopen soon. In parallel, vaccination rates across the country and the world continue to rise, with full vaccination rates of 50% and 14.8% respectively.
However, it is not completely smooth sailing from here. According to M Capital Group, the main risks that threaten the continued growth of the U.S. economy are inflation, unsettled trade relations, and another wave of Covid-19 mutations that could shut down the world again. Have we learned from the past year of COVID-19 and adapted our economy accordingly?
“In order for the U.S. economy to continue growing, whether there is another wave or not, the U.S. needs to focus on diversifying supply chains, supporting business investment, and maintaining consumer spending,” says Grace Feeley, a research analyst at M Capital Group.
While the economic indicators are positive, the risks are coming closer to manifesting and threatening such growth. The new variants spreading throughout the world, Delta, Lambda, and Gamma, are vaccine-resistant and muddy the predictions made about the economy and health of the country. These variants bring back the feeling of uncertainty that has wreaked havoc not only on the stock market but the mindset of people around the world. MCG provides unique insight on how to mitigate these risks to possibly ensure a bright economic future.
how to sell pi coins in all Africa Countries.DOT TECH
Yes. You can sell your pi network for other cryptocurrencies like Bitcoin, usdt , Ethereum and other currencies And this is done easily with the help from a pi merchant.
What is a pi merchant ?
Since pi is not launched yet in any exchange. The only way you can sell right now is through merchants.
A verified Pi merchant is someone who buys pi network coins from miners and resell them to investors looking forward to hold massive quantities of pi coins before mainnet launch in 2026.
I will leave the telegram contact of my personal pi merchant to trade with.
@Pi_vendor_247
Introduction to Indian Financial System ()Avanish Goel
The financial system of a country is an important tool for economic development of the country, as it helps in creation of wealth by linking savings with investments.
It facilitates the flow of funds form the households (savers) to business firms (investors) to aid in wealth creation and development of both the parties
QNBFS Daily Technical Trader - Qatar March 29, 2017
1. COPYRIGHT: No part of this document may be reproduced without the explicit written permission of QNBFS Page 1 of 5
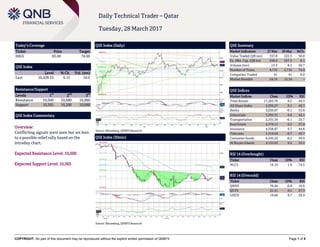
Daily Technical Trader – Qatar
Tuesday, 28 March 2017
Today’s Coverage
Ticker Price Target
IHGS 65.00 74.00
QSE Index
Level % Ch. Vol. (mn)
Last 10,428.53 0.15 10.0
Resistance/Support
Levels 1
st
2
nd
3
rd
Resistance 10,500 10,680 10,960
Support 10,365 10,200 10,000
QSE Index Commentary
Overview:
Conflicting signals were seen but we lean
to a possible relief rally based on the
intraday chart.
Expected Resistance Level: 10,500
Expected Support Level: 10,365
QSE Index (Daily)
Source: Bloomberg, QNBFS Research
QSE Summary
Market Indicators 27 Mar 26 Mar %Ch.
Value Traded (QR mn) 333.8 222.5 50.0
Ex. Mkt. Cap. (QR bn) 558.0 557.3 0.1
Volume (mn) 13.3 8.3 59.7
Number of Trans. 4,715 2,710 74.0
Companies Traded 41 41 0.0
Market Breadth 24:14 15:18 –
QSE Indices
Market Indices Close 1D% RSI
Total Return 17,283.78 0.2 49.3
All Share Index 2,936.07 0.1 49.7
Banks 3,030.87 -0.1 53.8
Industrials 3,292.35 0.6 42.1
Transportation 2,335.34 -0.1 25.7
Real Estate 2,379.11 0.2 57.0
Insurance 4,338.87 0.7 44.8
Telecoms 1,214.04 -0.7 45.7
Consumer Goods 6,445.22 -0.2 59.0
Al Rayan Islamic 4,132.63 0.2 55.5
RSI 14 (Overbought)
Ticker Close 1D% RSI
NLCS 19.10 1.8 74.5
RSI 14 (Oversold)
Ticker Close 1D% RSI
QNNS 76.40 -0.8 16.6
QGTS 21.41 0.5 27.3
UDCD 19.68 0.7 29.4
QSE Index (30min)
Source: Bloomberg, QNBFS Research
2. COPYRIGHT: No part of this document may be reproduced without the explicit written permission of QNBFS Page 2 of 5
ISLAMIC HOLDING GROUP (IHGS)
Price % Ch. Volume
Last 65.00 0.00 212,168
Resistance/Support
Levels (QR) 1
st
2
nd
3
rd
Resistance 66.00 74.00 78.90
Support 62.00 60.00 58.00
Commentary
Overview:
We sent a buy recommendation on the
name on the 9
th
of this month and price
reached our first target; you can add
further around here. If you do not have a
position, then you could take one around
here as we have seen an uptick in traded
volumes near a major breakout level.
Expected Target Price: QR74.00 – QR78.90
A price breakout above QR66.00 triggers
the buy recommendation.
Suggested Stop-Loss Price: QR62.00
(Daily)
Source: Bloomberg, QNBFS Research
(Hourly)
Source: Bloomberg, QNBFS Research
4. COPYRIGHT: No part of this document may be reproduced without the explicit written permission of QNBFS Page 4 of 5
Definitions:
Candlestick: A chart that displays the high, low, opening and closing prices for a security in a single period. The body of the candle is made up by the opening and
the closing prices, i.e., the taller the body the greater the range between these two prices and vice versa. A colored candle denotes a closing price that is lower
than the opening price, while a white candle shows the opposite. The candlestick's shadows or wicks show the period's high and low prices and how they
compare to the opening and closing price. In general, the shape of the candle will vary upon the positions of the period's high, low, opening and closing prices.
Support: A level that could cause more buyers to step in in order to prevent the security from falling or causing the security price to head higher.
Resistance: An inverse of a support level. A resistance area or level could cause more sellers to step in in order to prevent the security from rising or causing the
security price to head lower.
SMA (Simple Moving Average): Is an arithmetic average, which calculates the average price of a security over a defined number of periods and is thus considered
a lagging indicator. SMAs used in our analysis refer to closing prices. In general, SMAs serve many purposes, such as a smoothing tool, an indicative price
direction and potential support/resistance levels.
Market Breadth: Breadth indicates the number of securities that have closed higher vs. the number of decliners in a particular exchange.
MACD (Moving Average Convergence/Divergence): Is a trading indicator, which shows changes in the strength, direction, momentum and duration of a trend in
a stock's price through a collection of three time series calculated from historical closing price data.
RSI (Relative Strength Index): Is a momentum indicator that compares a security’s price gains to its losses for a predetermined number of periods (we generally
use 14 periods). The RSI attempts to point out how a security, in relative terms, is in the overbought/oversold zone. Securities with a RSI above 70 could be
considered as overbought, and below 30 could be considered as oversold.
Pattern/Formation: Is a graphical presentation of a security’s price activity over a certain period of time. Formations come in different shapes (such as, head &
shoulders, triangles, flags, and so on). They can be used to identify potential trends, reversal of trends, price targets, entry and exit points, etc.
Fibonacci Retracements: Are horizontal lines that indicate expected areas of support/resistance for a security based on a predetermined price movement. These
levels are usually indicated by Fibonacci ratios of 23.6%, 38.2%, 50.0%, 61.8% and 100% from that particular movement.
Fibonacci Pivot and Intra-day Support/Resistance: A Pivot Point is generally used to formulate expected future support/resistance levels. From the base Pivot
Point, Fibonacci multiples of the high-low differential are added to form resistance levels and subtracted to form support levels.
5. COPYRIGHT: No part of this document may be reproduced without the explicit written permission of QNBFS Page 5 of 5
Contacts:
Zaid al-Nafoosi, CMT, CFTe Saugata Sarkar Shahan Keushgerian
Senior Research Analyst Head of Research Senior Research Analyst
Tel: (+974) 4476 6535 Tel: (+974) 4476 6534 Tel: (+974) 4476 6509
zaid.alnafoosi@qnbfs.com.qa saugata.sarkar@qnbfs.com.qa shahan.keushgerian@qnbfs.com.qa
Mohamed Abo Daff Sahbi Kasraoui Youssef Elboghdady
Senior Research Analyst Acting Head of Trading Head of Institutional Sales & Trading
Tel: (+974) 4476 6589 Tel: (+974) 4476 6544 Tel: (+974) 4476 6542
Mohd.abodaff@qnbfs.com.qa sahbi.alkasraoui@qnbfs.com.qa youssef.elboghdady@qnbfs.com.qa
QNB Financial Services
Contact Center: (+974) 4476 6666
PO Box 24025
Doha, Qatar
Disclaimer and Copyright Notice: This publication has been prepared by QNB Financial Services Co. W.L.L. (“QNBFS”) a wholly-owned subsidiary of Qatar National Bank (Q.P.S.C.) (“QNB”). QNBFS is
regulated by the Qatar Financial Markets Authority and the Qatar Exchange QNB SAQ is regulated by the Qatar Central Bank. This publication expresses the views and opinions of QNBFS at a given
time only. It is not an offer, promotion or recommendation to buy or sell securities or other investments, nor is it intended to constitute legal, tax, accounting, or financial advice. QNBFS accepts no
liability whatsoever for any direct or indirect losses arising from use of this report. Any investment decision should depend on the individual circumstances of the investor and be based on specifically
engaged investment advice. We therefore strongly advise potential investors to seek independent professional advice before making any investment decision. Although the information in this report
has been obtained from sources that QNBFS believes to be reliable, we have not independently verified such information and it may not be accurate or complete. QNBFS does not make any
representations or warranties as to the accuracy and completeness of the information it may contain, and declines any liability in that respect. For reports dealing with Technical Analysis, expressed
opinions and/or recommendations may be different or contrary to the opinions/recommendations of QNBFS Fundamental Research as a result of depending solely on the historical technical data (price
and volume). QNBFS reserves the right to amend the views and opinions expressed in this publication at any time. It may also express viewpoints or make investment decisions that differ significantly
from, or even contradict, the views and opinions included in this report. This report may not be reproduced in whole or in part without permission from QNBFS.