- Richmont Mines reported fourth quarter and full year 2016 financial results on February 21, 2017.
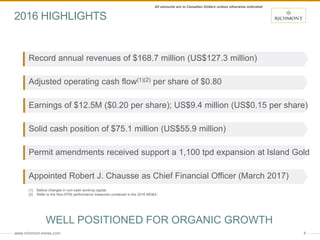
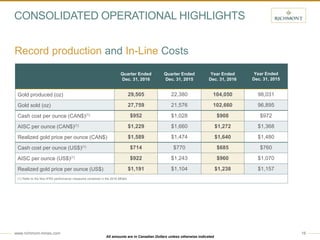
- In 2016, the company achieved record annual gold production of 104,050 ounces, at the high end of guidance. Cash costs for the year were $908 per ounce sold, within guidance.
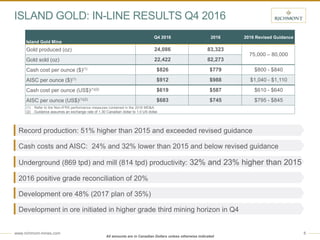
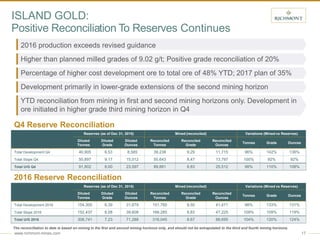
- At the Island Gold Mine, production was 83,323 ounces for 2016, exceeding the revised guidance range. Cash costs of $779 per ounce were below the revised guidance range.
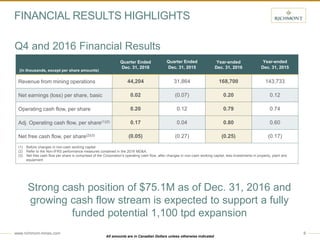
- The company reported a strong cash position of $75.1 million as of December 31, 2016 and expects a growing cash flow stream to support a potential expansion at Island Gold.