(DIYA) Bhumkar Chowk Call Girls Just Call 7001035870 [ Cash on Delivery ] Pun...
Q1 2009 Earning Report of TD AMERITRADE Holding Corporation
1. Strong Organic Growth at TD AMERITRADE Continues
in Second Quarter
Quarterly Earnings Per Share (EPS) of $0.23Near-record Trading Levels
and Strong Asset GatheringBest Six Months for New Account Growth in
Nine Years
OMAHA, Neb., Apr 21, 2009 (BUSINESS WIRE) -- TD AMERITRADE Holding Corporation (NASDAQ:AMTD) has
released results for its second quarter of fiscal 2009, reporting strong business fundamentals and organic growth that
continues in the face of a difficult market. Client engagement, both in terms of trading volume and new asset growth,
combined with near-record new account openings led to a strong showing for the Company.
(1)
The Company's results for the quarter ended Mar. 31, 2009 include the following (year-over-year comparisons):
Net income of $132 million, or $0.23 per diluted share
(2)
Average client trades per day of approximately 325,000, an increase of 8 percent
Net new assets of approximately $6 billion, or an annualized growth rate of 11 percent on client assets at the
beginning of the quarter
(3)
Spread-based balances of approximately $27 billion, an increase of 5 percent
Fee-based balances of approximately $59 billion, a decrease of 17 percent
Net revenues of $525 million, 48 percent of which were asset-based
Pre-tax income of $224 million, or 43 percent of net revenues
(4)
EBITDA of $258 million, or 49 percent of net revenues
Annualized return on average stockholders' equity of 18 percent
Client assets of approximately $225 billion, including $53 billion in client cash and money market funds
quot;While we still face some challenging headwinds, there are many things to be proud of this quarter,quot; said Fred
Tomczyk, president and chief executive officer. quot;Our last six months speak for themselves - record trading volume,
the best new account growth in nine years, and net new assets growing at an annualized rate of 10 percent of
beginning client assets. We continue to manage for the other side of the cycle, taking advantage of our solid balance
sheet, excellent liquidity and successful business model.quot;
quot;Our organic growth remains steady and strong,quot; said Bill Gerber, executive vice president and chief financial officer.
quot;Despite a near-zero interest rate environment, our quarterly results remain solid. Looking forward, we will continue to
prudently manage our business, backed by a strong, conservative balance sheet. With three credit rating agency
upgrades to investment grade this quarter and our ongoing financial strength, we are in an excellent competitive
position in this difficult environment.quot;
Stock Buy-back Completed
In the second quarter TD AMERITRADE repurchased approximately 36 million shares of its company stock at an
average price of $11.88 per share. These transactions completed the Company's stock buy-back programs. The
Company has no immediate plans for additional share repurchases.
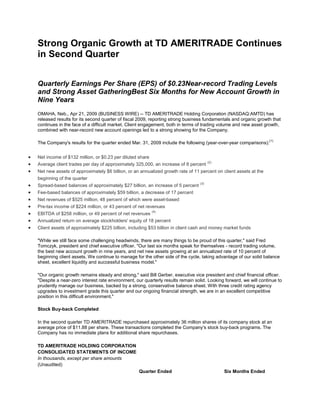
TD AMERITRADE HOLDING CORPORATION
CONSOLIDATED STATEMENTS OF INCOME
In thousands, except per share amounts
(Unaudited)
Quarter Ended Six Months Ended
2. Mar. 31, Dec. 31, Mar. 31, Mar. 31, Mar. 31,
2009 2008 2008 2009 2008
Revenues:
Transaction-based revenues:
Commissions and transaction fees $ 265,442 $ 287,113 $ 244,887 $ 552,555 $ 505,156
Asset-based revenues:
Interest revenue 70,242 92,514 210,833 162,756 461,043
Brokerage interest expense (2,837 ) (7,675 ) (72,956 ) (10,512 ) (174,075 )
Net interest revenue 67,405 84,839 137,877 152,244 286,968
Money market deposit account fees 136,537 163,230 156,085 299,767 311,925
Investment product fees 48,096 69,166 77,685 117,262 145,690
Total asset-based revenues 252,038 317,235 371,647 569,273 744,583
Other revenues 8,019 6,381 6,353 14,400 14,764
Net revenues 525,499 610,729 622,887 1,136,228 1,264,503
Expenses:
Employee compensation and benefits 120,808 117,390 132,113 238,197 238,128
Fair value adjustments of compensation-related
- - - - 764
derivative instruments
Clearing and execution costs 15,077 15,628 9,372 30,705 21,438
Communications 17,853 18,744 17,429 36,598 34,953
Occupancy and equipment costs 29,536 30,127 25,220 59,663 50,228
Depreciation and amortization 10,635 11,503 8,887 22,138 16,582
Amortization of acquired intangible assets 15,200 15,538 14,749 30,738 28,472
Professional services 22,069 27,339 28,580 49,408 47,862
Interest on borrowings 8,244 15,637 20,604 23,881 46,330
Other 8,720 11,564 18,669 20,284 31,039
Advertising 53,097 46,697 47,310 99,794 92,766
Total expenses 301,239 310,167 322,933 611,406 608,562
Income before other income and income taxes 224,260 300,562 299,954 524,822 655,941
Other income:
Gain on sale of investments - - - - 644
Pre-tax income 224,260 300,562 299,954 524,822 656,585
Provision for income taxes 92,230 116,164 113,238 208,394 229,030
Net income $ 132,030 $ 184,398 $ 186,716 $ 316,428 $ 427,555
Earnings per share - basic $ 0.23 $ 0.31 $ 0.31 $ 0.54 $ 0.72
Earnings per share - diluted $ 0.23 $ 0.31 $ 0.31 $ 0.54 $ 0.71
Weighted average shares outstanding - basic 573,519 591,748 594,339 582,734 594,629
Weighted average shares outstanding - diluted 581,284 600,601 603,470 591,048 603,932
TD AMERITRADE HOLDING CORPORATION
CONDENSED CONSOLIDATED BALANCE SHEETS
In thousands
(Unaudited)
Mar. 31, 2009 Sept. 30, 2008
Assets:
Cash and cash equivalents $ 1,072,642 $ 674,135
Short-term investments 78,738 369,133
Segregated cash and investments 2,978,441 260,000
Broker/dealer receivables 2,078,897 4,177,149
Client receivables 3,469,408 6,933,926
Goodwill and intangible assets 2,971,390 2,960,781
Other 464,724 576,398
Total assets $ 13,114,240 $ 15,951,522
3. Liabilities and stockholders' equity:
Liabilities:
Broker/dealer payables $ 2,390,172 $ 5,769,676
Client payables 5,705,720 5,070,671
Long-term debt 1,433,650 1,444,000
Other 801,154 742,137
Total liabilities 10,330,696 13,026,484
Stockholders' equity 2,783,544 2,925,038
Total liabilities and stockholders' equity $ 13,114,240 $ 15,951,522
TD AMERITRADE HOLDING CORPORATION
SELECTED OPERATING DATA
Quarter Ended Six Months Ended
Mar. 31, Dec. 31, Mar. 31, Mar. 31, Mar. 31,
2009 2008 2008 2009 2008
Key Metrics:
Net new assets (in billions) $6.4 $7.8 $6.9 $14.3 $16.0
(1)
Average client trades per day 324,837 357,294 300,986 341,327 306,294
Profitability Metrics:
Pre-tax income as a percentage of net
42.7 % 49.2 % 48.2 % 46.2 % 51.9 %
revenues
Return on client assets (annualized) 0.40 % 0.49 % 0.40 % 0.45 % 0.43 %
Return on average stockholder's equity
18.0 % 24.5 % 30.2 % 21.4 % 36.0 %
(annualized)
EBITDA as a percentage of net revenues 49.2 % 56.2 % 55.3 % 52.9 % 59.2 %
Debt Metrics:
Interest on borrowings (in millions) $8.2 $15.6 $20.6 $23.9 $46.3
Average debt outstanding (in billions) $1.4 $1.5 $1.5 $1.4 $1.5
Leverage ratio (average debt/annualized
1.4 1.1 1.1 1.2 1.0
EBITDA)
Interest coverage ratio (EBITDA/interest on
31.3 22.0 16.7 25.2 16.1
borrowings)
(1)
Transaction-Based Revenue Metrics :
Total trades (in millions) 19.8 22.5 18.4 42.3 38.0
Average commissions and transaction fees
$13.40 $12.76 $13.34 $13.06 $13.30
per trade
Average client trades per account
11.5 12.9 11.5 12.2 11.8
(annualized)
Activity rate - total accounts 4.6 % 5.1 % 4.6 % 4.8 % 4.7 %
Activity rate - funded accounts 6.4 % 7.2 % 6.4 % 6.8 % 6.6 %
Trading days 61.0 63.0 61.0 124.0 124.0
Spread-Based Asset Metrics:
Average interest-earning assets (excluding
$7.3 $7.5 $9.9 $7.4 $9.7
conduit business) (in billions)
Average money market deposit account
$19.3 $17.9 $15.5 $18.6 $15.4
balances (in billions)
Average spread-based balance (in billions) $26.6 $25.4 $25.4 $26.0 $25.1
Net interest revenue (excluding conduit
$66.7 $82.1 $134.9 $148.8 $280.9
business) (in millions)
Money market deposit account fee revenue
136.5 163.2 156.1 299.8 311.9
(in millions)
Spread-based revenue (in millions) $203.2 $245.3 $291.0 $448.6 $592.8
Avg. annualized yield - interest-earning
3.63 % 4.27 % 5.40 % 3.96 % 5.68 %
assets (excluding conduit business)
Avg. annualized yield - money market deposit 2.83 % 3.57 % 3.98 % 3.19 % 3.99 %
4. account fees
Net interest margin (NIM) 3.05 % 3.78 % 4.53 % 3.41 % 4.65 %
Interest days 90 92 91 182 183
Fee-Based Investment Metrics:
Average balance (in billions) $58.9 $62.8 $70.8 $60.9 $64.7
Investment product fee revenue (in millions) $48.1 $69.2 $77.7 $117.3 $145.7
Average annualized yield 0.33 % 0.43 % 0.43 % 0.38 % 0.44 %
Client Account and Client Asset Metrics:
Total accounts (beginning of period) 7,052,000 6,895,000 6,475,000 6,895,000 6,380,000
New accounts opened 194,000 217,000 214,000 410,000 363,000
Accounts purchased - - 102,000 - 102,000
Accounts closed (51,000 ) (60,000 ) (60,000 ) (110,000 ) (114,000 )
Total accounts (end of period) 7,195,000 7,052,000 6,731,000 7,195,000 6,731,000
Percentage change during period 2 %2 %4 %4 %6 %
Funded accounts (beginning of period) 5,013,000 4,918,000 4,643,000 4,918,000 4,597,000
Funded accounts (end of period) 5,105,000 5,013,000 4,814,000 5,105,000 4,814,000
Percentage change during period 2 %2 %4 %4 %5 %
Client assets (beginning of period, in billions) $233.8 $278.0 $300.4 $278.0 $302.7
Client assets (end of period, in billions) $224.9 $233.8 $306.1 $224.9 $306.1
Percentage change during period (4 %) (16 %) 2 % (19 %) 1 %
(1)
Effective in October 2007, total trades have been adjusted to exclude non-revenue generating mutual fund trades.
NOTE: See Glossary of Terms on the Company's web site at www.amtd.com for definitions of the above metrics.
TD AMERITRADE HOLDING CORPORATION
SELECTED OPERATING DATA
Quarter Ended Six Months Ended
Mar. 31, Dec. 31, Mar. 31, Mar. 31, Mar. 31,
2009 2008 2008 2009 2008
Net Interest Revenue (excluding Conduit Business):
Segregated cash:
Average balance (in billions) $2.0 $1.7 $0.0 $1.8 $0.0
Average annualized yield 0.14 % 0.38 % 3.73 % 0.25 % 3.76 %
Interest revenue (in millions) $0.7 $1.6 $0.2 $2.3 $0.2
Client margin balances:
Average balance (in billions) $3.9 $4.5 $8.1 $4.2 $8.3
Average annualized yield 5.13 % 5.64 % 6.61 % 5.40 % 7.03 %
Interest revenue (in millions) $49.7 $64.8 $135.8 $114.5 $297.9
Securities borrowing/lending (excluding conduit
business):
Average securities borrowing balance (in billions) $0.3 $0.2 $0.4 $0.3 $0.5
Average securities lending balance (in billions) $0.9 $1.3 $3.3 $1.1 $3.4
Interest revenue (in millions) $16.1 $17.2 $12.0 $33.4 $21.4
Interest expense (in millions) (0.3 ) (1.6 ) (16.0 ) (2.0 ) (38.7 )
Net interest revenue (expense) - securities
borrowing/lending (excluding conduit business) (in $15.8 $15.6 ($4.0 ) $31.4 ($17.3 )
millions)
Other cash and interest earning investments:
Average balance (in billions) $1.1 $1.1 $1.4 $1.1 $0.9
Average annualized yield 0.36 % 0.63 % 3.07 % 0.49 % 3.53 %
Interest revenue - net (in millions) $1.1 $1.7 $10.4 $2.9 $17.2
Client credit balances:
Average balance (in billions) $4.2 $4.2 $4.4 $4.2 $4.0
Average annualized cost 0.06 % 0.15 % 0.68 % 0.11 % 0.85 %
Interest expense (in millions) ($0.6 ) ($1.6 ) ($7.5 ) ($2.3 ) ($17.1 )
5. Average interest-earning assets (excluding conduit
$7.3 $7.5 $9.9 $7.4 $9.7
business) (in billions)
Average annualized yield (excluding conduit business) 3.63 % 4.27 % 5.40 % 3.96 % 5.68 %
Net interest revenue (excluding conduit business) (in
$66.7 $82.1 $134.9 $148.8 $280.9
millions)
Conduit Business:
Average balance (in billions) $1.4 $1.6 $5.8 $1.5 $5.9
Securities borrowing - conduit business:
Average annualized yield 0.62 % 1.56 % 3.29 % 1.12 % 3.95 %
Interest revenue (in millions) $2.2 $6.4 $47.9 $8.6 $119.3
Securities lending - conduit business:
Average annualized cost 0.42 % 0.90 % 3.08 % 0.68 % 3.75 %
Interest expense (in millions) ($1.5 ) ($3.7 ) ($44.9 ) ($5.2 ) ($113.2 )
Average interest-earning assets - conduit business (in
$1.4 $1.6 $5.8 $1.5 $5.9
billions)
Average annualized yield - conduit business 0.20 % 0.65 % 0.21 % 0.44 % 0.20 %
Net interest revenue - conduit business (in millions) $0.7 $2.7 $3.0 $3.4 $6.1
Net Interest Revenue (total):
Average interest-earning assets (excluding conduit
$7.3 $7.5 $9.9 $7.4 $9.7
business) (in billions)
Average interest-earning assets - conduit business (in
1.4 1.6 5.8 1.5 5.9
billions)
Average interest-earning assets - total (in billions) $8.7 $9.1 $15.7 $8.9 $15.6
Average annualized yield - total 3.07 % 3.63 % 3.49 % 3.36 % 3.60 %
Net interest revenue (excluding conduit business) (in
$66.7 $82.1 $134.9 $148.8 $280.9
millions)
Net interest revenue - conduit business (in millions) 0.7 2.7 3.0 3.4 6.1
Net interest revenue - total (in millions) $67.4 $84.8 $137.9 $152.2 $287.0
NOTE: See Glossary of Terms on the Company's web site at www.amtd.com for definitions of the above metrics.
TD AMERITRADE HOLDING CORPORATION
RECONCILIATION OF FINANCIAL MEASURES
In thousands, except percentages
(Unaudited)
Quarter Ended Six Months Ended
Mar. 31, 2009 Dec. 31, 2008 Mar. 31, 2008 Mar. 31, 2009 Mar. 31, 2008
% of % of % of % of % of
$ $ $ $ $
Rev. Rev. Rev. Rev. Rev.
EBITDA (1)
EBITDA $ 258,339 49.2 % $ 343,240 56.2 % $ 344,194 55.3 % $ 601,579 52.9 % $ 747,969 59.2 %
Less:
Depreciation
and (10,635 ) (2.0 %) (11,503 ) (1.9 %) (8,887 ) (1.4 %) (22,138 ) (1.9 %) (16,582 ) (1.3 %)
amortization
Amortization
of acquired
(15,200 ) (2.9 %) (15,538 ) (2.5 %) (14,749 ) (2.4 %) (30,738 ) (2.7 %) (28,472 ) (2.3 %)
intangible
assets
Interest on
(8,244 ) (1.6 %) (15,637 ) (2.6 %) (20,604 ) (3.3 %) (23,881 ) (2.1 %) (46,330 ) (3.7 %)
borrowings
Pre-tax
$ 224,260 42.7 % $ 300,562 49.2 % $ 299,954 48.2 % $ 524,822 46.2 % $ 656,585 51.9 %
income
Note: The term quot;GAAPquot; in the following explanation refers to generally accepted accounting principles in the United
States.
(1) EBITDA (earnings before interest, taxes, depreciation and amortization) is considered a Non-GAAP financial
measure as defined by SEC Regulation G. We consider EBITDA an important measure of our financial performance
6. and of our ability to generate cash flows to service debt, fund capital expenditures and fund other corporate investing
and financing activities. EBITDA is used as the denominator in the consolidated leverage ratio calculation for our
senior credit facilities. The consolidated leverage ratio determines the interest rate margin charged on the senior
credit facilities. EBITDA eliminates the non-cash effect of tangible asset depreciation and amortization and intangible
asset amortization. EBITDA should be considered in addition to, rather than as a substitute for, pre-tax income, net
income and cash flows from operating activities.
SOURCE: TD AMERITRADE Holding Corporation
TD AMERITRADE Holding Corporation
For Media:
Manager, Communications
Kim Hillyer, 402-574-6523
kim.hillyer@tdameritrade.com
or
For Investors:
Director, Finance and Investor Relations
Jeff Goeser, 402-597-8464
jeffrey.goeser@tdameritrade.com
Company Hosts Conference Call
TD AMERITRADE will host its March Quarter conference call this morning, April 21, 2009, at 7:30 a.m. CDT.
Participants may listen to the call by dialing 877-795-3635. Interested parties may listen to a replay of the call by
dialing 888-203-1112 and the passcode 4285770. The Company will Webcast the conference call live at
www.amtd.com and will make all accompanying materials available for participants to print prior to the call.
AMTD-E
About TD AMERITRADE Holding Corporation
(5)
TD AMERITRADE Holding Corporation, through its brokerage subsidiaries, provides a dynamic balance of
investment products and services that make it the investment firm of choice for millions of retail investor and
independent registered investment advisor (RIA) clients. Listed by Forbes as one of America's best big companies,
the Company offers a full spectrum of investment services, including a leading active trader program, intuitive long-
term investment solutions and a national branch system, as well as relationships with one of the largest independent
(6)
RIA networks. The Company's common stock trades under the ticker symbol AMTD. For more information, please
visit www.amtd.com.
Safe Harbor
This document contains forward-looking statements within the meaning of the federal securities laws. We intend
these forward-looking statements to be covered by the safe harbor provisions of the federal securities laws. In
particular, any projections regarding our future revenues, expenses, earnings, capital expenditures, effective tax
rates, client trading activity, benefits of the proposed acquisition of thinkorswim, accounts or stock price, as well as
the assumptions on which such expectations are based, are forward-looking statements. These statements reflect
only our current expectations and are not guarantees of future performance or results. These statements involve
risks, uncertainties and assumptions that could cause actual results or performance to differ materially from those
contained in the forward-looking statements. These risks, uncertainties and assumptions include general economic
and political conditions, interest rates, market fluctuations and changes in client trading activity, increased
competition, systems failures and capacity constraints, ability to service debt obligations, ability to obtain regulatory
and shareholder approval for the proposed acquisition of thinkorswim and thereafter realize the expected benefits
from the thinkorswim acquisition, regulatory and legal matters and uncertainties and other risk factors described in
our latest Annual Report on Form 10-K, filed with the SEC on Nov. 26, 2008, and our latest Quarterly Report on Form
10-Q filed thereafter. These forward-looking statements speak only as of the date on which the statements were
7. made. We undertake no obligation to update or revise publicly any forward-looking statements, whether as a result of
new information, future events or otherwise.
(1)
Please see the Glossary of Terms, located in quot;Investorquot; section of www.amtd.com for more information on how
these metrics are calculated.
(2)
Beginning with fiscal 2009, Average Trades Per Day were adjusted to exclude non-revenue-generating mutual
fund trades. For comparability purposes, metrics for all periods in fiscal 2008 have been adjusted to account for this
change. More information is available on www.amtd.com.
(3)
Effective with the September 2008 quarter, spread-based assets excludes securities borrowing conduit-based
assets. For comparability purposes, metrics for all periods in fiscal 2008 have been adjusted to account for this
change.
(4)
See attached reconciliation of non-GAAP financial measures.
(5)
TD AMERITRADE, Inc., member FINRA (www.finra.org) /SIPC (www.SIPC.org), receives clearing and custodial
services from TD AMERITRADE Clearing, Inc., member FINRA/SIPC. TD AMERITRADE and TD AMERITRADE
Clearing, Inc. are subsidiaries of TD AMERITRADE Holding Corporation.
(6)
More info on the Forbes award is available at www.forbes.com/platinum.