Download to read offline


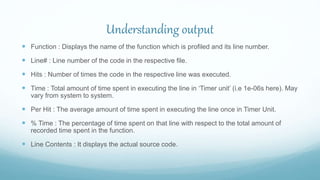
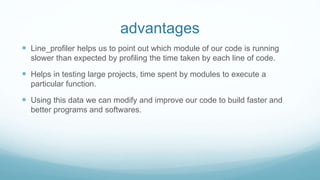


Profiling analyzes programs to measure memory usage, function call frequency and duration, and time complexity. Python profiling tools include line_profiler and memory_profiler. Line_profiler was initially released in 2008 and measures the time spent on each line of code. It helps identify slow parts of code so developers can optimize performance. The line_profiler output displays the function, line number, number of hits, time per hit, and percentage of time to help analyze profiled code.


![[ CNCF Q1 2024 ] Intro to Continuous Profiling and Grafana Pyroscope.pdf](https://cdn.slidesharecdn.com/ss_thumbnails/cncfq12024introtocontinuousprofilingandgrafanapyroscope-240407162420-9c15afb7-thumbnail.jpg?width=640&height=640&fit=bounds)