Downloaded 465 times


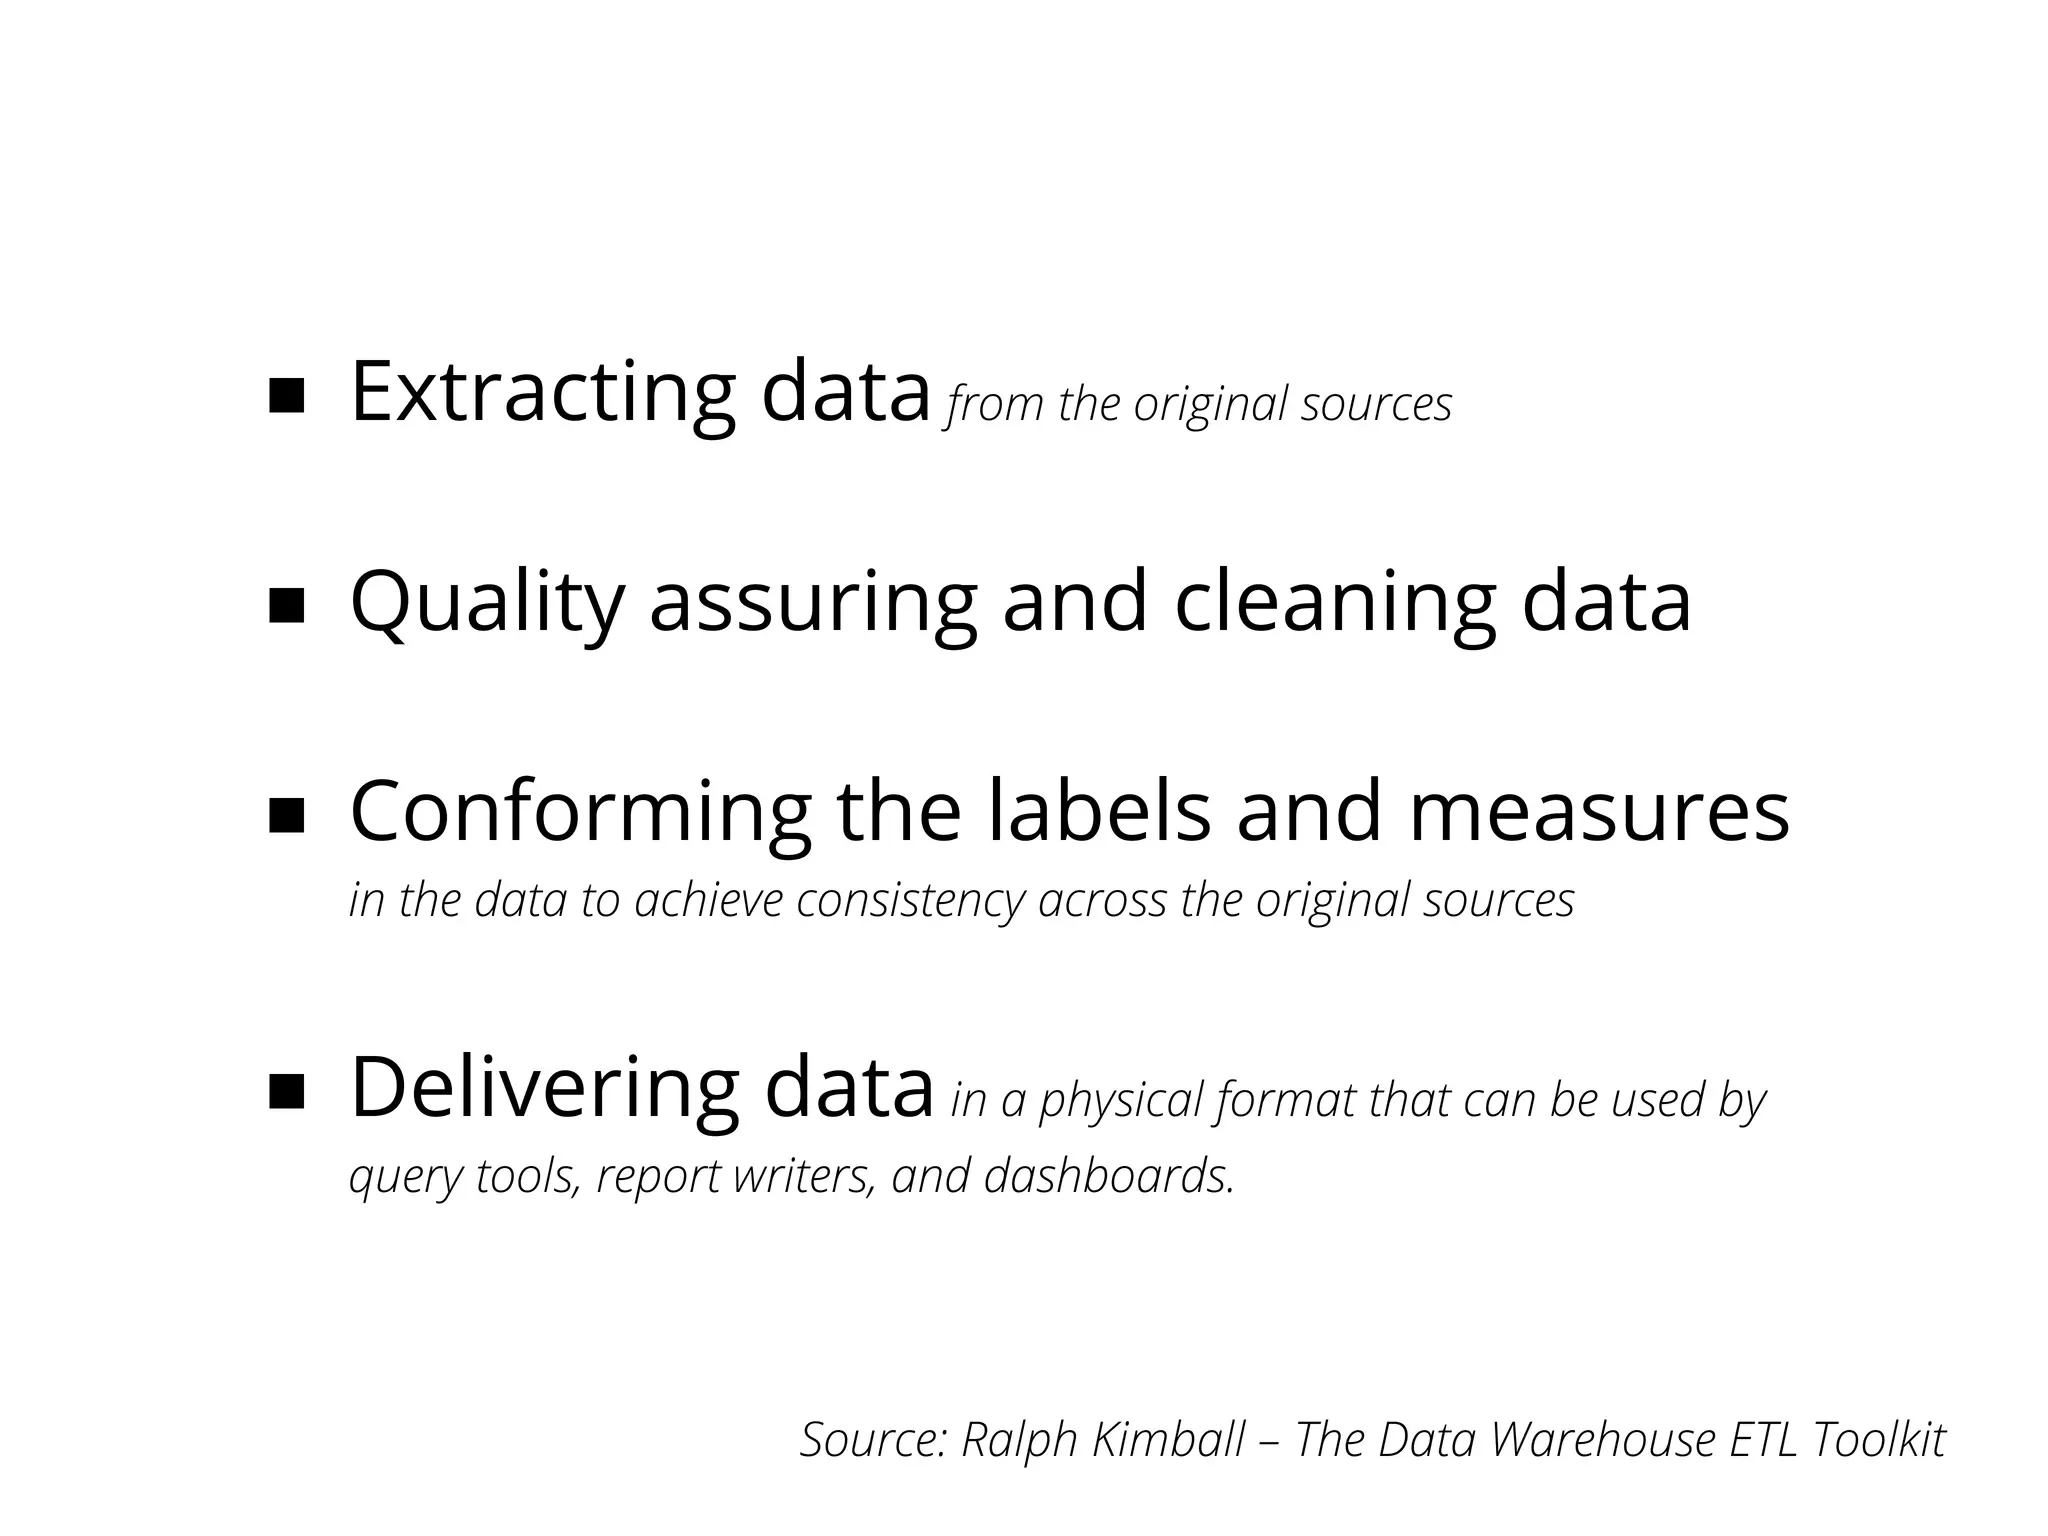

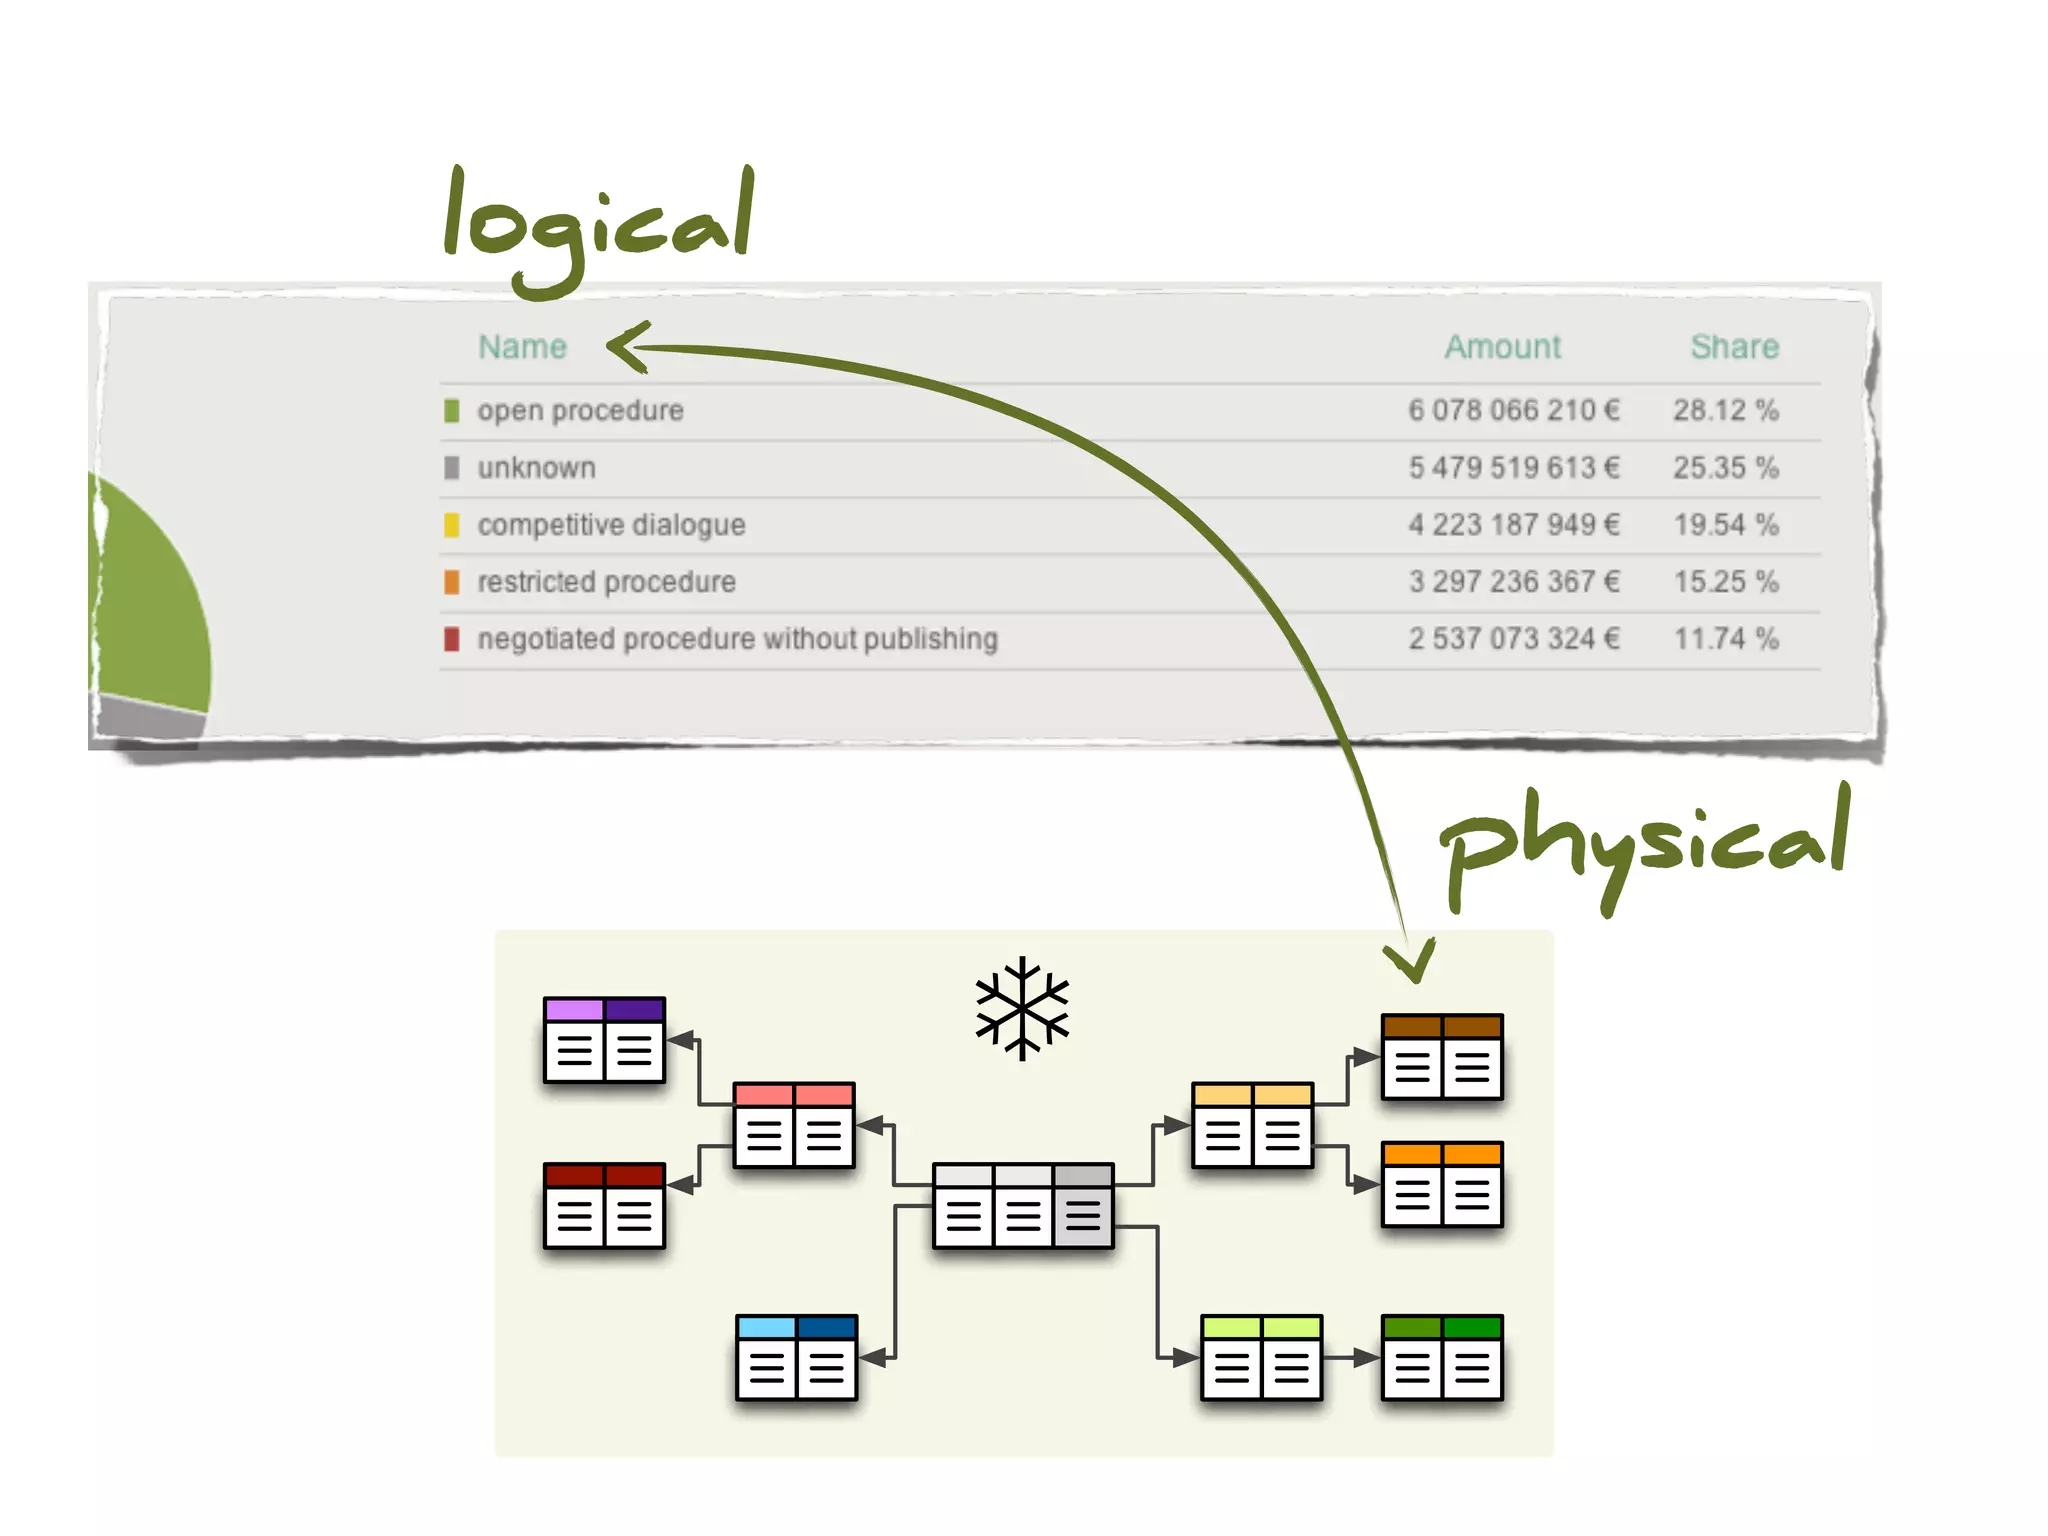
![Scientific Data
T1[s] T2[s] T3[s] T4[s]
P1 112,68 941,67 171,01 660,48
P2 96,15 306,51 725,88 877,82
P3 313,39 189,31 41,81 428,68
P4 760,62 983,48 371,21 281,19
P5 838,56 39,27 389,42 231,12
n-dimensional array of numbers](https://image.slidesharecdn.com/pythonbusinessintelligencecubes-pydata2012-121203161809-phpapp02/75/Python-business-intelligence-PyData-2012-talk-26-2048.jpg)

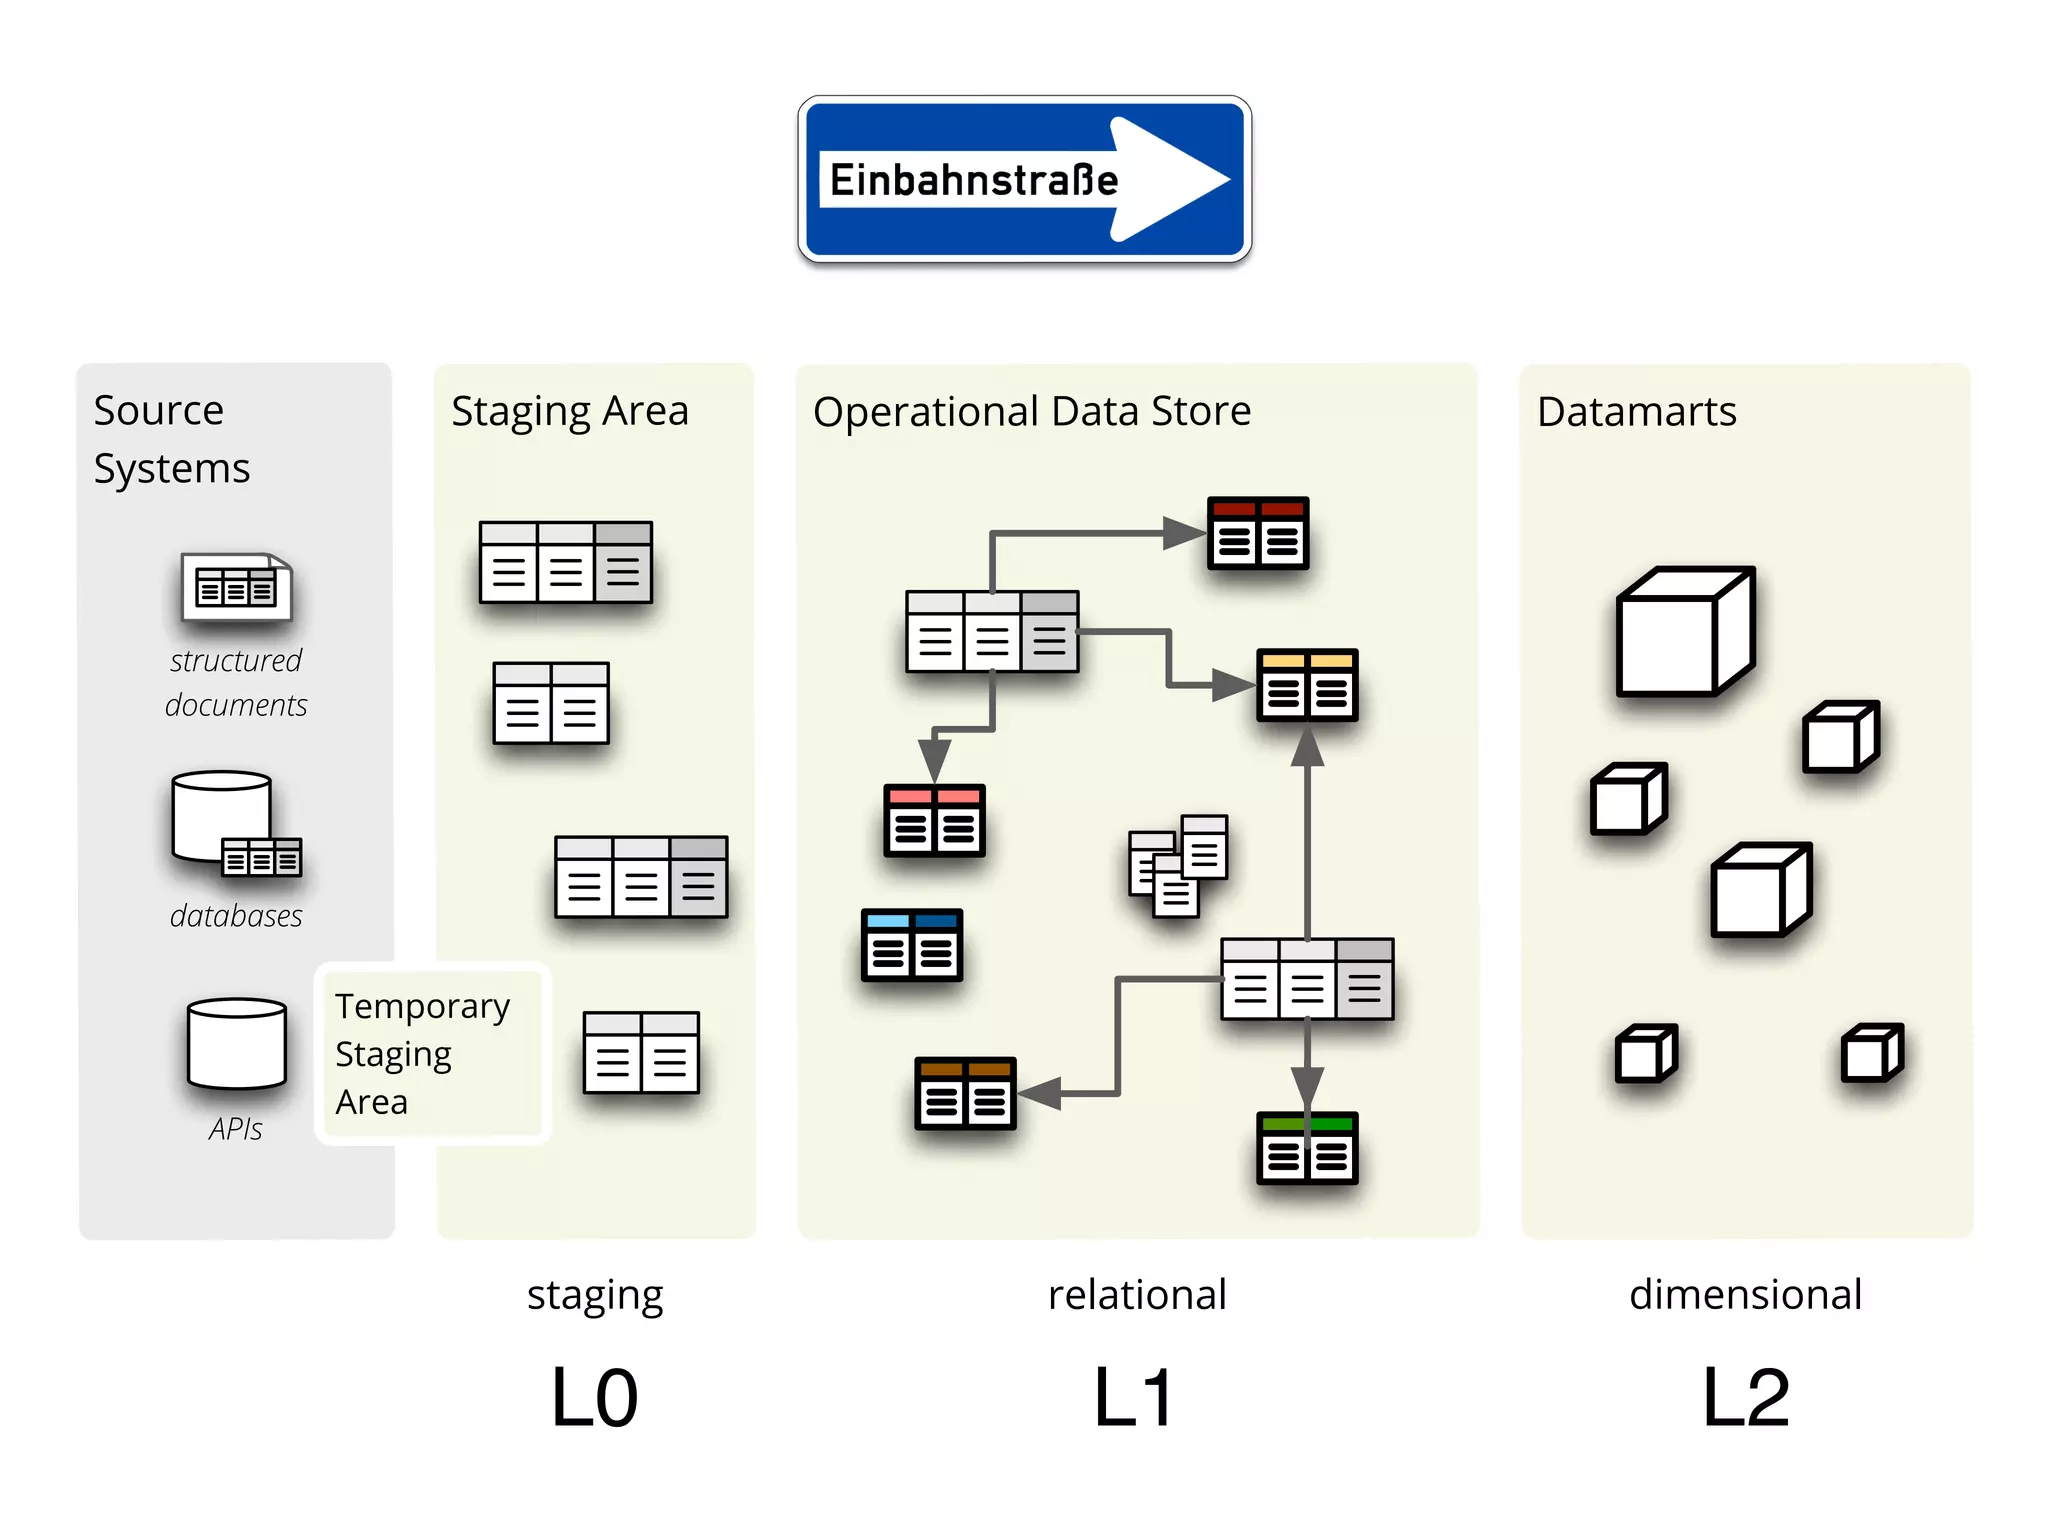
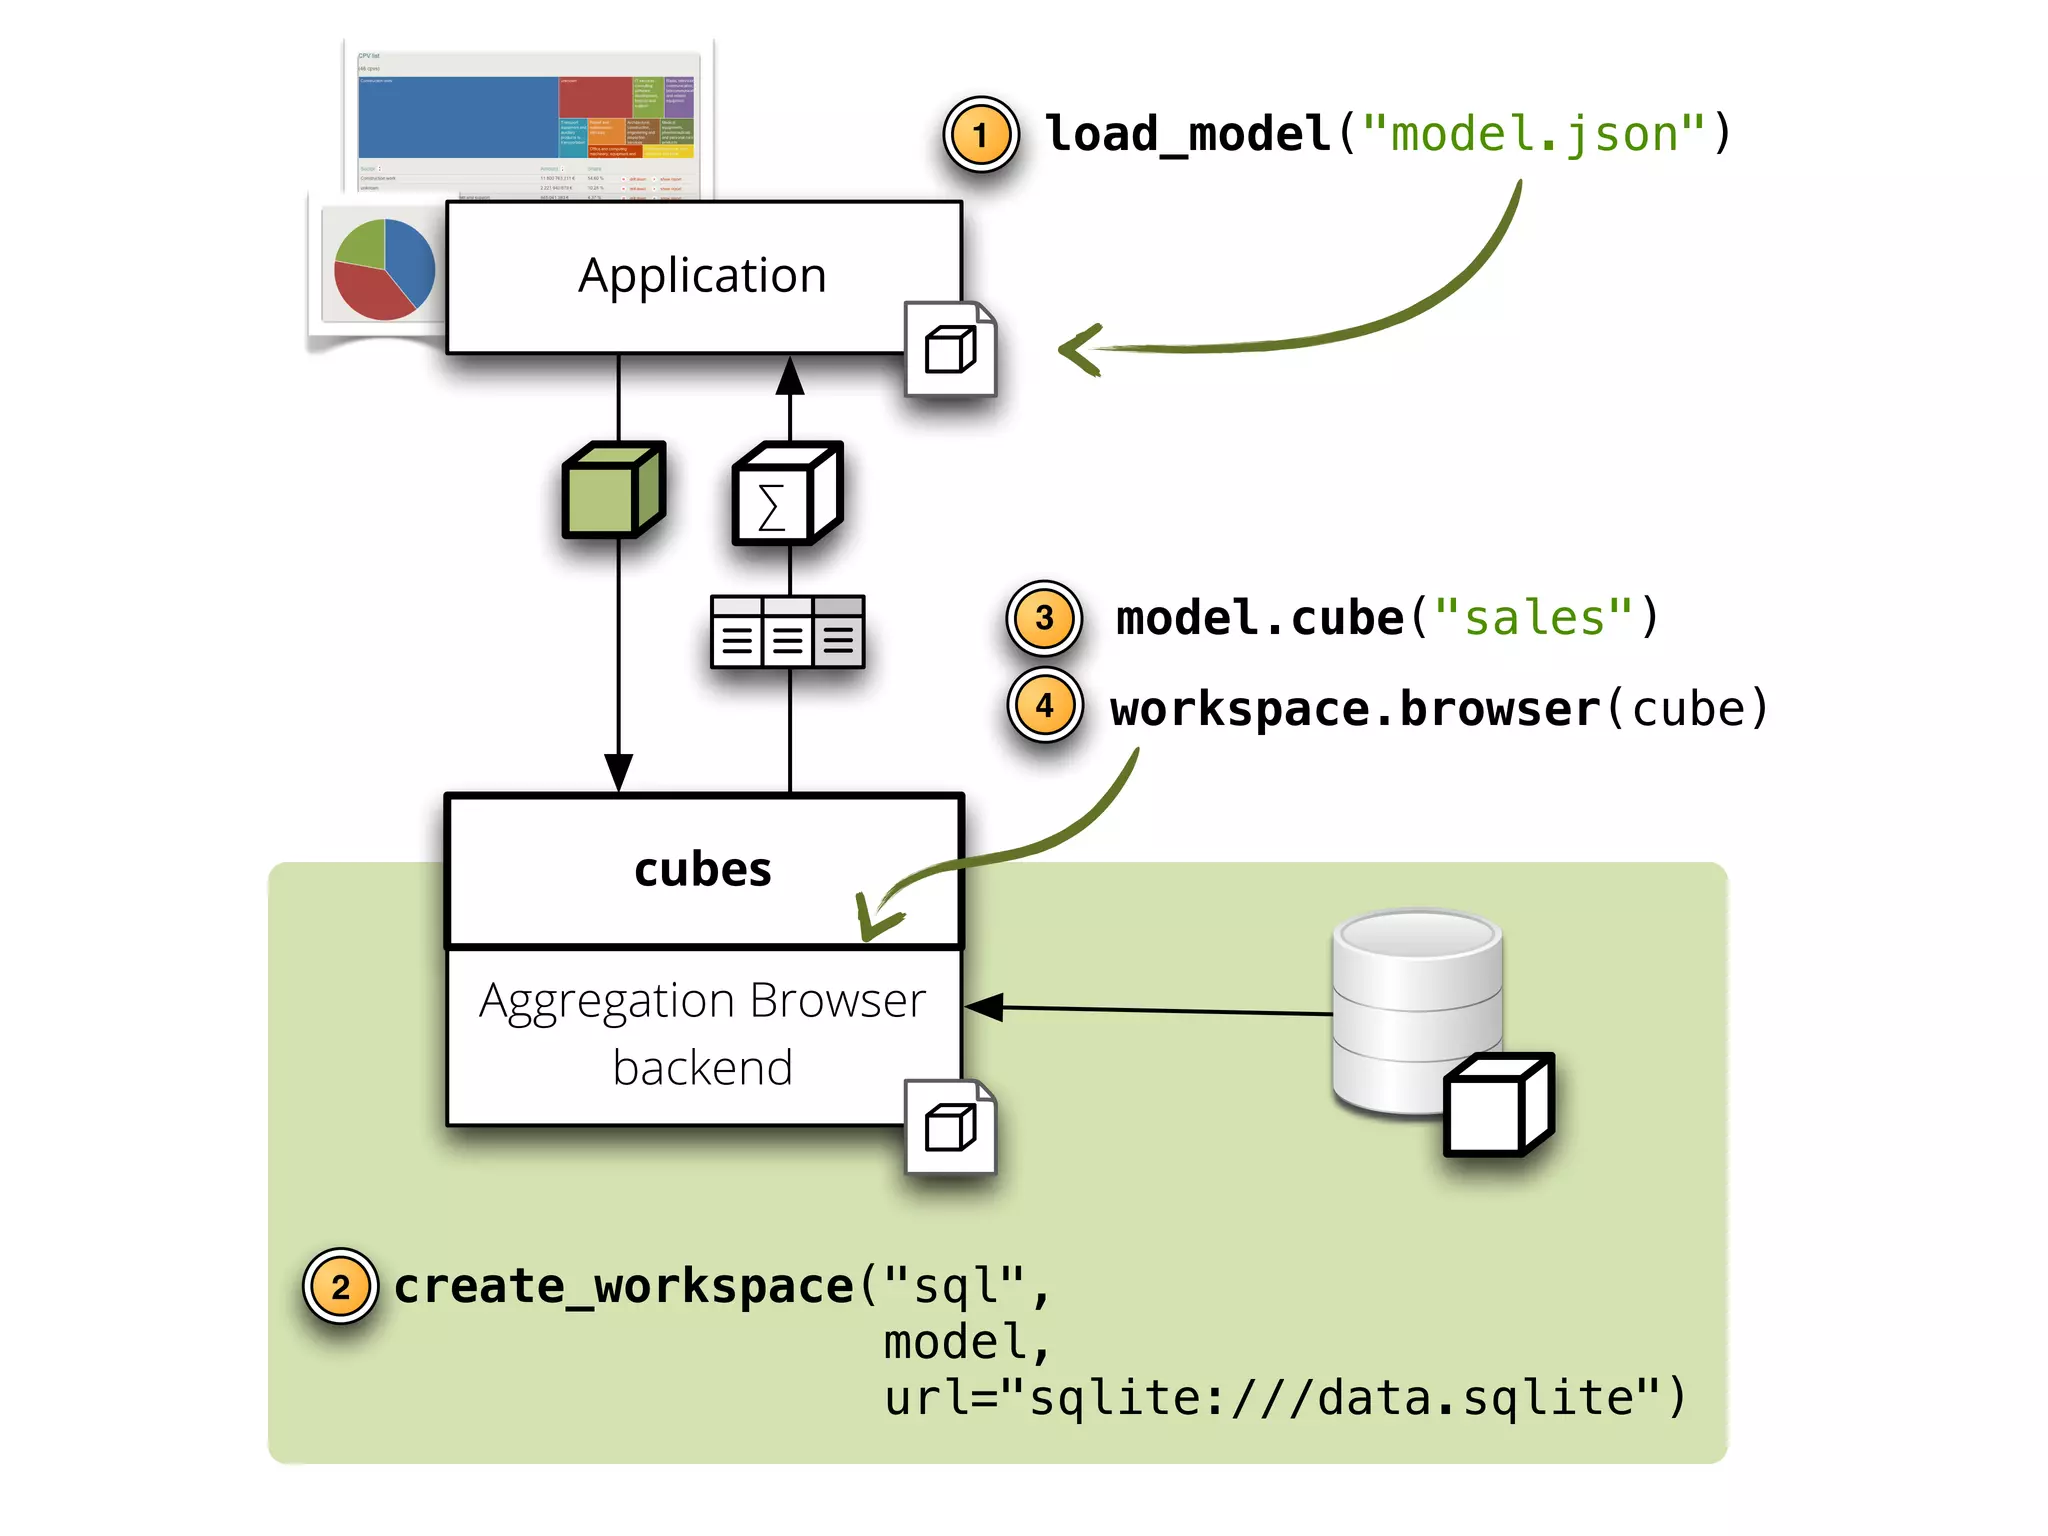
![transformation = [
('fiscal_year', {"w function": int,
". field":"fiscal_year"}),
('region_code', {"4 mapping": region_map,
". field":"region"}),
('borrower_country', None),
('project_name', None),
('procurement_type', None),
('major_sector_code', {"4 mapping": sector_code_map,
". field":"major_sector"}),
('major_sector', None),
('supplier', None),
('contract_amount', {"w function": currency_to_number,
". field": 'total_contract_amount'}
]
target fields source transformations](https://image.slidesharecdn.com/pythonbusinessintelligencecubes-pydata2012-121203161809-phpapp02/75/Python-business-intelligence-PyData-2012-talk-40-2048.jpg)
![Model
{
“name” = “My Model”
“description” = ....
“cubes” = [...]
“dimensions” = [...]
}
cubes dimensions
measures levels, attributes, hierarchy](https://image.slidesharecdn.com/pythonbusinessintelligencecubes-pydata2012-121203161809-phpapp02/75/Python-business-intelligence-PyData-2012-talk-43-2048.jpg)
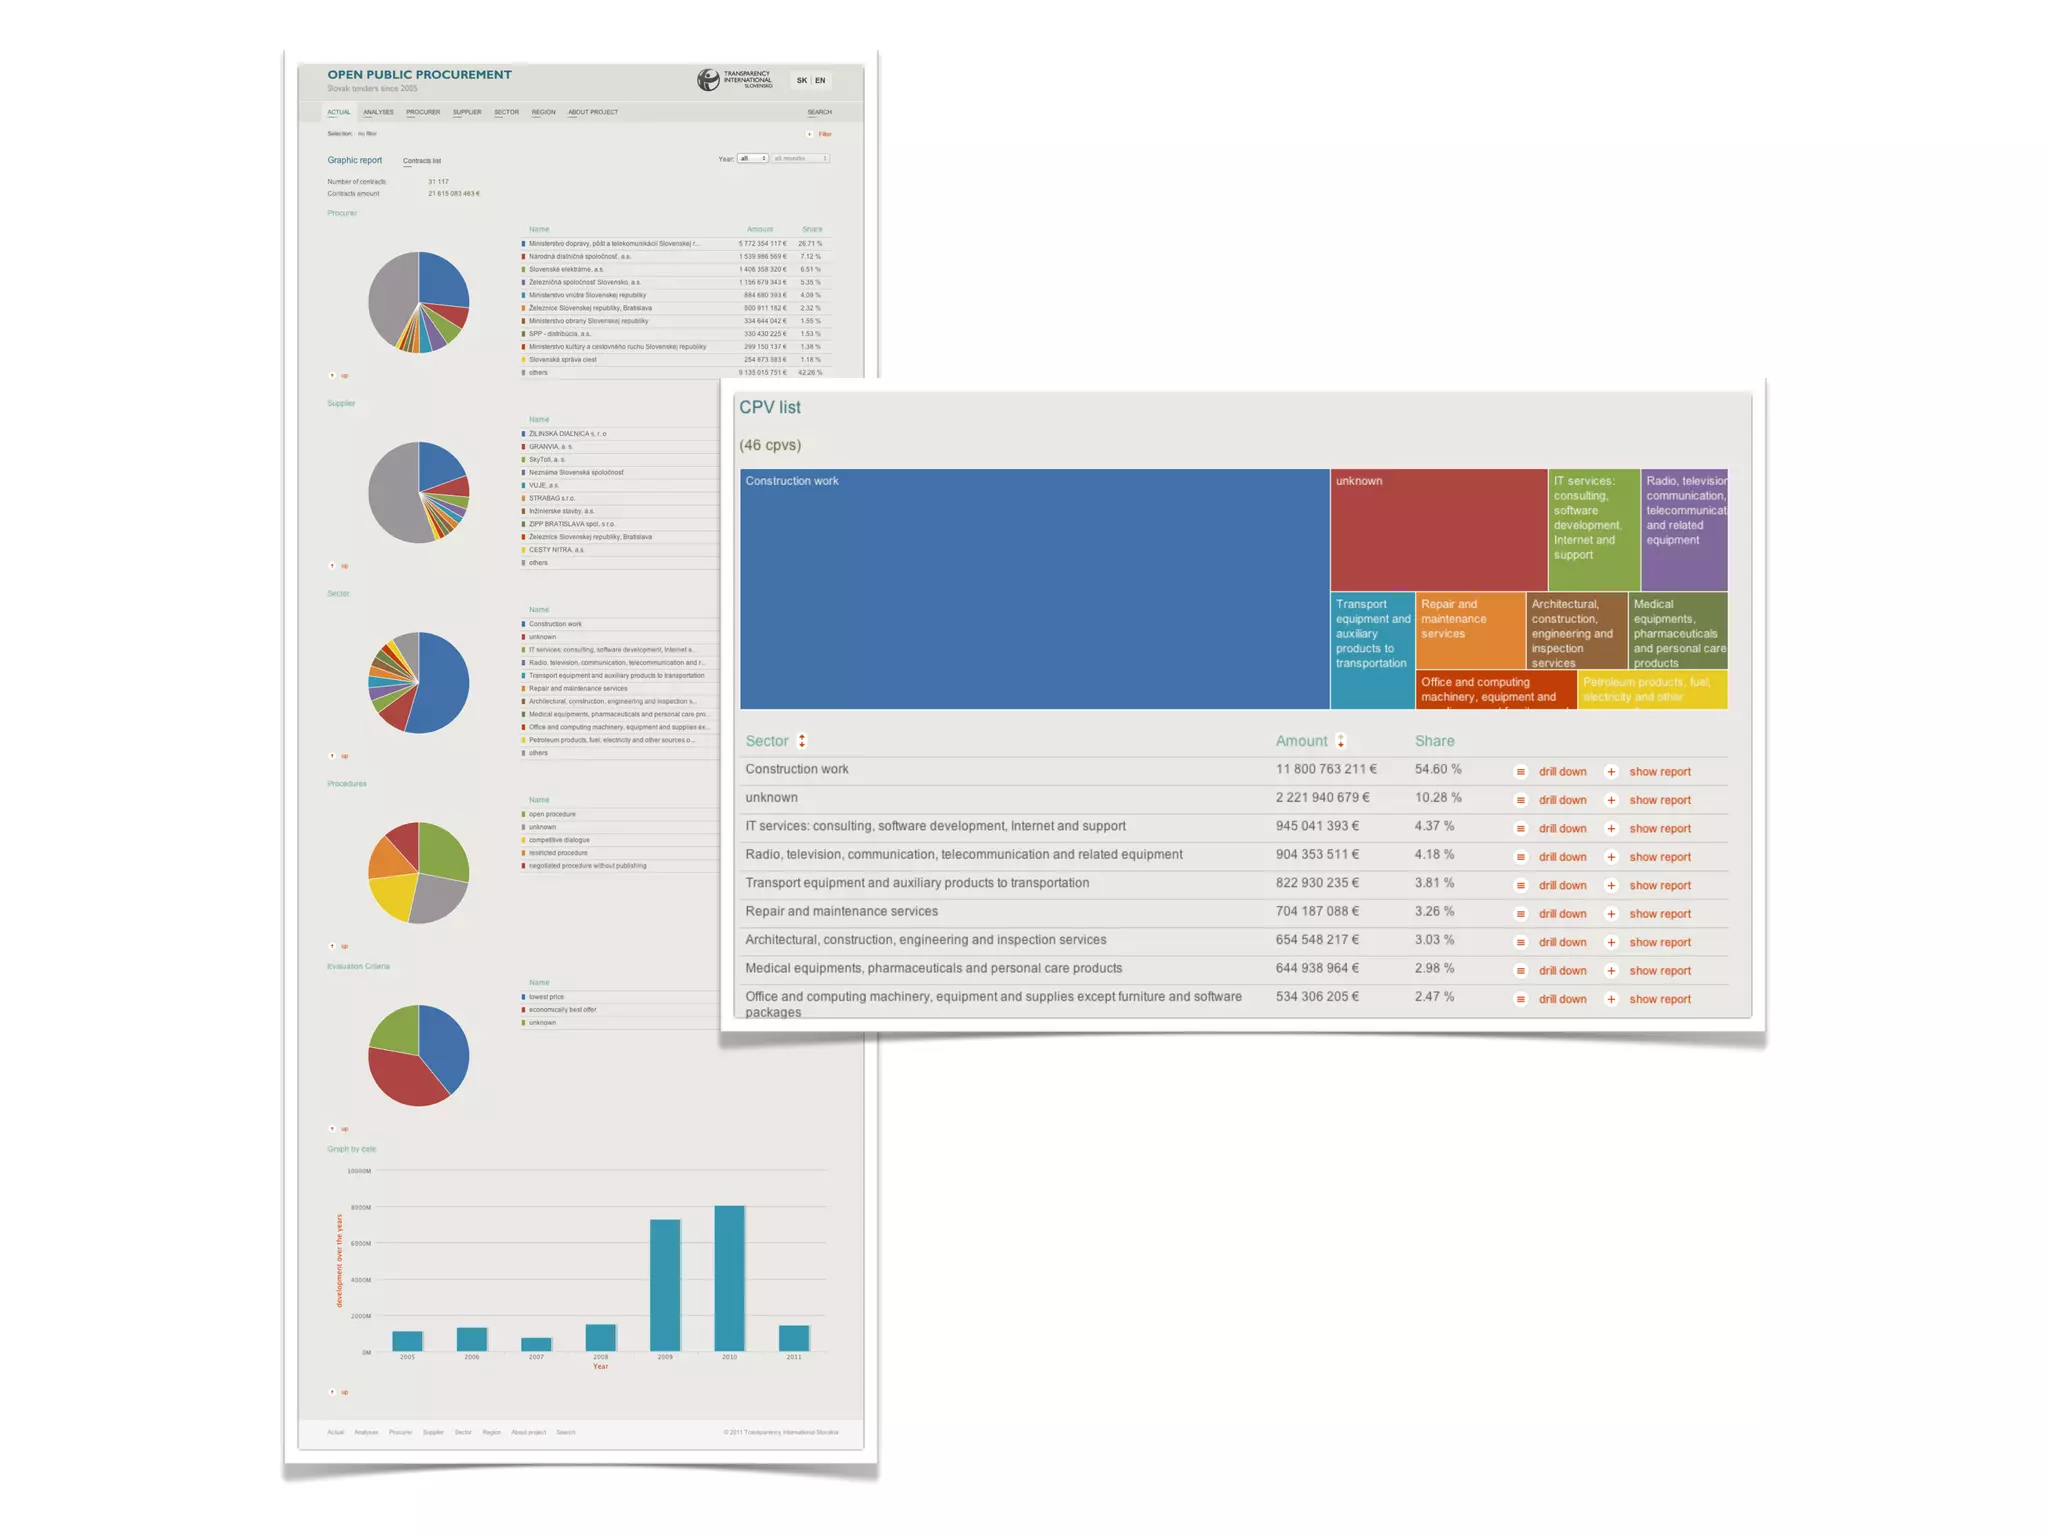
![browser.aggregate(o cell,
. drilldown=[9 "sector"])
drill-down](https://image.slidesharecdn.com/pythonbusinessintelligencecubes-pydata2012-121203161809-phpapp02/75/Python-business-intelligence-PyData-2012-talk-46-2048.jpg)
![for row in result.table_rows(“sector”):
row.record["amount_sum"]
q row.label k row.key](https://image.slidesharecdn.com/pythonbusinessintelligencecubes-pydata2012-121203161809-phpapp02/75/Python-business-intelligence-PyData-2012-talk-47-2048.jpg)
![whole cube
o cell = Cell(cube)
browser.aggregate(o cell)
Total
browser.aggregate(o cell,
drilldown=[9 “date”])
2006 2007 2008 2009 2010
✂ cut = PointCut(9 “date”, [2010])
o cell = o cell.slice(✂ cut)
browser.aggregate(o cell,
drilldown=[9 “date”])
Jan Feb Mar Apr March April May ...](https://image.slidesharecdn.com/pythonbusinessintelligencecubes-pydata2012-121203161809-phpapp02/75/Python-business-intelligence-PyData-2012-talk-48-2048.jpg)
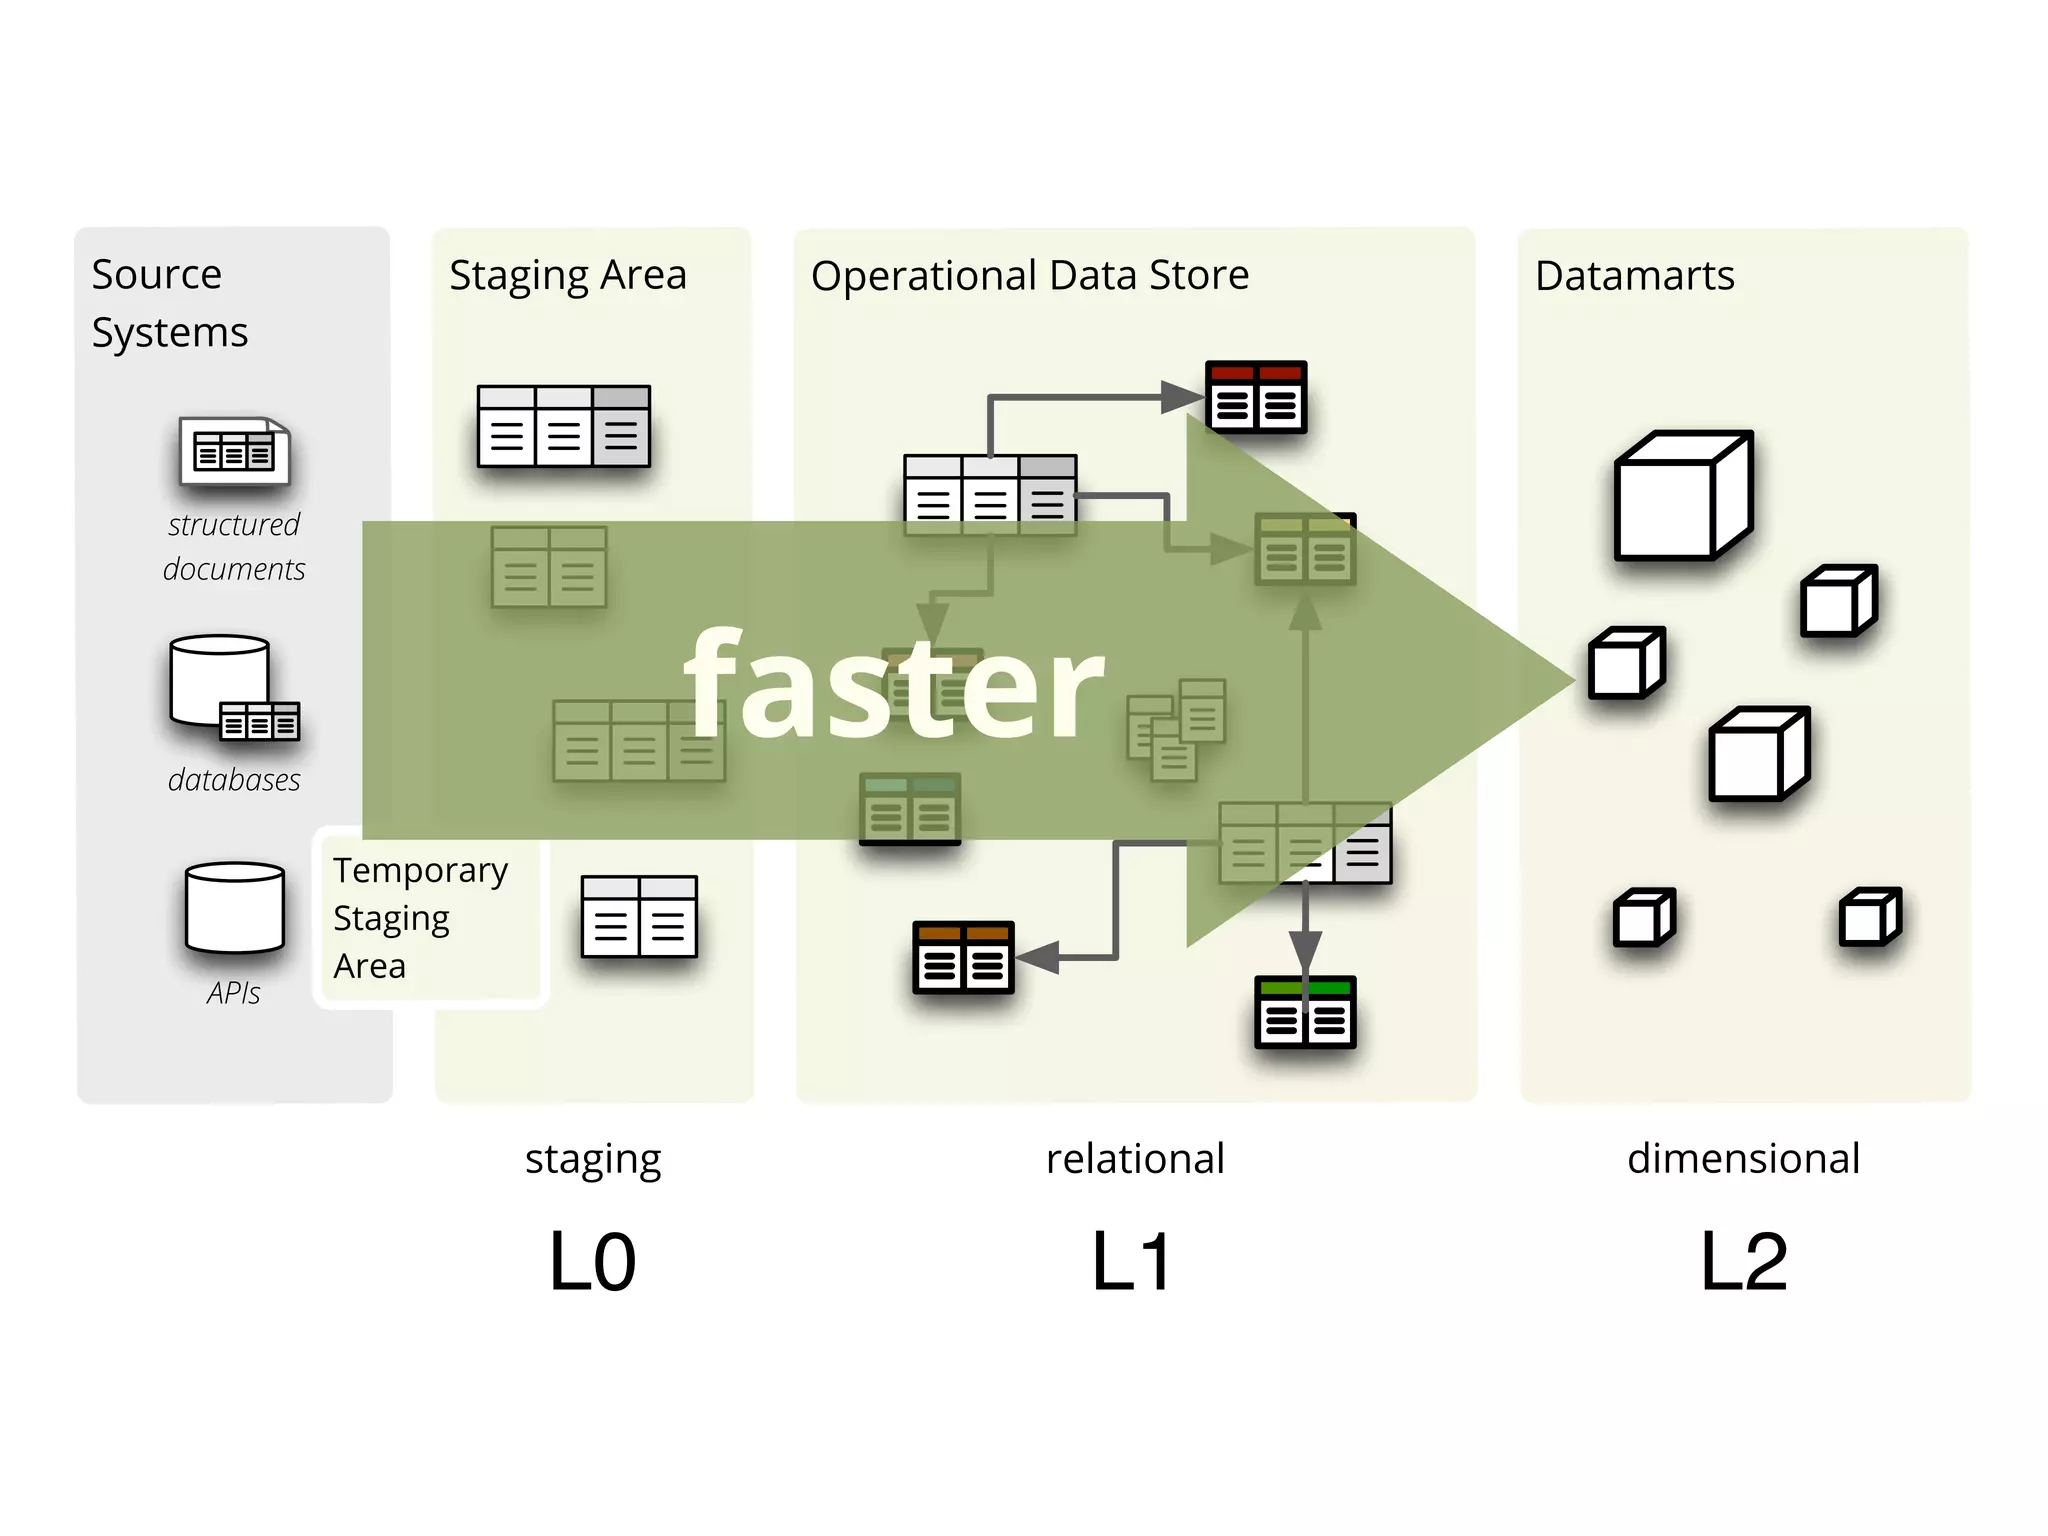
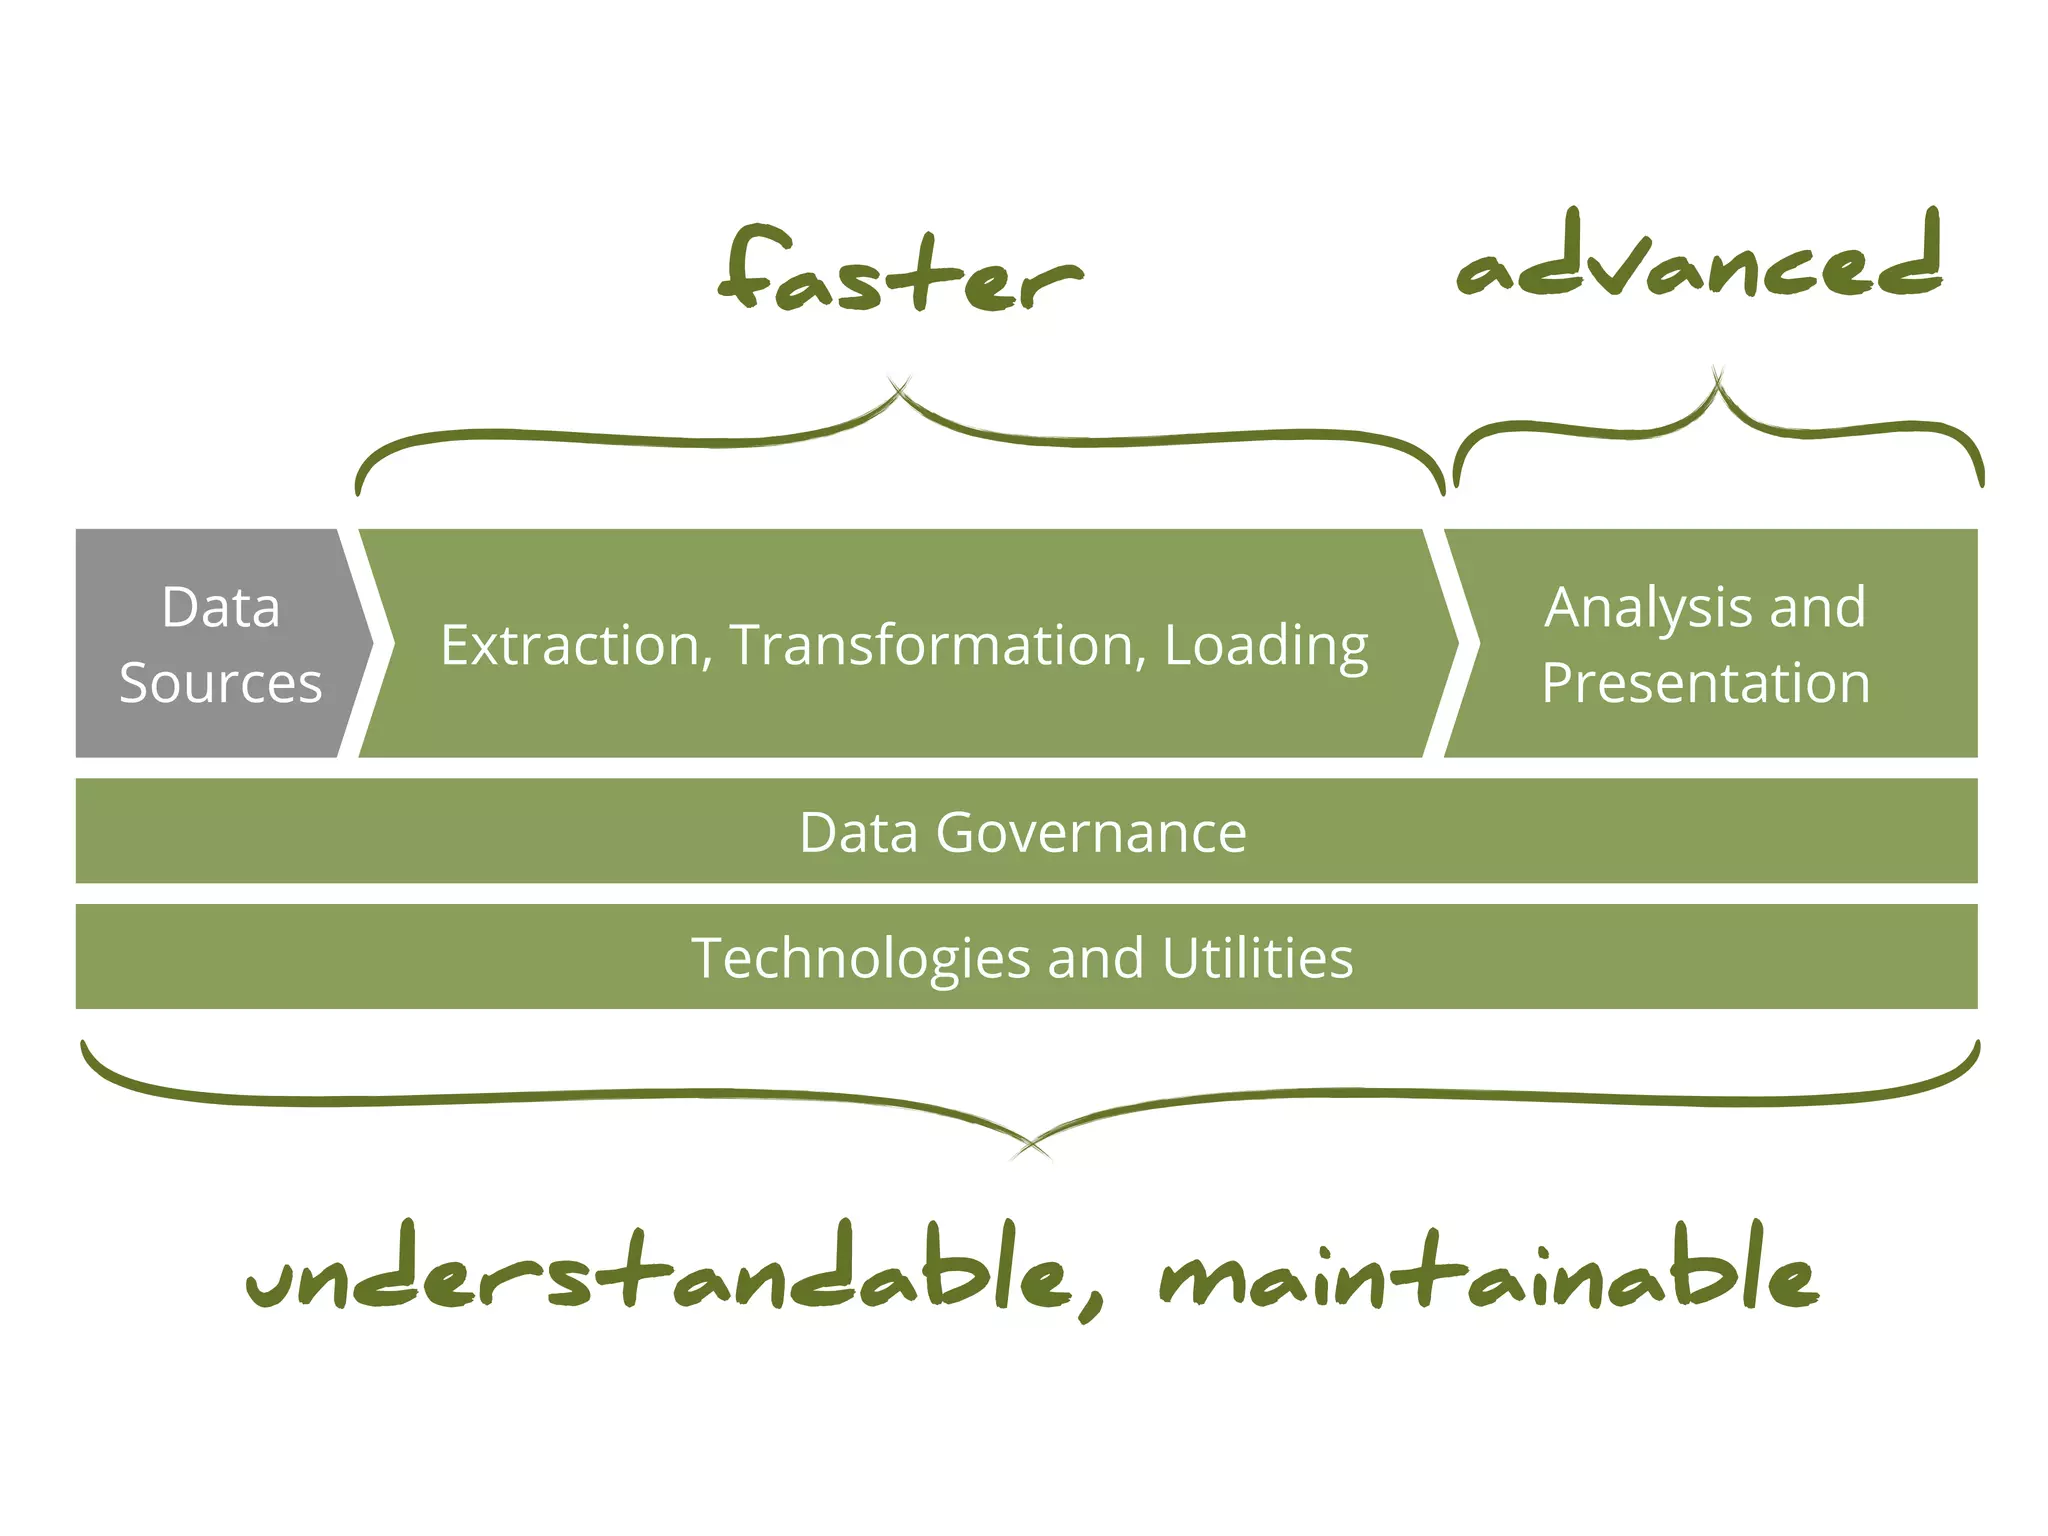

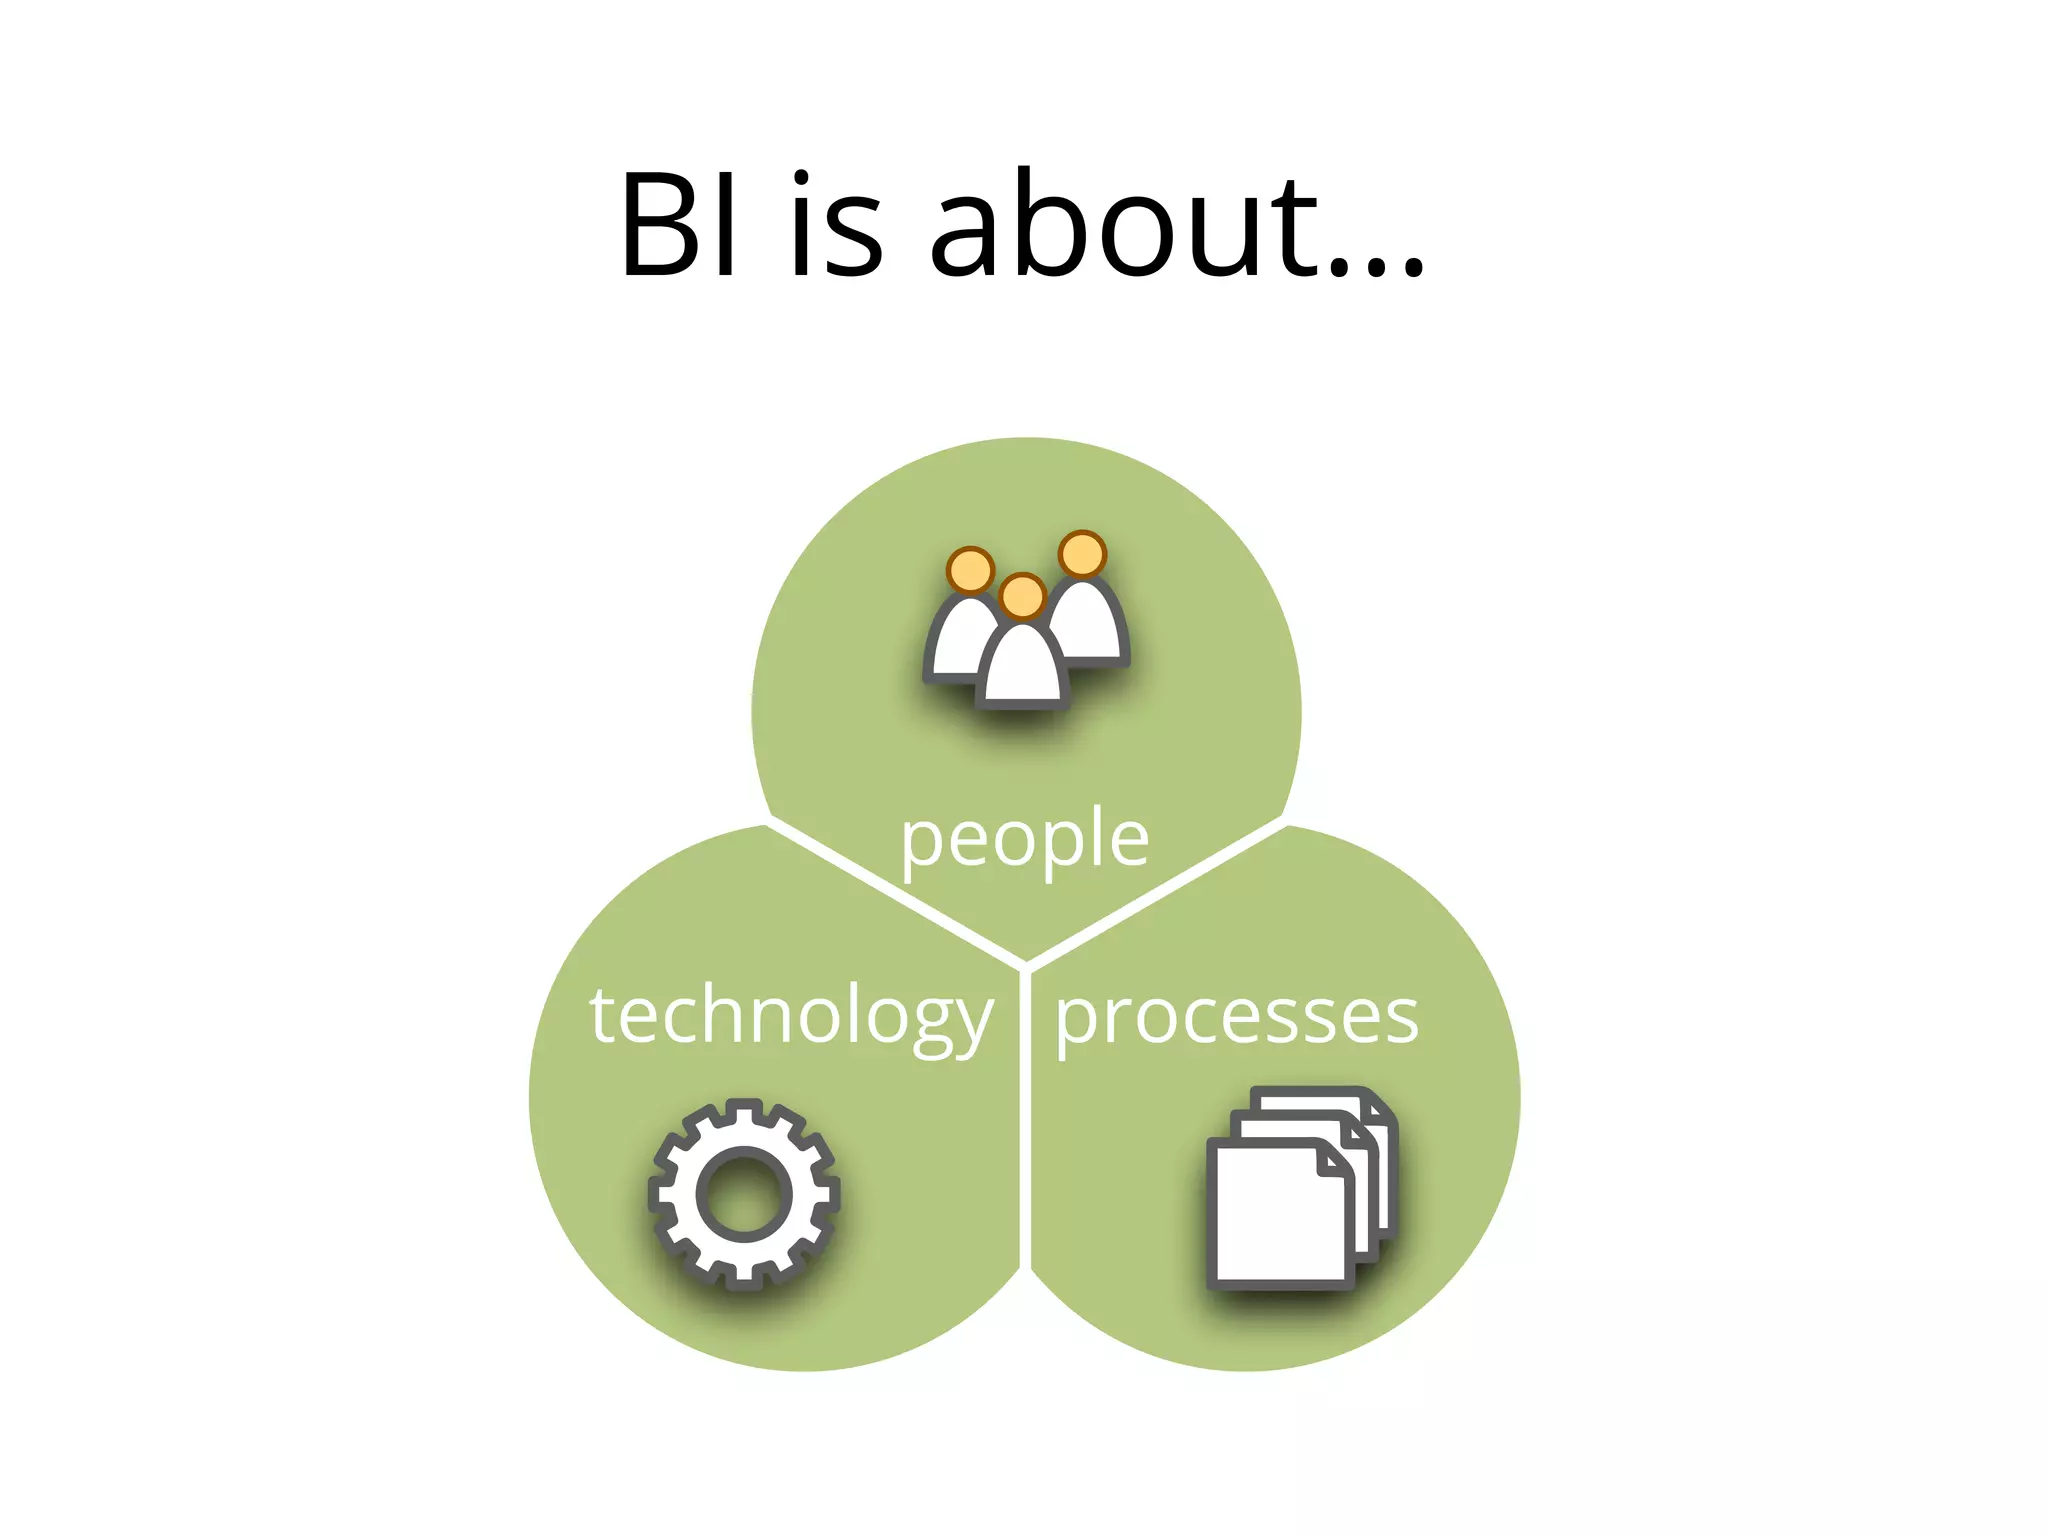


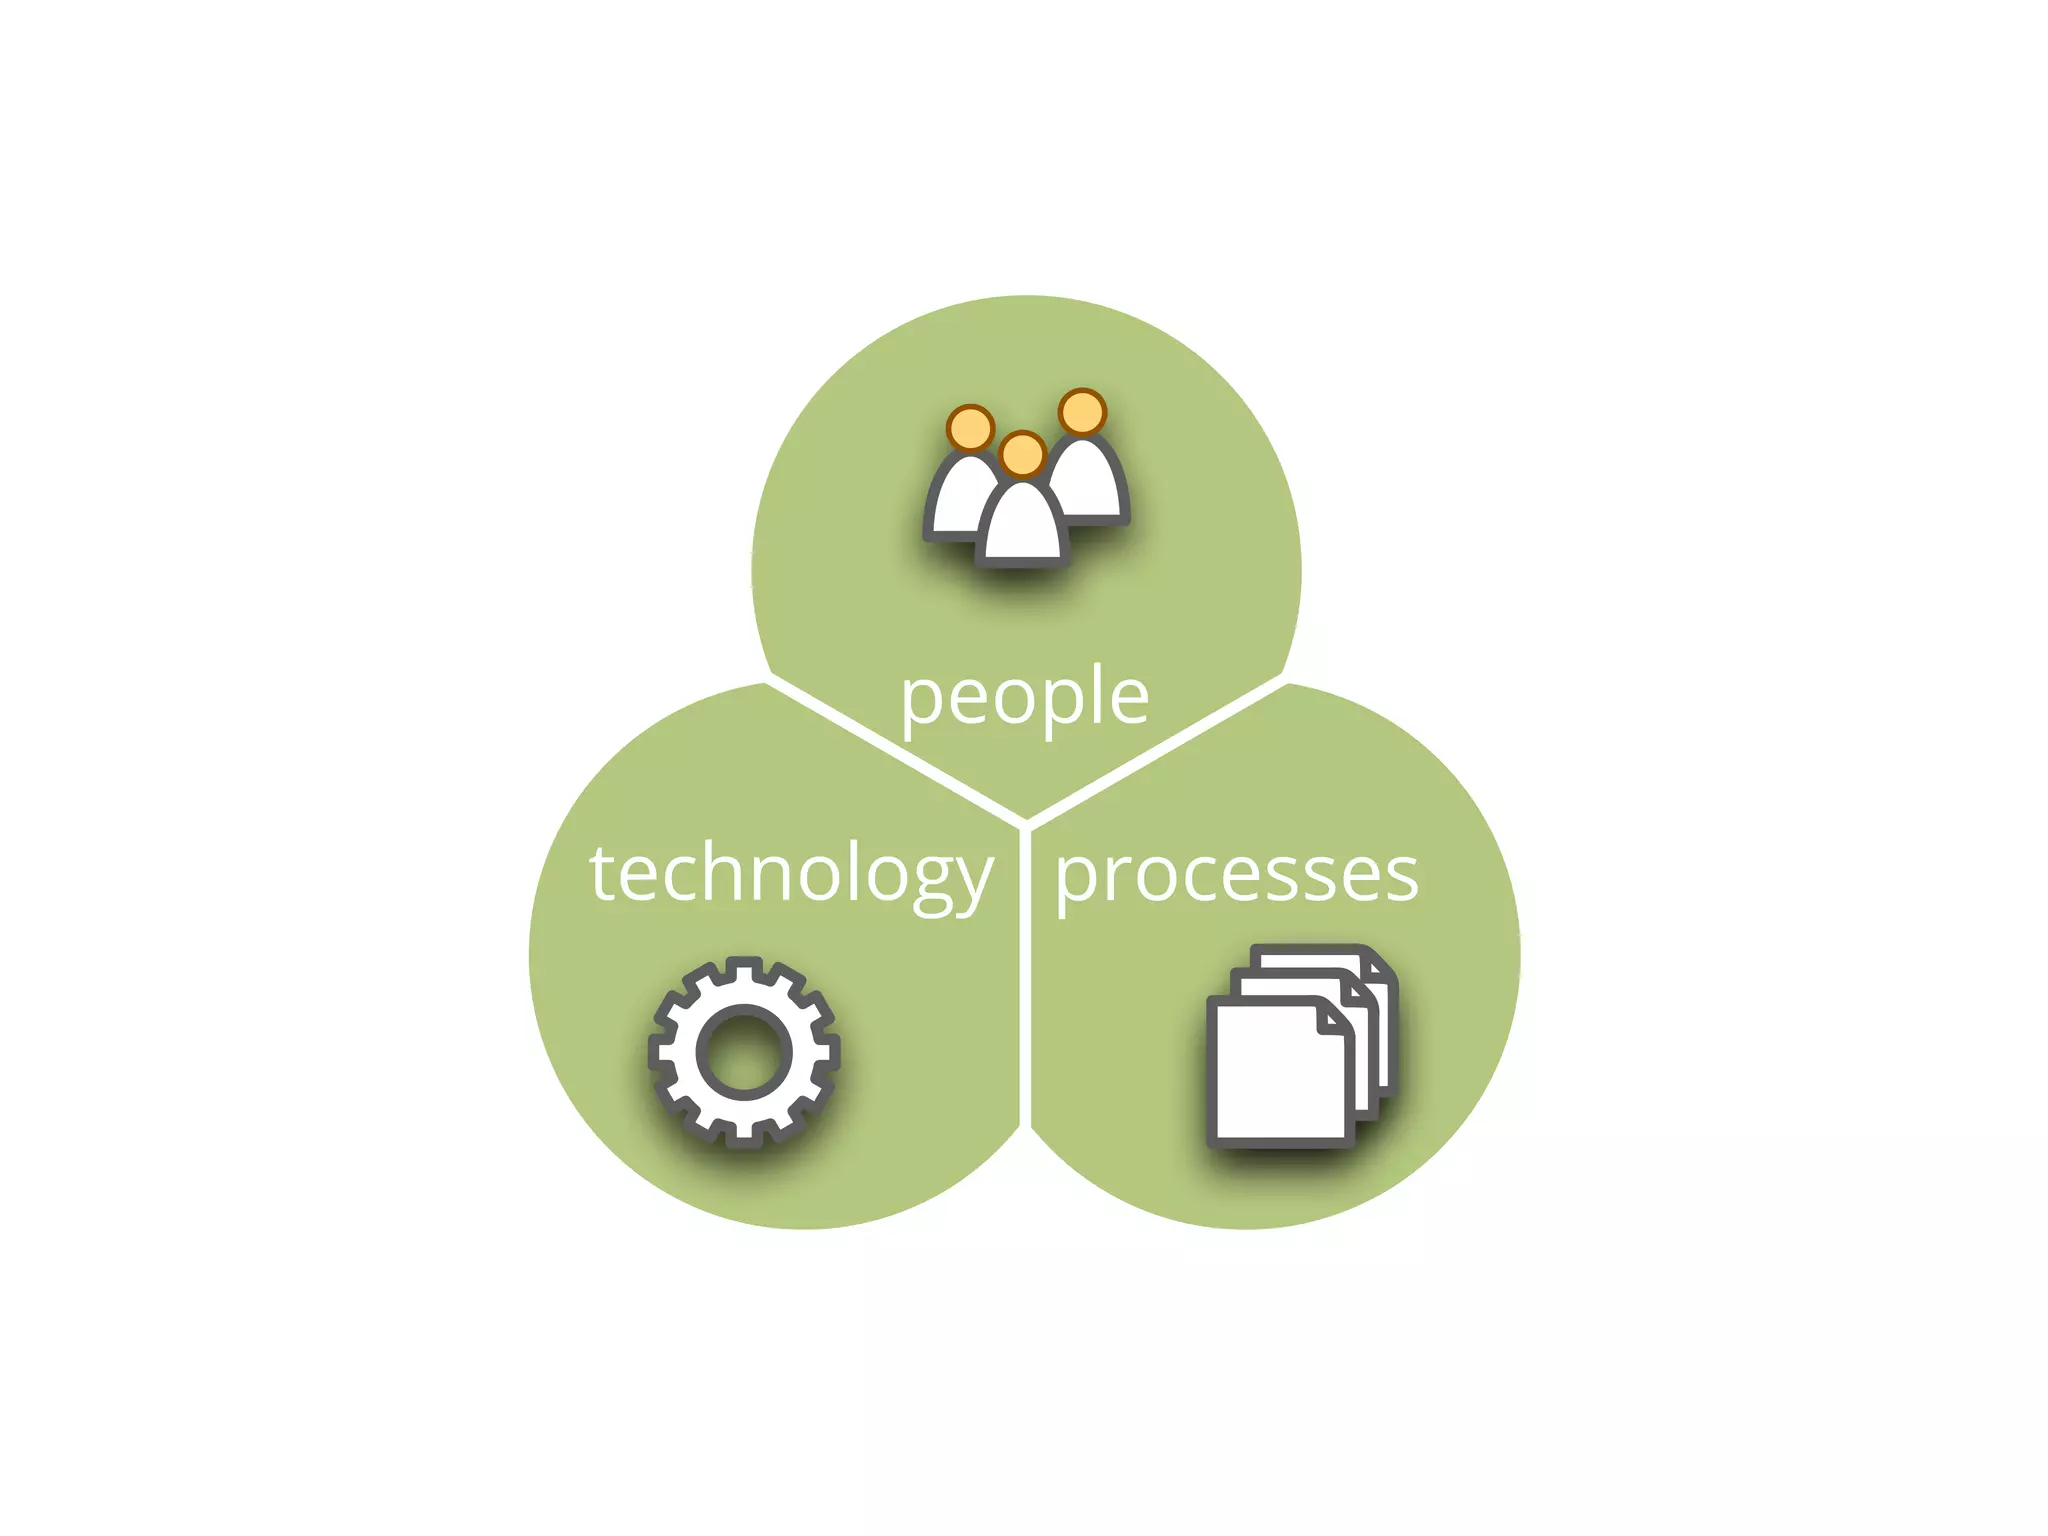
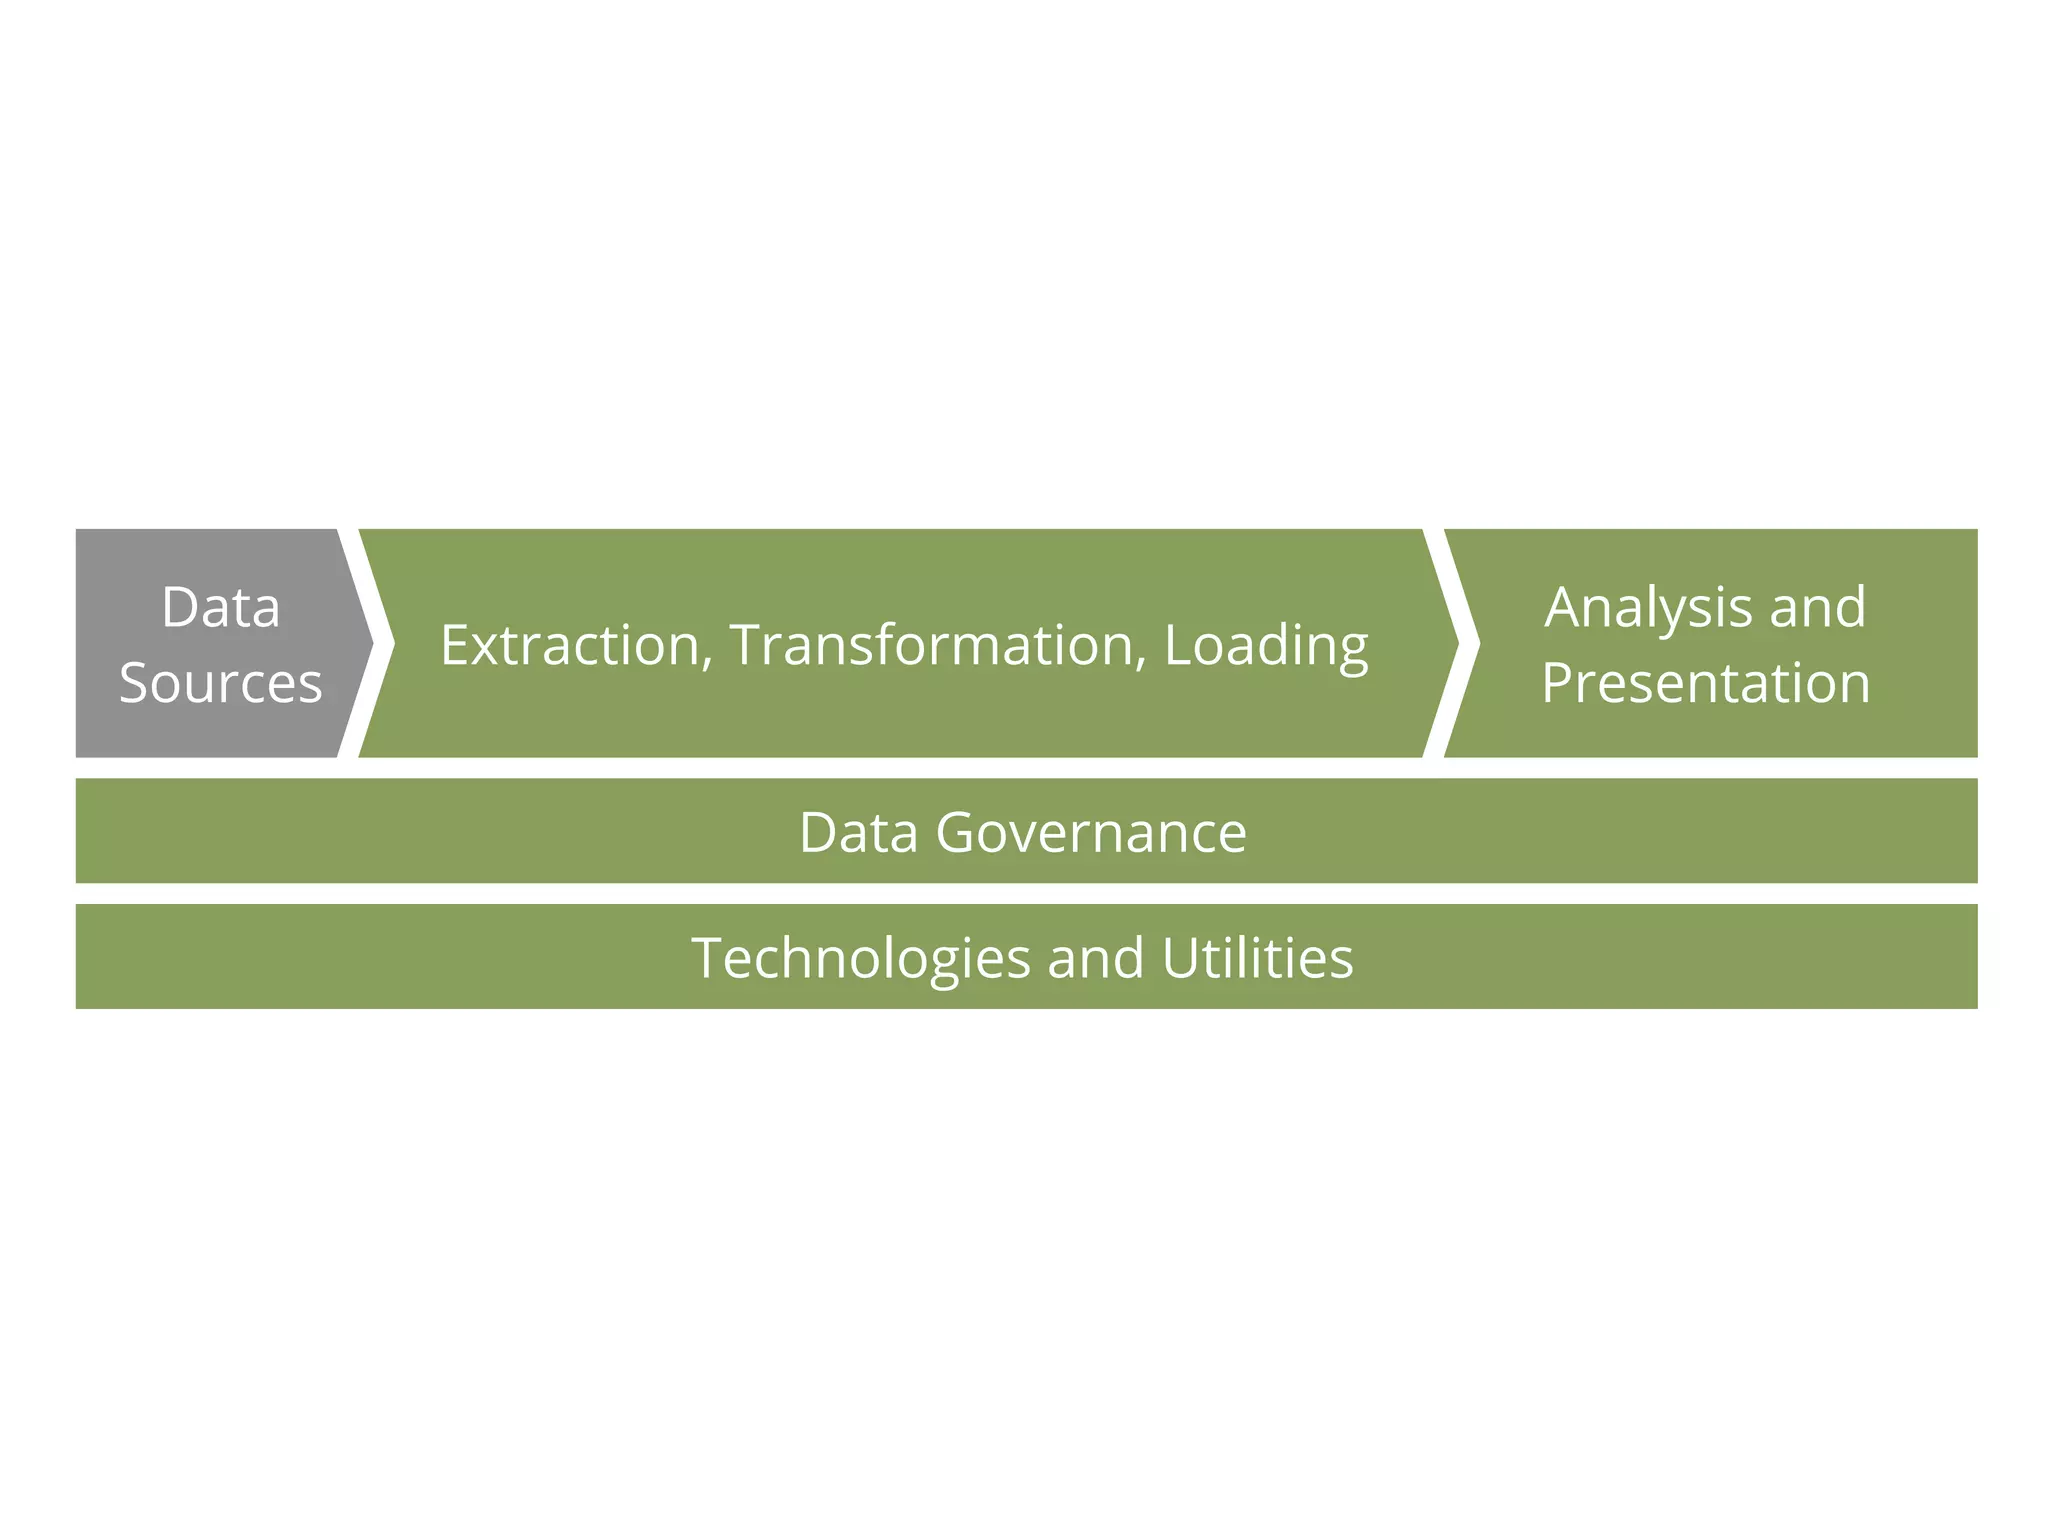
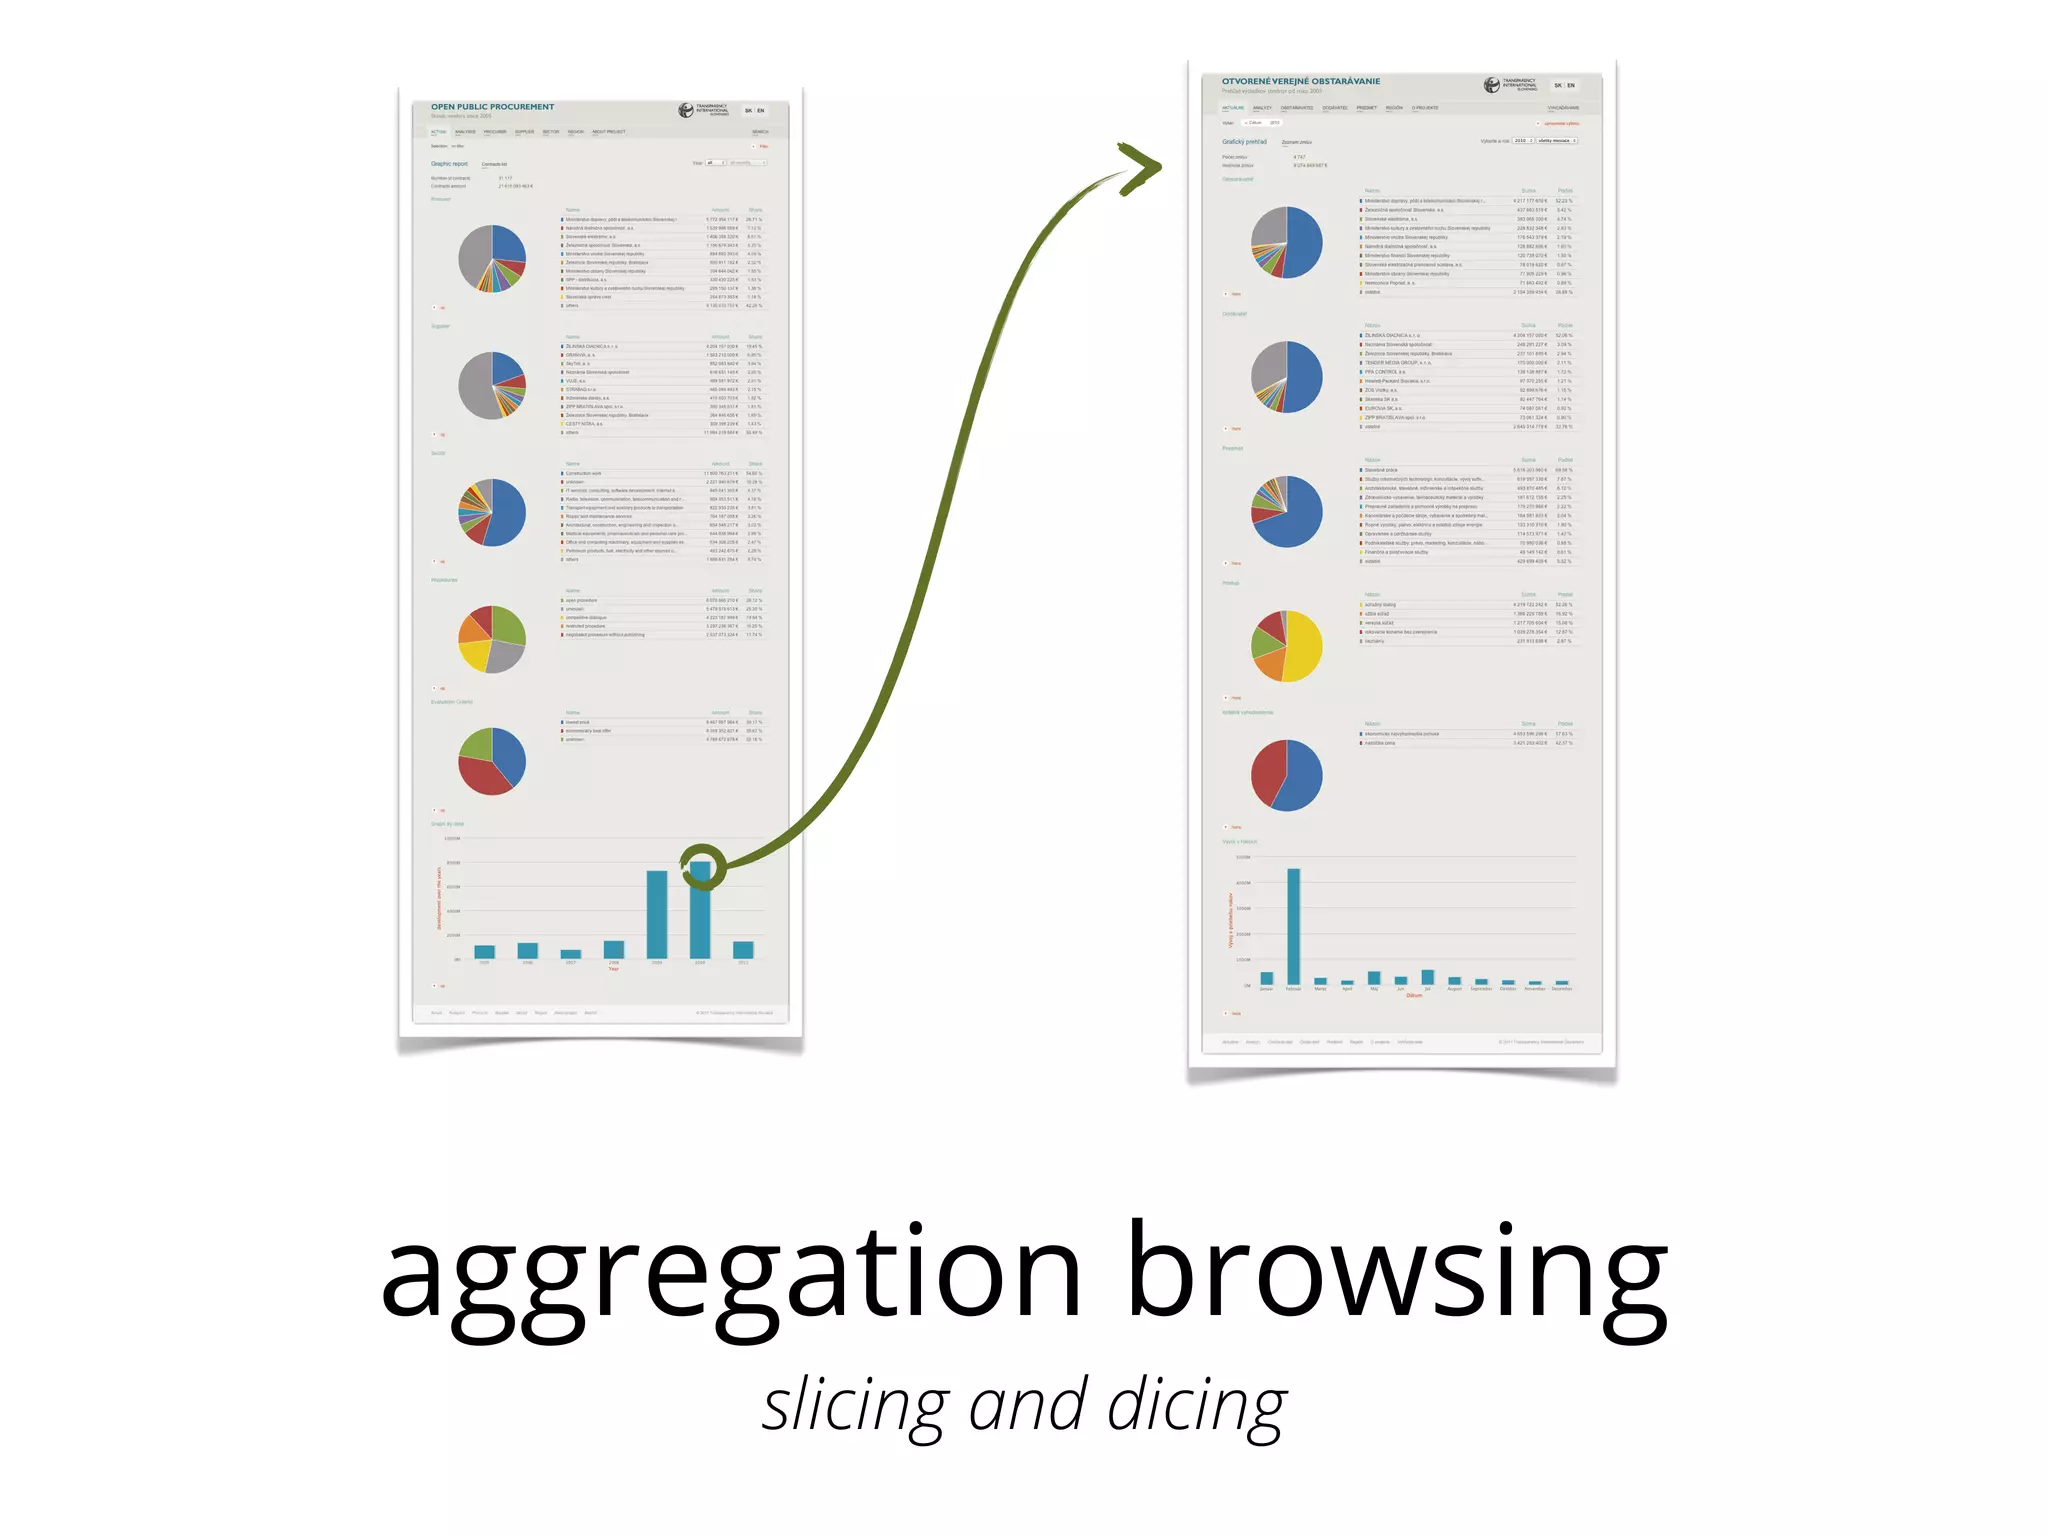
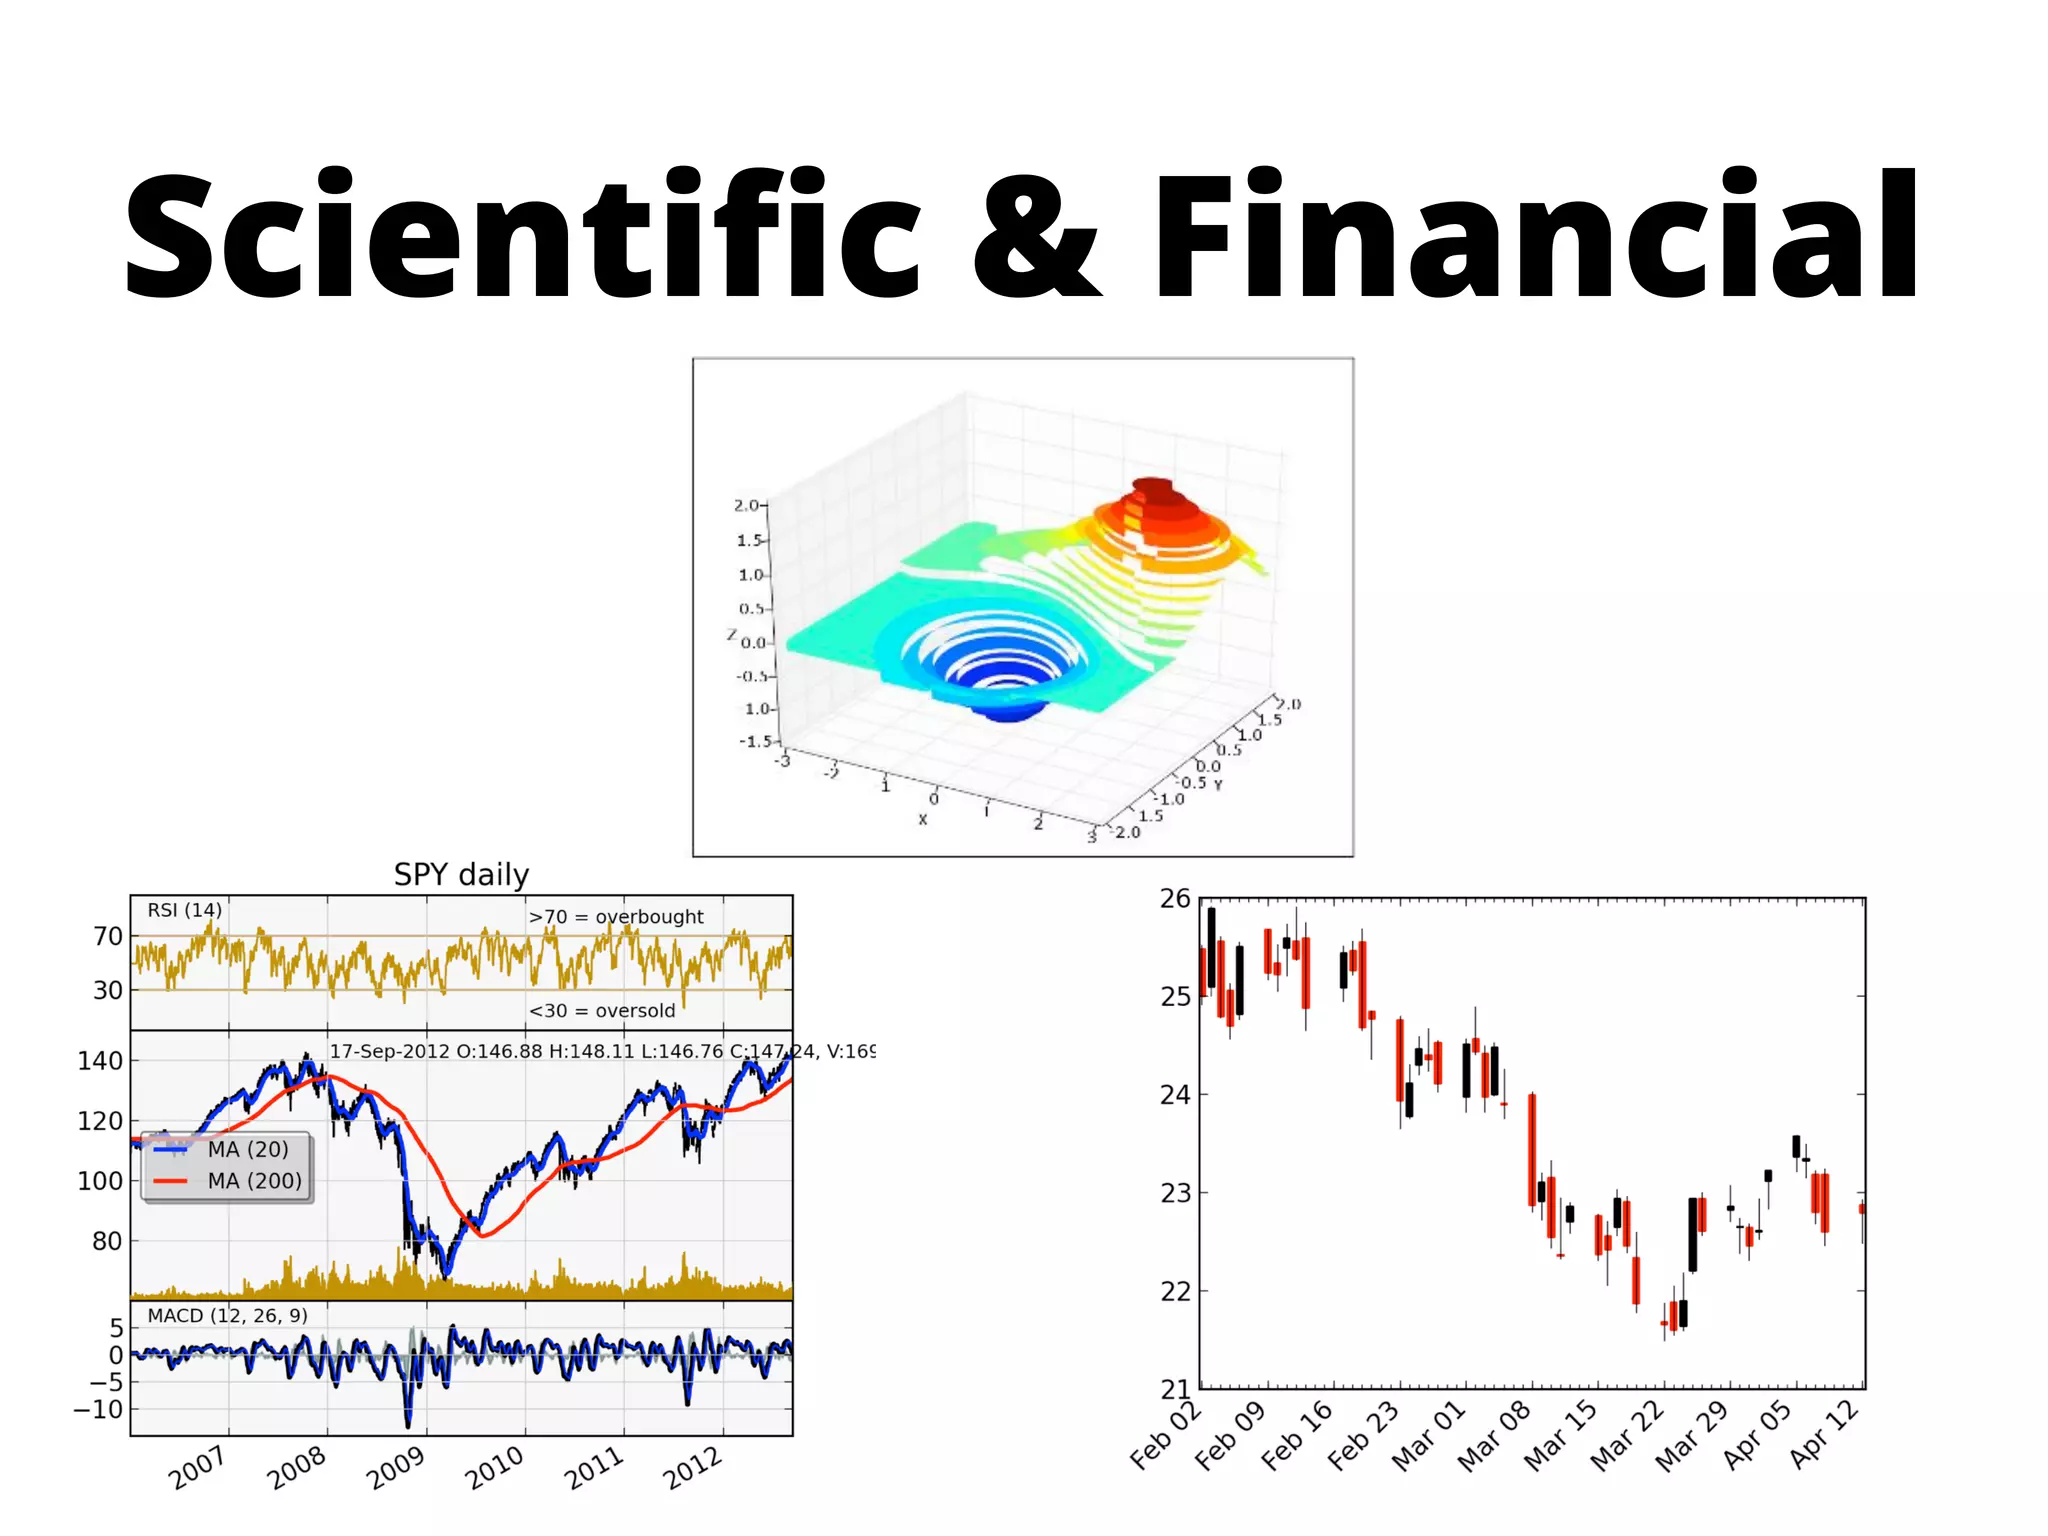
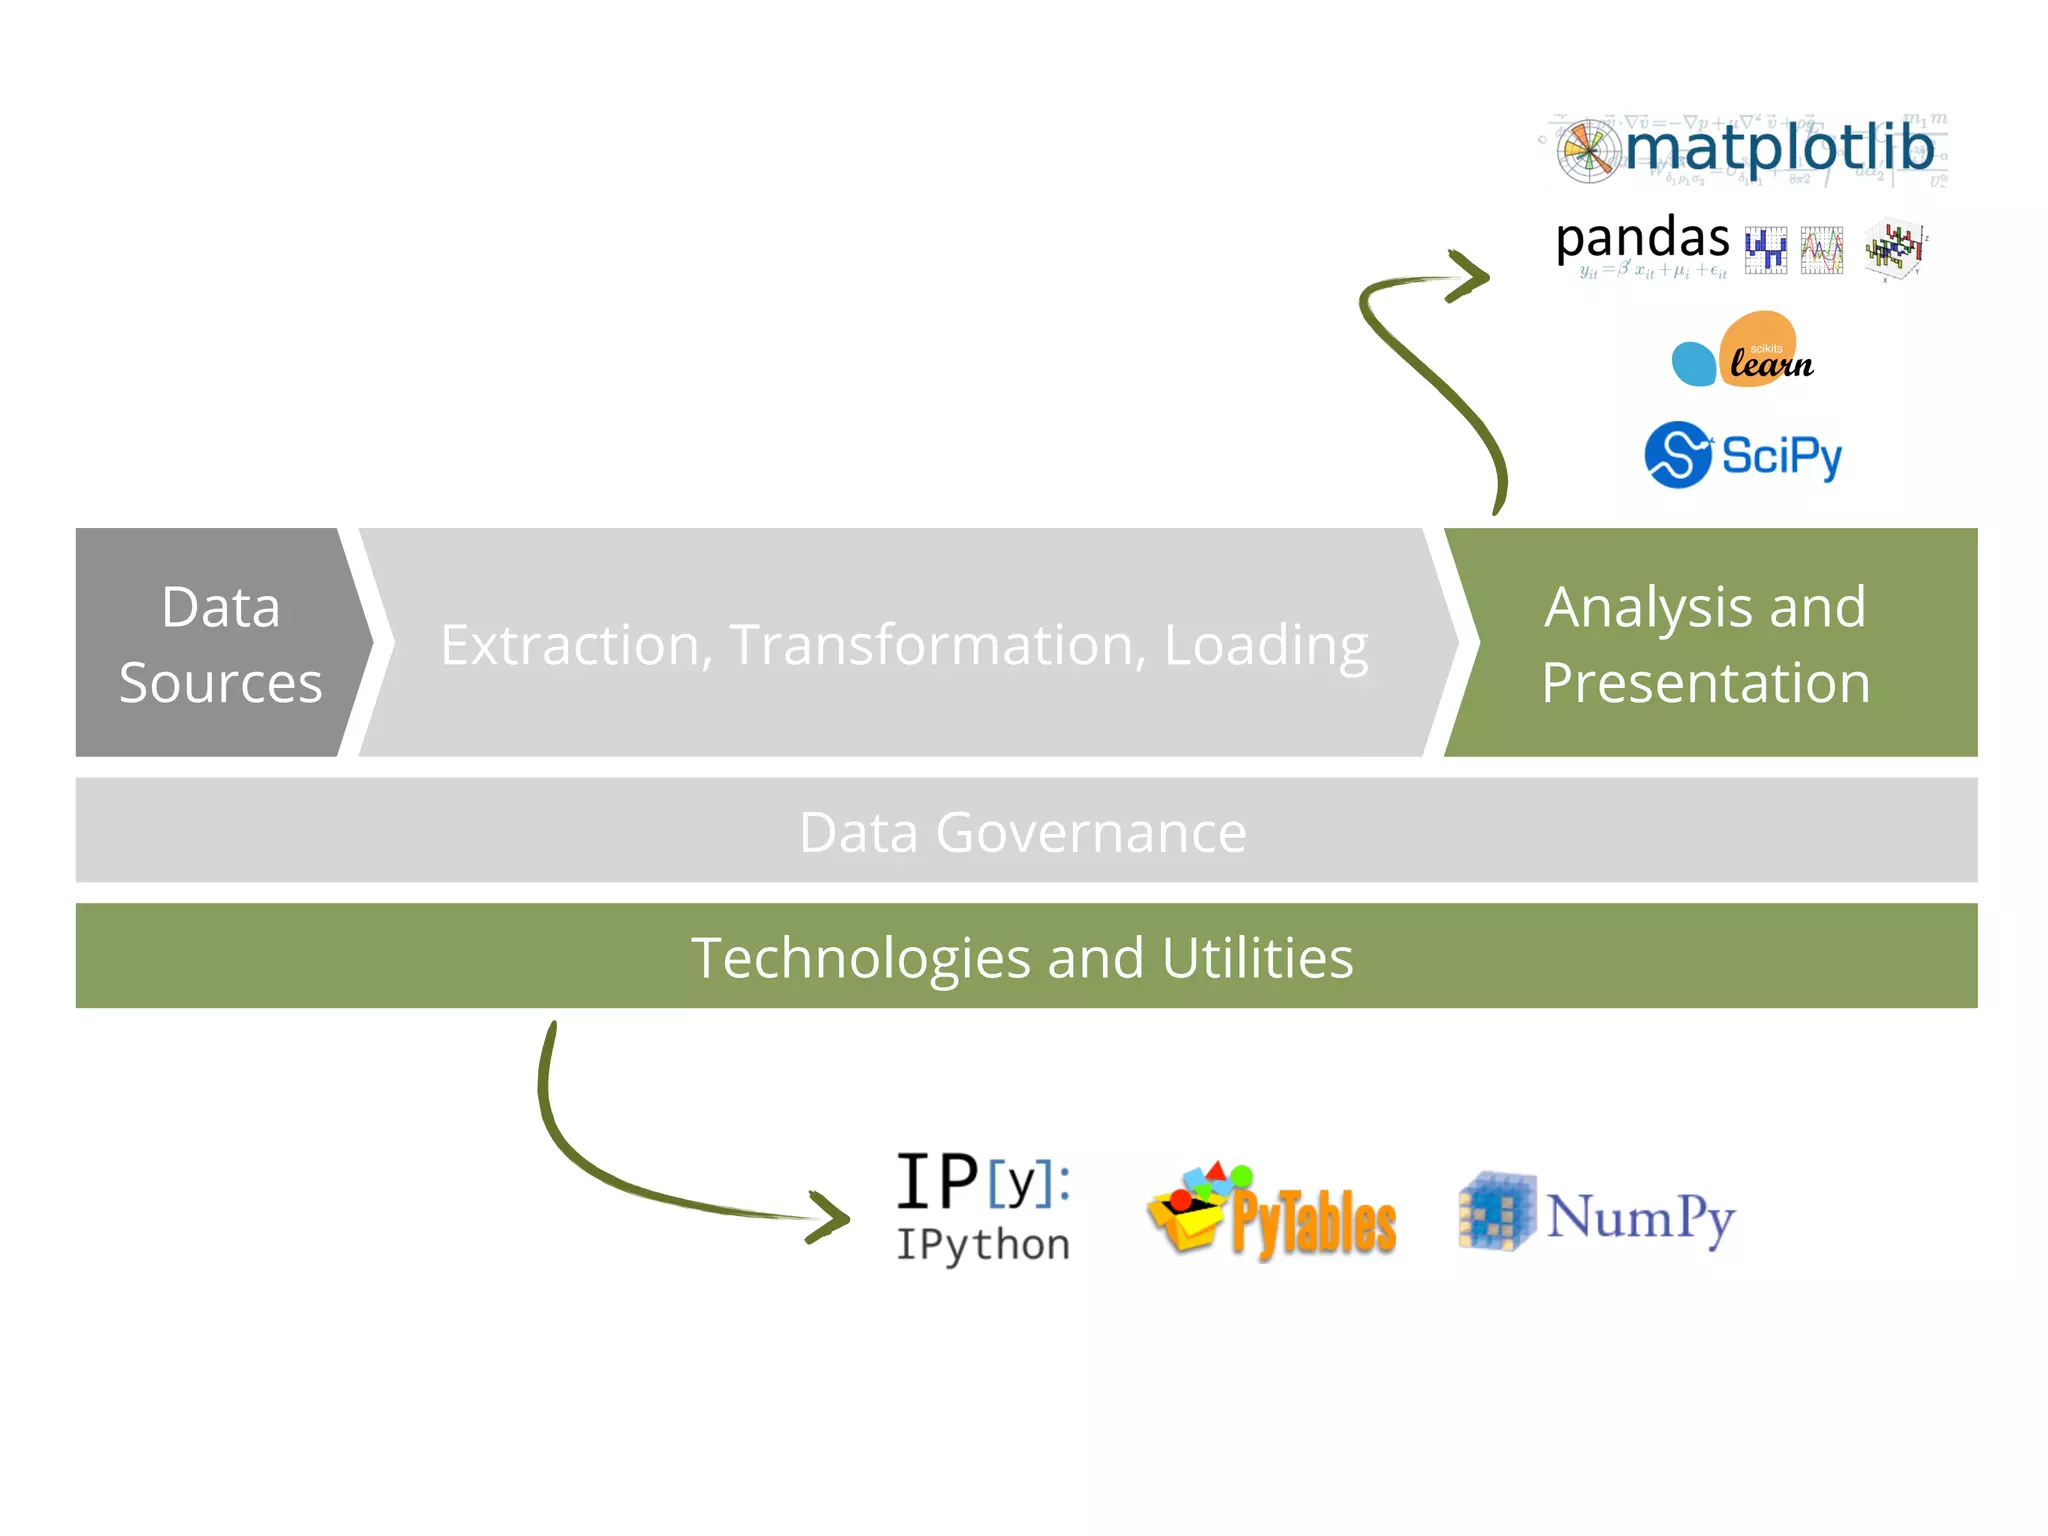
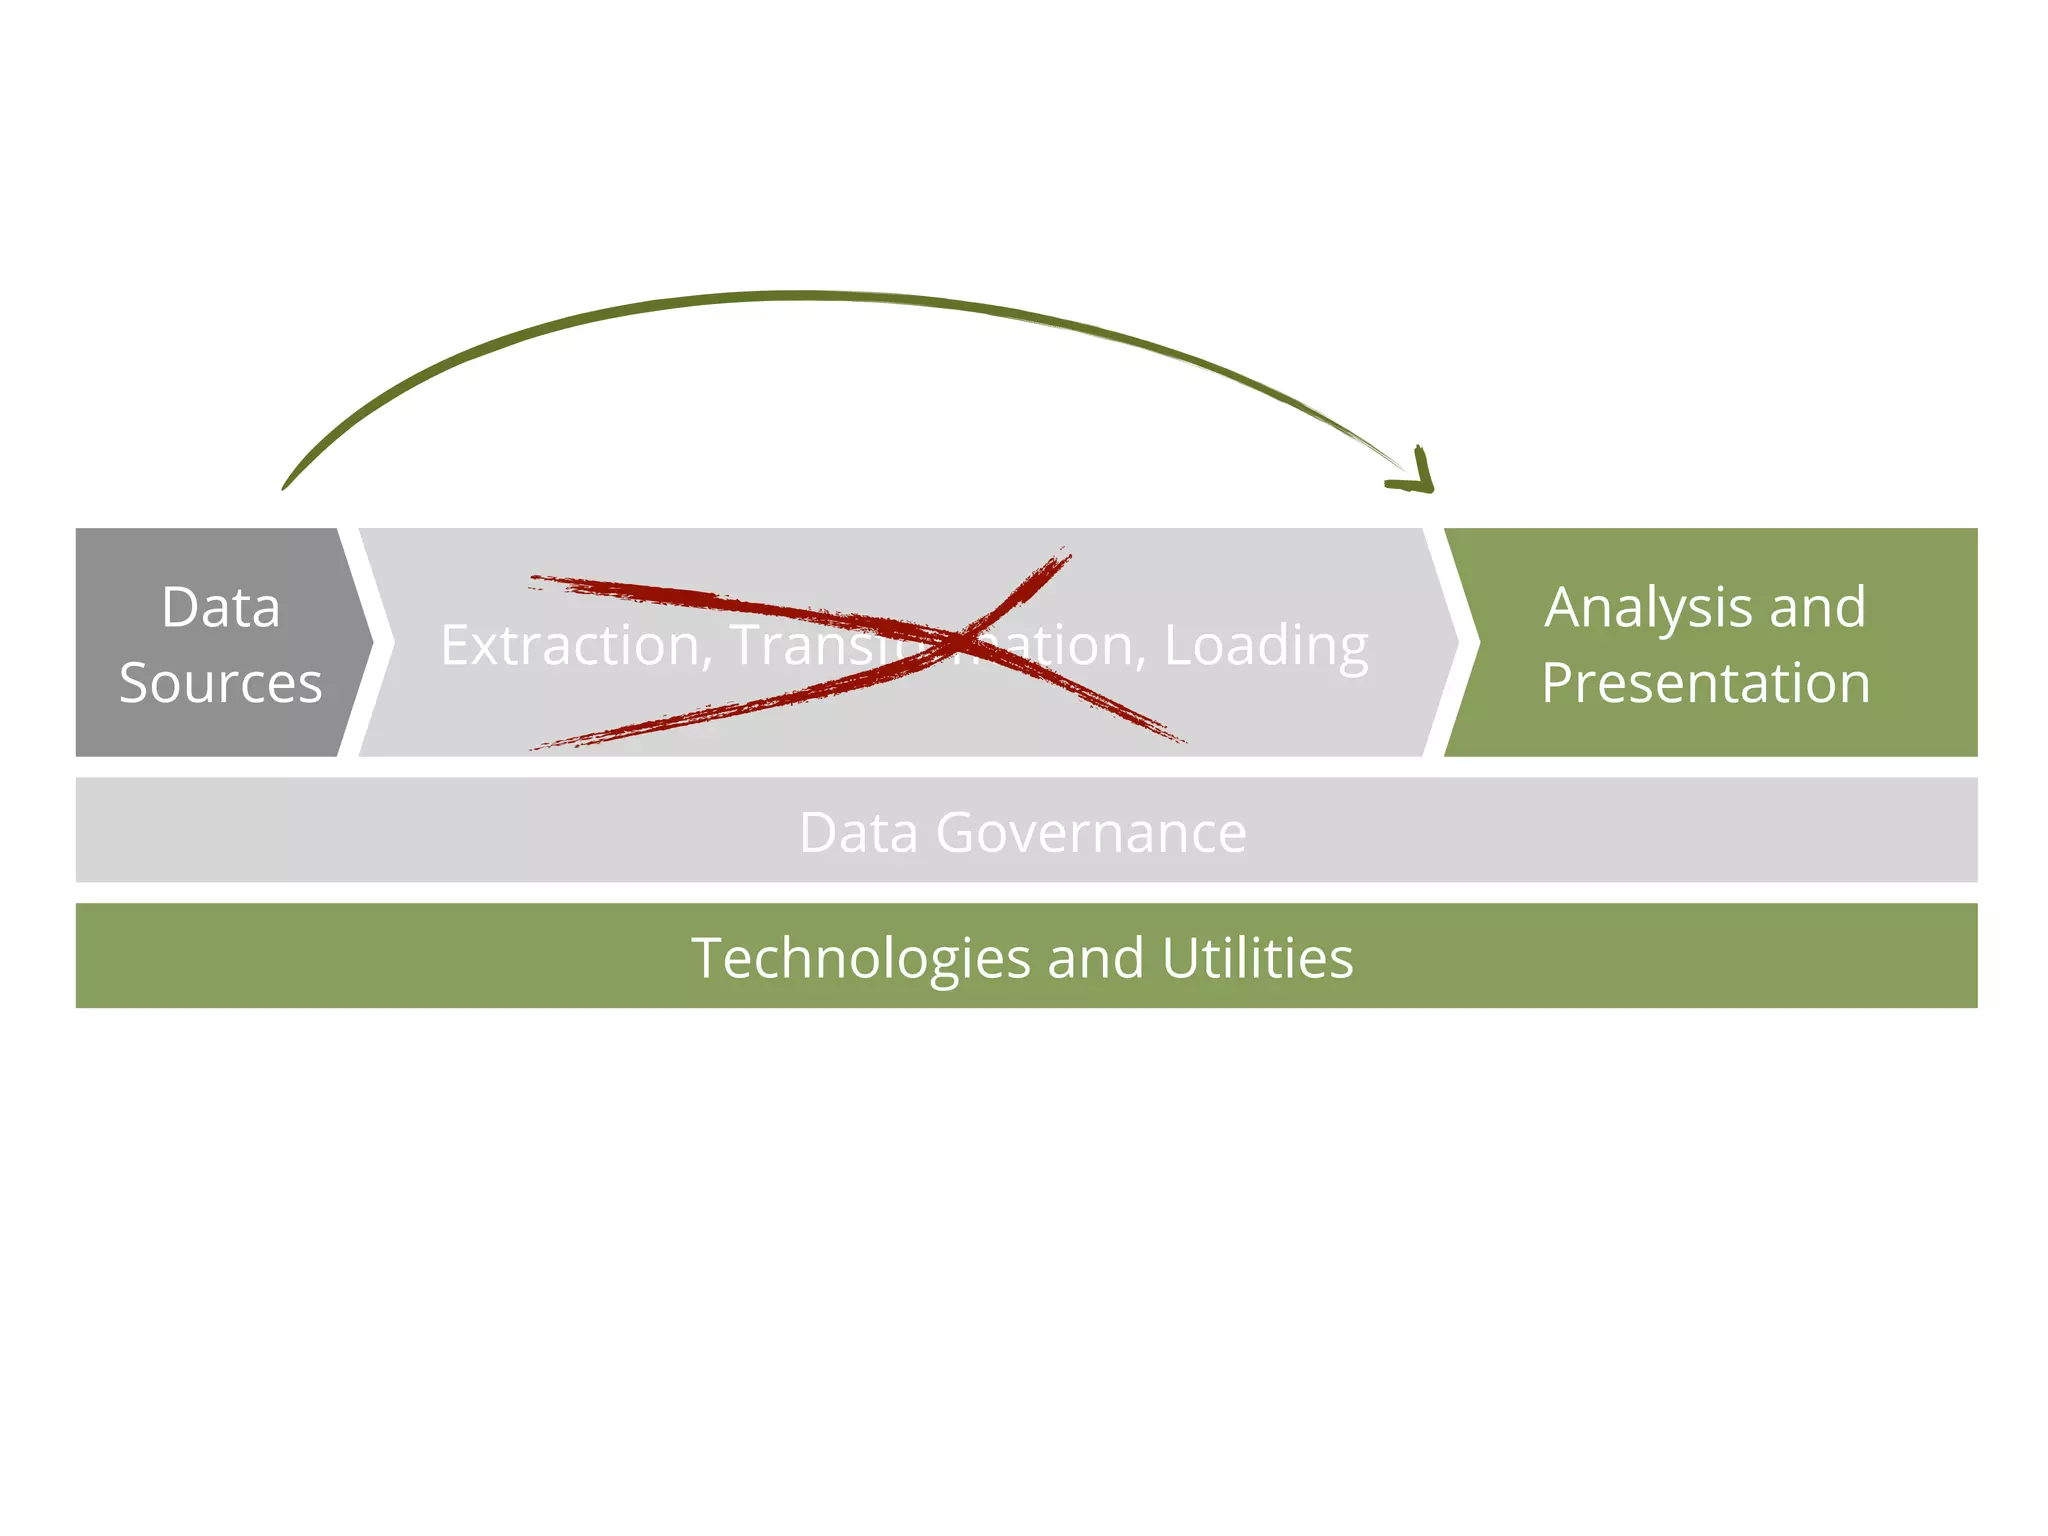
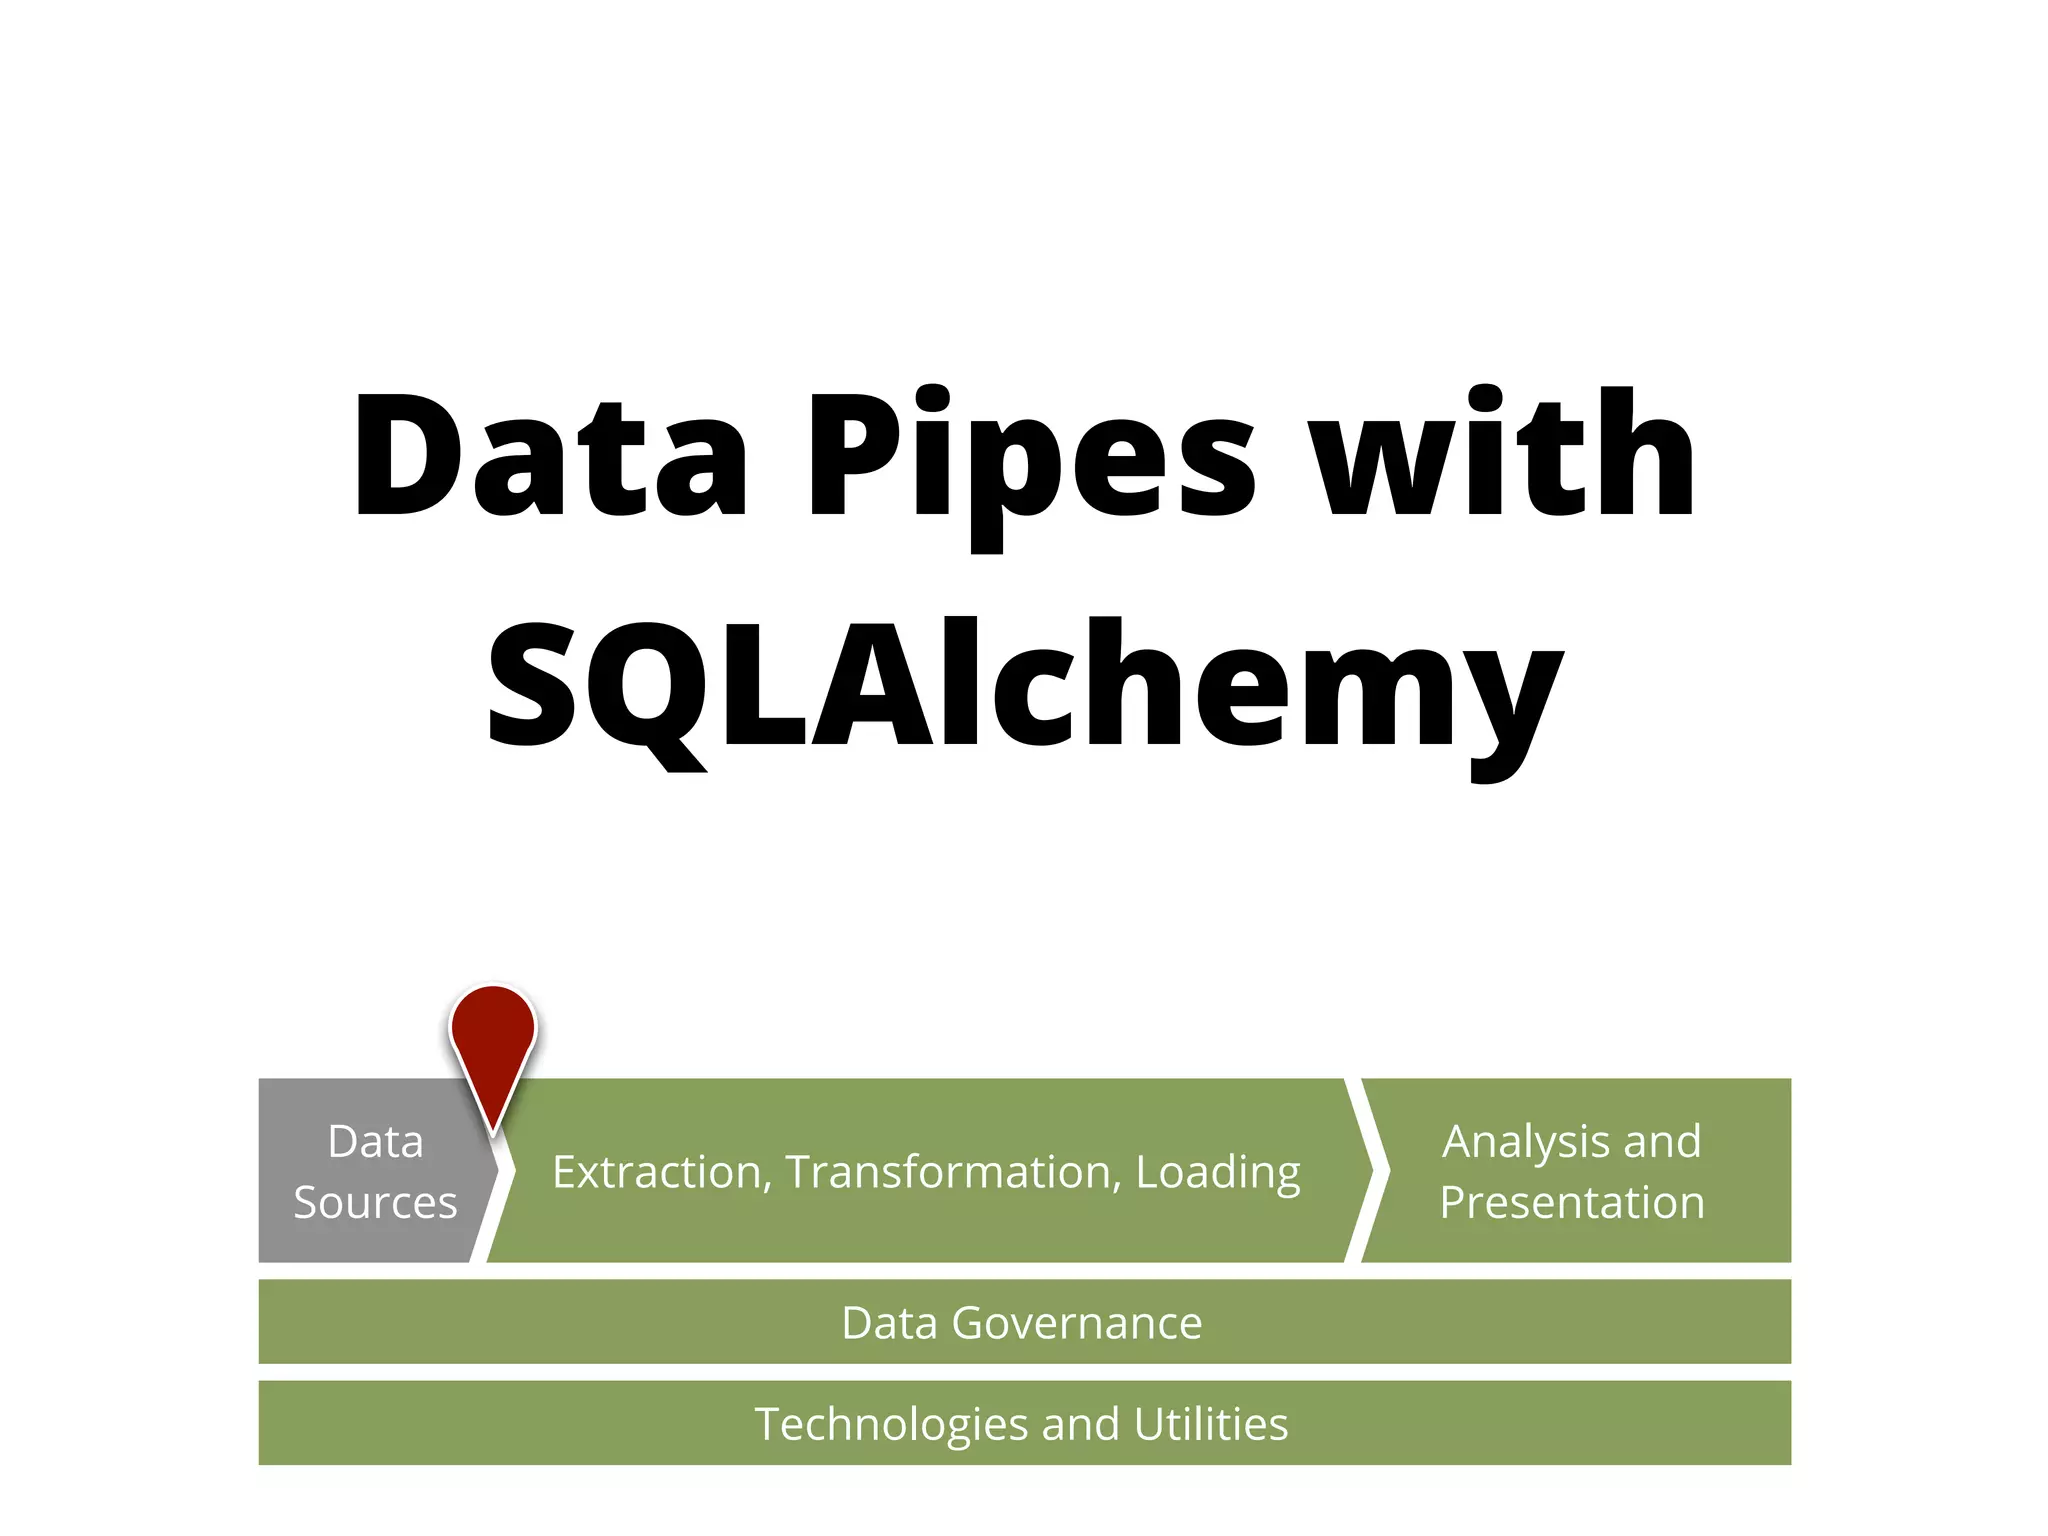
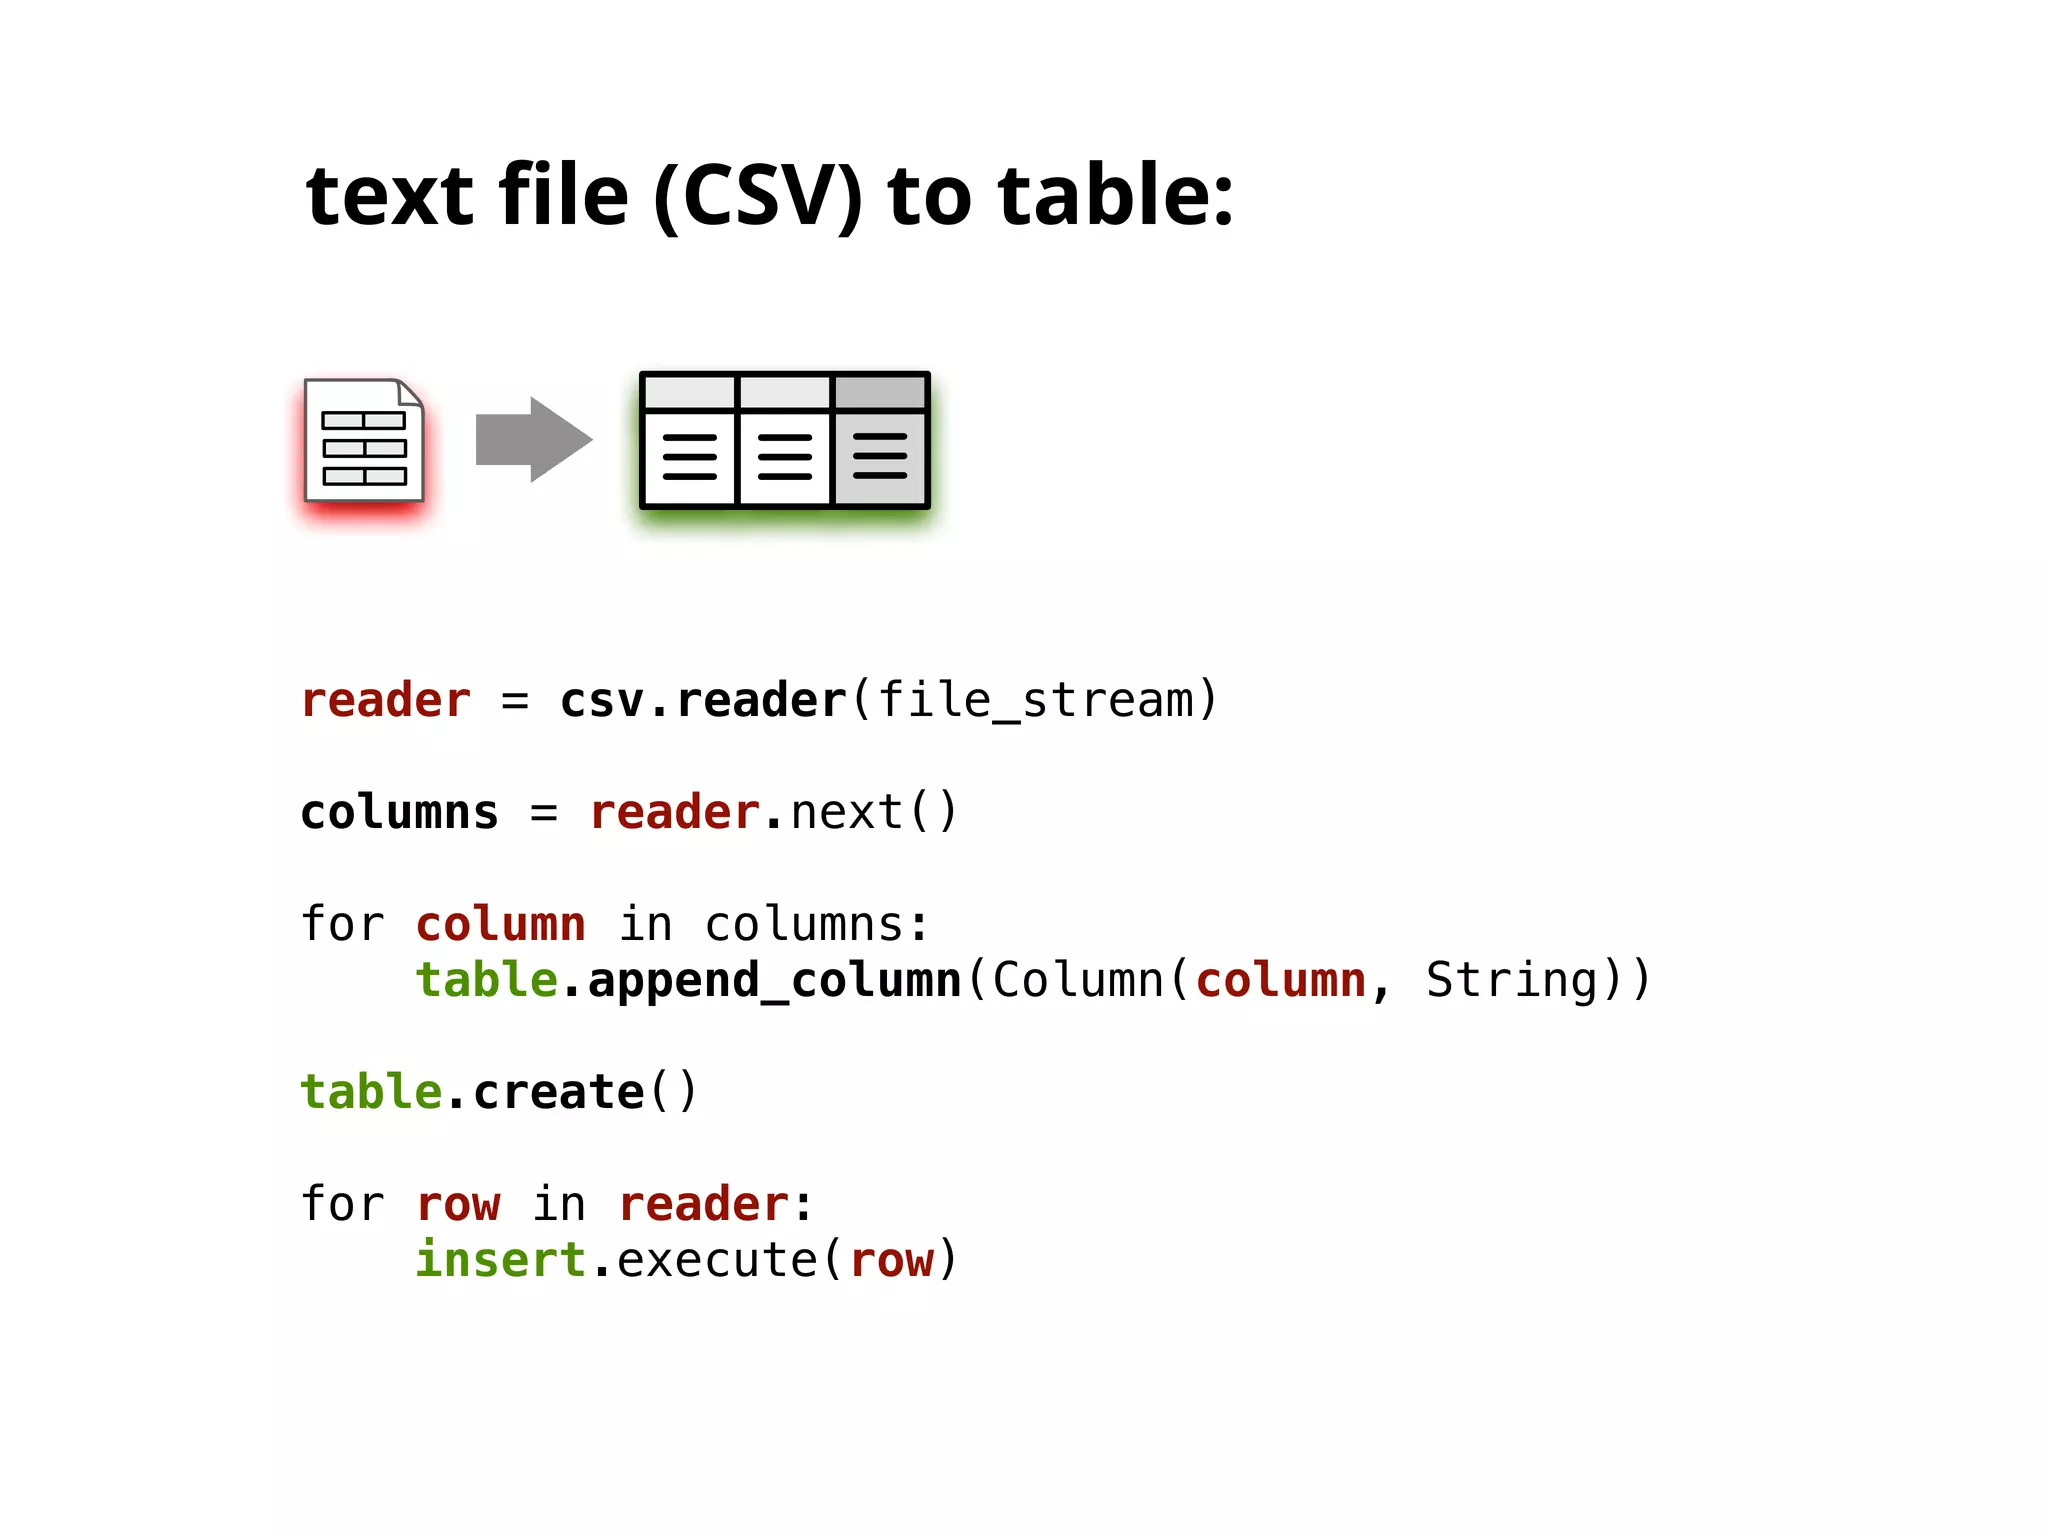
The document discusses the application of Python in business intelligence, focusing on data extraction, transformation, and loading (ETL) processes. It highlights how Python can enhance traditional data warehousing tasks, while also addressing community perceptions of its capabilities in handling scientific and financial data. The conclusion emphasizes the importance of maintaining a balance between people, technology, and processes in business intelligence.


![[IJCT-V3I2P32] Authors: Amarbir Singh, Palwinder Singh](https://cdn.slidesharecdn.com/ss_thumbnails/ijct-v3i2p32-160609071950-thumbnail.jpg?width=640&height=640&fit=bounds)


