
Recommended
More Related Content
What's hot
What's hot (15)
Similar to Pythagorean expectation
Recently uploaded
Recently uploaded (20)
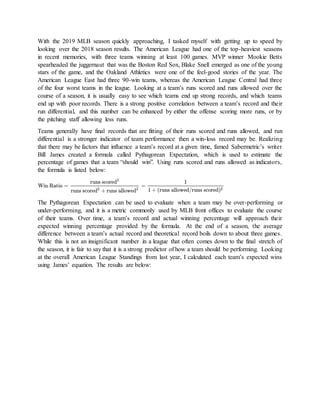
Pythagorean expectation
- 1. With the 2019 MLB season quickly approaching, I tasked myself with getting up to speed by looking over the 2018 season results. The American League had one of the top-heaviest seasons in recent memories, with three teams winning at least 100 games. MVP winner Mookie Betts spearheaded the juggernaut that was the Boston Red Sox, Blake Snell emerged as one of the young stars of the game, and the Oakland Athletics were one of the feel-good stories of the year. The American League East had three 90-win teams, whereas the American League Central had three of the four worst teams in the league. Looking at a team’s runs scored and runs allowed over the course of a season, it is usually easy to see which teams end up strong records, and which teams end up with poor records. There is a strong positive correlation between a team’s record and their run differential, and this number can be enhanced by either the offense scoring more runs, or by the pitching staff allowing less runs. Teams generally have final records that are fitting of their runs scored and runs allowed, and run differential is a stronger indicator of team performance then a win-loss record may be. Realizing that there may be factors that influence a team’s record at a given time, famed Sabermetric’s writer Bill James created a formula called Pythagorean Expectation, which is used to estimate the percentage of games that a team “should win”. Using runs scored and runs allowed as indicators, the formula is listed below: The Pythagorean Expectation can be used to evaluate when a team may be over-performing or under-performing, and it is a metric commonly used by MLB front offices to evaluate the course of their teams. Over time, a team’s record and actual winning percentage will approach their expected winning percentage provided by the formula. At the end of a season, the average difference between a team’s actual record and theoretical record boils down to about three games. While this is not an insignificant number in a league that often comes down to the final stretch of the season, it is fair to say that it is a strong predictor of how a team should be performing. Looking at the overall American League Standings from last year, I calculated each team’s expected wins using James’ equation. The results are below:
- 2. In Column G I calculated the expected win percentage of a team based on the inputs from Columns B and C, and this allowed me to calculate the difference in win percentage of a team. I expanded further on this in Column I, multiplying this difference by 162 to find what the differential between win percentages equated to in games over the course of the season. Averaging this number comes out to about 3.6, which is agreed upon as about the average number of game deviation between the actual and the expected. I highlighted the teams that greatly differed between their evaluations, and I will touch on one over-performing team and one underperforming team. The most egregious over-performing American League team of 2018 was the Seattle Mariners, who posted 89 wins despite a run differential of -34. With a win percentage of 54.9% compared to an expected win percentage of 47.6%, the Mariners outpaced their expectations all year long. When a team deviates from their actual win percentage by so much, the first thing to look at is the bullpen of the team. Edwin Diaz was the best closer in baseball last season, finishing with a sub-2 ERA with a SO/9 of 15.2, among the league leaders in this category. With four other relievers pitching 50 innings with sub-4 ERA’s, the Mariners had one of the strongest bullpens in the MLB. Through June 12th, the Mariners also boasted a record of 21-9 in one-run games, putting them on pace to shatter this record. Looking within the rest of the AL West Division, the Mariners may have benefited from the under-performance of their division foes. Using the Pythagorean Expectation, the Astros under performed by about 9 games, the Rangers by about 3 games, and the Angels by about 1 game. Playing about 76 divisional games each year, the Mariners may have benefited from the misfortunes of their rivals more than any other team in the league. All of these factors combined to make a perfect storm of over-performance, and GM Jerry Dipoto may have seen the writing on the wall for the 2019 team. Realizing that their 2018 performance was unlikely
- 3. to be replicated, Robinson Cano, Edwin Diaz, Alex Colome, Jean Segura, and James Paxton were all traded during the offseason. On the opposite end of the spectrum from the Mariners is the Cleveland Indians, who lost about 8.5 games more than they were expected to based on their run differential. Like the Mariners, it is easy to see where things went wrong for the Indians in 2018. Their bullpen ranked 13th in the AL in FIP, at 4.53. They allowed Bryan Shaw to leave in free agency, and Andrew Miller’s injuries throughout the season put the team in a tough predicament. Their top three bullpen arms all finished with ERA’s above 4.50. The carnage of their disastrous season is shown below: Terry Francona leaned heavily on his starting rotation in 2018, with 4 starters throwing at least 175 innings, a remarkable feat in today’s strict innings-limit game. Checking in at 22-24 in one run games, the Indians were a middle of the pack American league team in this regard. Running away with the AL Central in 2018, the Indians seemingly were not affected by this under- performance. Making no moves to shore up their bullpen weakness entering the 2019 season, it will be interesting to see if any other teams in this division can step up to rival the Indians. While the Pythagorean Expectation may not provide anything concrete in regards to how a team is playing at a certain point in time, the math shows that a team’s actual record will closely approach this theoretical record over time. It is used as a tool for a front office to gauge how good their team should be performing, and this influences the course of action teams may take in the offseason or at the trade deadline.