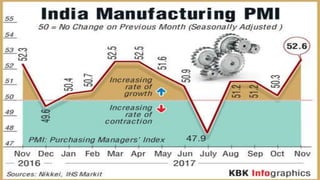
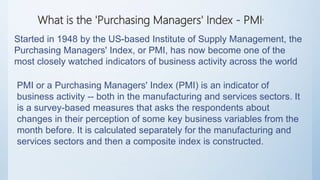
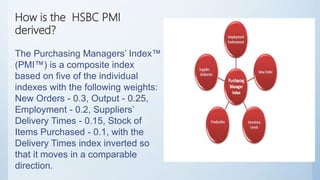
Purchasing Managers'
Index
BY-
RAKESH ROUT 18334
RAJAT CHANDRA 18059
VIVEK SHARMA 18062
MD NAUSHAD 18231
RUDRANJAN DUTTA 18071
What is the 'Purchasing Managers' Index - PMI'
Started in 1948 by the US-based Institute of Supply Management, the
Purchasing Managers' Index, or PMI, has now become one of the
most closely watched indicators of business activity across the world
PMI or a Purchasing Managers' Index (PMI) is an indicator of
business activity -- both in the manufacturing and services sectors. It
is a survey-based measures that asks the respondents about
changes in their perception of some key business variables from the
month before. It is calculated separately for the manufacturing and
services sectors and then a composite index is constructed.
How is the HSBC PMI
derived?
The Purchasing Managers’ Index™
(PMI™) is a composite index
based on five of the individual
indexes with the following weights:
New Orders - 0.3, Output - 0.25,
Employment - 0.2, Suppliers’
Delivery Times - 0.15, Stock of
Items Purchased - 0.1, with the
Delivery Times index inverted so
that it moves in a comparable
direction.
• PMI data are presented in the form of a diffusion index, which is calculated
as follows:]
• where:
• P1 = Percentage number of answers that reported an improvement.
• P2 = Percentage number of answers that reported no change.
• P3 = Percentage number of answers that reported a deterioration.
• Thus, if 100% of the panel reported an improvement, the index would be
100.0. If 100% reported a deterioration, the index would be zero. If 100%
of the panel saw no change, the index would be 50.0 (P2 * 0.5).
Formula & calculation
How does one read the PMI?
A figure above 50 denotes expansion in business activity.
Anything below 50 denotes contraction. Higher the
difference from this mid-point greater the expansion or
contraction. The rate of expansion can also be judged by
comparing the PMI with that of the previous month data. If
the figure is higher than the previous month’s then the
economy is expanding at a faster rate. If it is lower than the
previous month then it is growing at a lower rate.
What are its implications for the economy?
The PMI is usually released at the start of the month, much before
most of the official data on industrial output, manufacturing and GDP
growth becomes available. It is, therefore, considered a good leading
indicator of economic activity. Economists consider the manufacturing
growth measured by the PMI as a good indicator of industrial output,
for which official statistics are released later. Central banks of many
countries also use the index to help make decisions on interest rates.
What does it mean for financial markets?
The PMI also gives an indication of corporate earnings and is closely
watched by investors as well as the bond markets. A good reading
enhances the attractiveness of an economy vis-a- vis another
competing economy. For instance, India’s manufacturing activity as
measured by the PMI expanded to 5I.7 in July, while for China it was
52.
INSTITUTIONS THAT PRESENTS THE PMI IN THE WORLD INCLUDIND INDIA ARE
AS FOLLOWS :-
• NIKKEI
• HSBC
• HIS MARKIT
• EMIRATES NBD
• STANBIC
• JP MARGON
• GOLDMAN SACS
• BANK OF SCOTLAND
The HSBC India Manufacturing PMI is based
on data compiled from monthly replies to
questionnaires sent to purchasing executives in
over 500 manufacturing companies.
The panel is stratified geographically and by
Standard Industrial Classification (SIC) group,
based on industry contribution to Indian GDP.
Survey responses reflect the change, if any, in
the current month compared to the previous
month based on data collected mid-month
THE RECENT DOWN SWING
Major economic reforms measures including Demonetization,
Implementation of new Tax regime (GST) have been taken by the
government. The falling GDP figures are indicative of the downtrend
in the economy and now the PMI data cements the fact that the
growth numbers shall continue to be bleak.
GST has impacted the new work orders and business activity. Its
reflection is clearly visible on PMI which was registered at 45.9 for
the month of July 2017. The firms in July had indicated that
production, orders and purchasing were postponed for the lack of
clarity about the new TAX regime.
Index, which combines the manufacturing and services sector
numbers, rose slightly from 51.1 in September to 51.3 in October.
Barring manufacturing, most of the recent data has shown the
economy gathering pace after GDP growth slowed to a three-year low
of 5.7% in the June quarter.
Auto sales cooled in October from a rise of more than 10% in
September but the biggest companies, led by Maruti Suzuki’s 9.2%
expansion, showed positive growth.
THE ROAD AHEAD
Experts believe that this trend shall change gradually as
the market become accustomed to the taxation system.
The economy is coming back on track. The future
prospects of growth are high. The international crude oil
market is also favorable for India.
The recent cabinet reshuffle is also significant in this regard
as the agenda for boosting import-export sector is on high
priority. This should give impetus to a positive sentiment in
the market. The suppliers, manufacturers and their clients
have now resumed their business activities and a direct
impact of the same would be evident on the PMI. It is
hoped that the different PMI components would upsurge
and a collective impact would result in Purchasing
Manager’s Index levels.

Purchasing managers' index

  • 1.
    Purchasing Managers' Index BY- RAKESH ROUT18334 RAJAT CHANDRA 18059 VIVEK SHARMA 18062 MD NAUSHAD 18231 RUDRANJAN DUTTA 18071
  • 2.
    What is the'Purchasing Managers' Index - PMI' Started in 1948 by the US-based Institute of Supply Management, the Purchasing Managers' Index, or PMI, has now become one of the most closely watched indicators of business activity across the world PMI or a Purchasing Managers' Index (PMI) is an indicator of business activity -- both in the manufacturing and services sectors. It is a survey-based measures that asks the respondents about changes in their perception of some key business variables from the month before. It is calculated separately for the manufacturing and services sectors and then a composite index is constructed.
  • 3.
    How is theHSBC PMI derived? The Purchasing Managers’ Index™ (PMI™) is a composite index based on five of the individual indexes with the following weights: New Orders - 0.3, Output - 0.25, Employment - 0.2, Suppliers’ Delivery Times - 0.15, Stock of Items Purchased - 0.1, with the Delivery Times index inverted so that it moves in a comparable direction.
  • 4.
    • PMI dataare presented in the form of a diffusion index, which is calculated as follows:] • where: • P1 = Percentage number of answers that reported an improvement. • P2 = Percentage number of answers that reported no change. • P3 = Percentage number of answers that reported a deterioration. • Thus, if 100% of the panel reported an improvement, the index would be 100.0. If 100% reported a deterioration, the index would be zero. If 100% of the panel saw no change, the index would be 50.0 (P2 * 0.5). Formula & calculation
  • 5.
    How does oneread the PMI? A figure above 50 denotes expansion in business activity. Anything below 50 denotes contraction. Higher the difference from this mid-point greater the expansion or contraction. The rate of expansion can also be judged by comparing the PMI with that of the previous month data. If the figure is higher than the previous month’s then the economy is expanding at a faster rate. If it is lower than the previous month then it is growing at a lower rate.
  • 6.
    What are itsimplications for the economy? The PMI is usually released at the start of the month, much before most of the official data on industrial output, manufacturing and GDP growth becomes available. It is, therefore, considered a good leading indicator of economic activity. Economists consider the manufacturing growth measured by the PMI as a good indicator of industrial output, for which official statistics are released later. Central banks of many countries also use the index to help make decisions on interest rates.
  • 7.
    What does itmean for financial markets? The PMI also gives an indication of corporate earnings and is closely watched by investors as well as the bond markets. A good reading enhances the attractiveness of an economy vis-a- vis another competing economy. For instance, India’s manufacturing activity as measured by the PMI expanded to 5I.7 in July, while for China it was 52.
  • 8.
    INSTITUTIONS THAT PRESENTSTHE PMI IN THE WORLD INCLUDIND INDIA ARE AS FOLLOWS :- • NIKKEI • HSBC • HIS MARKIT • EMIRATES NBD • STANBIC • JP MARGON • GOLDMAN SACS • BANK OF SCOTLAND
  • 9.
    The HSBC IndiaManufacturing PMI is based on data compiled from monthly replies to questionnaires sent to purchasing executives in over 500 manufacturing companies. The panel is stratified geographically and by Standard Industrial Classification (SIC) group, based on industry contribution to Indian GDP. Survey responses reflect the change, if any, in the current month compared to the previous month based on data collected mid-month
  • 11.
    THE RECENT DOWNSWING Major economic reforms measures including Demonetization, Implementation of new Tax regime (GST) have been taken by the government. The falling GDP figures are indicative of the downtrend in the economy and now the PMI data cements the fact that the growth numbers shall continue to be bleak. GST has impacted the new work orders and business activity. Its reflection is clearly visible on PMI which was registered at 45.9 for the month of July 2017. The firms in July had indicated that production, orders and purchasing were postponed for the lack of clarity about the new TAX regime.
  • 12.
    Index, which combinesthe manufacturing and services sector numbers, rose slightly from 51.1 in September to 51.3 in October. Barring manufacturing, most of the recent data has shown the economy gathering pace after GDP growth slowed to a three-year low of 5.7% in the June quarter. Auto sales cooled in October from a rise of more than 10% in September but the biggest companies, led by Maruti Suzuki’s 9.2% expansion, showed positive growth.
  • 13.
    THE ROAD AHEAD Expertsbelieve that this trend shall change gradually as the market become accustomed to the taxation system. The economy is coming back on track. The future prospects of growth are high. The international crude oil market is also favorable for India. The recent cabinet reshuffle is also significant in this regard as the agenda for boosting import-export sector is on high priority. This should give impetus to a positive sentiment in the market. The suppliers, manufacturers and their clients have now resumed their business activities and a direct impact of the same would be evident on the PMI. It is hoped that the different PMI components would upsurge and a collective impact would result in Purchasing Manager’s Index levels.