Downloaded 105 times
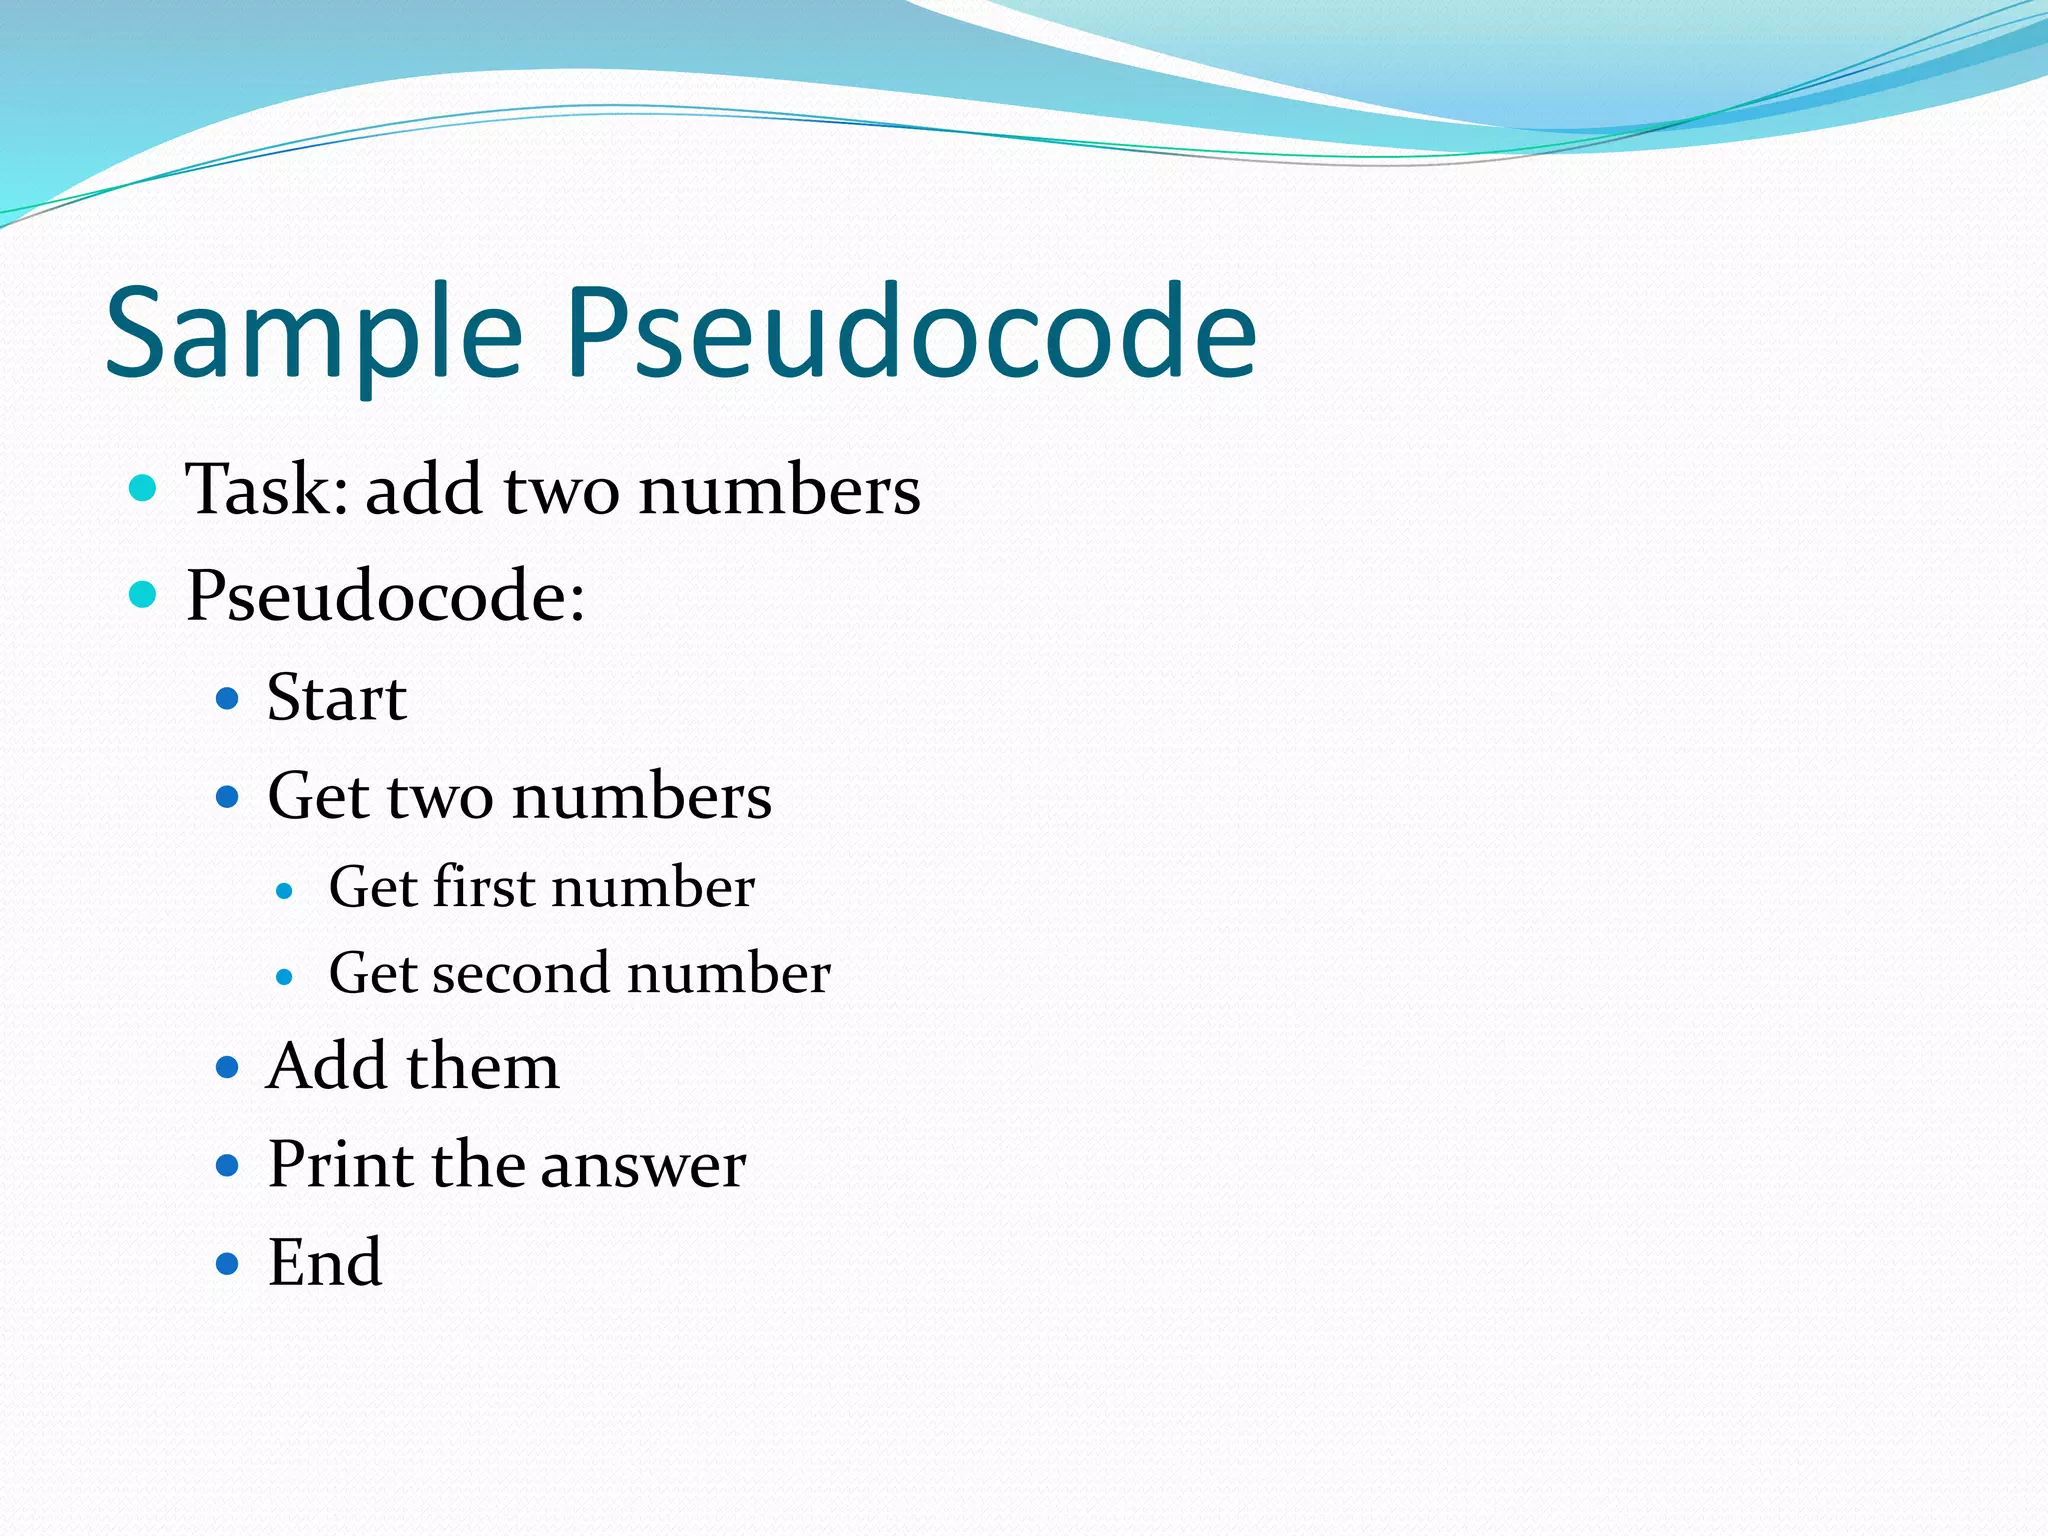
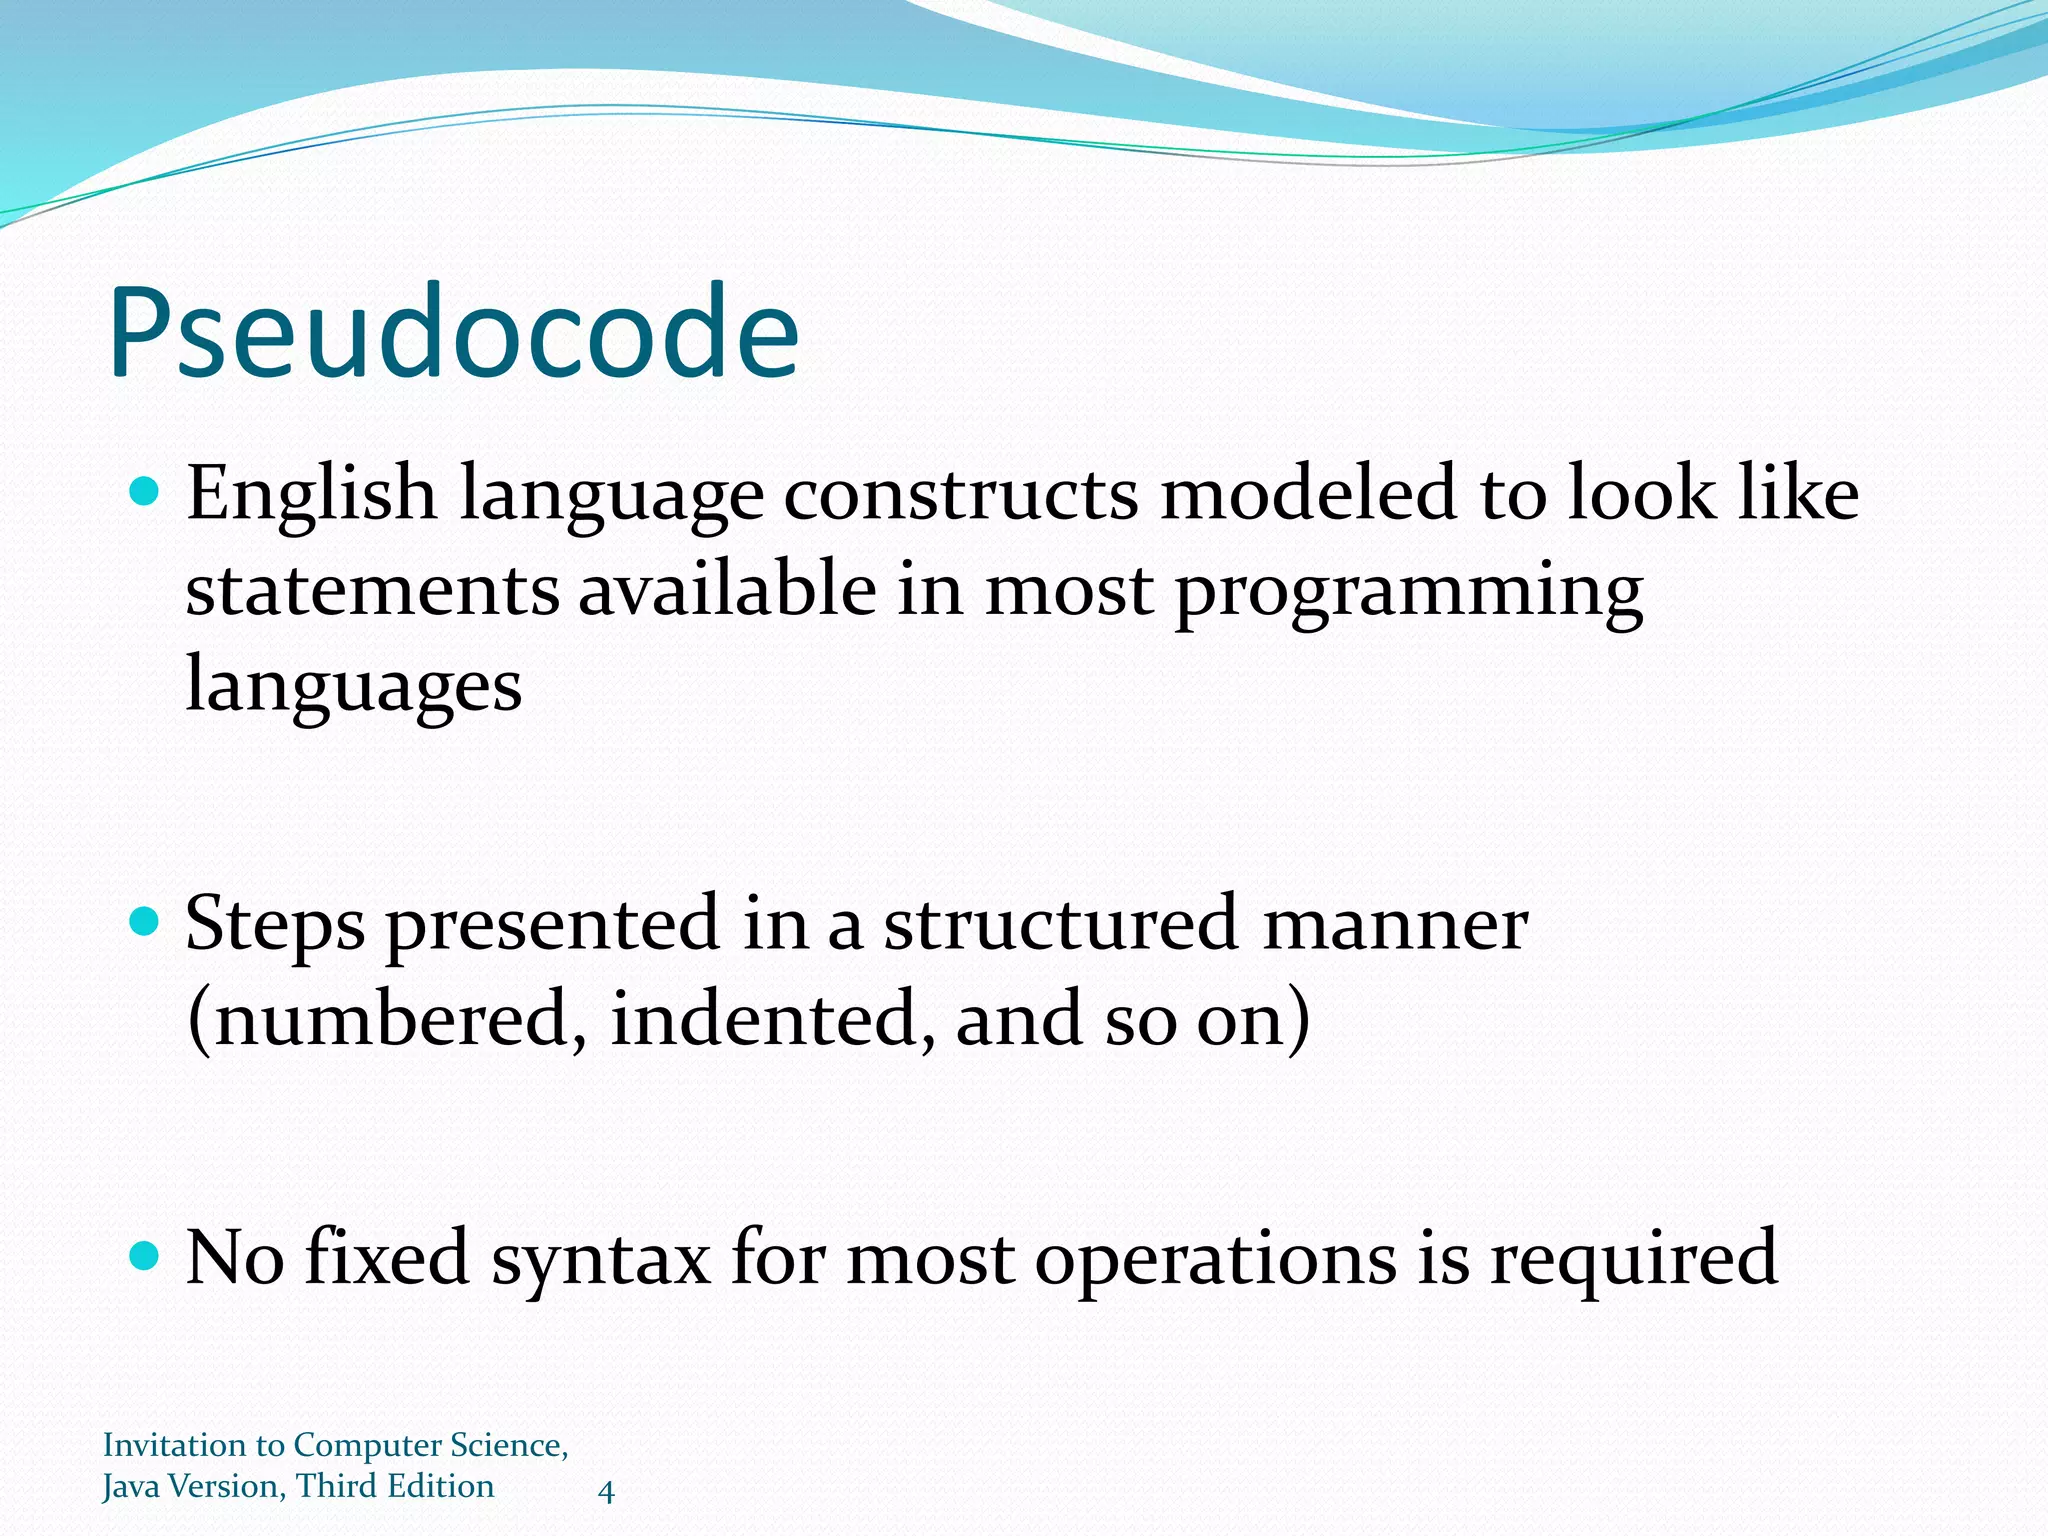
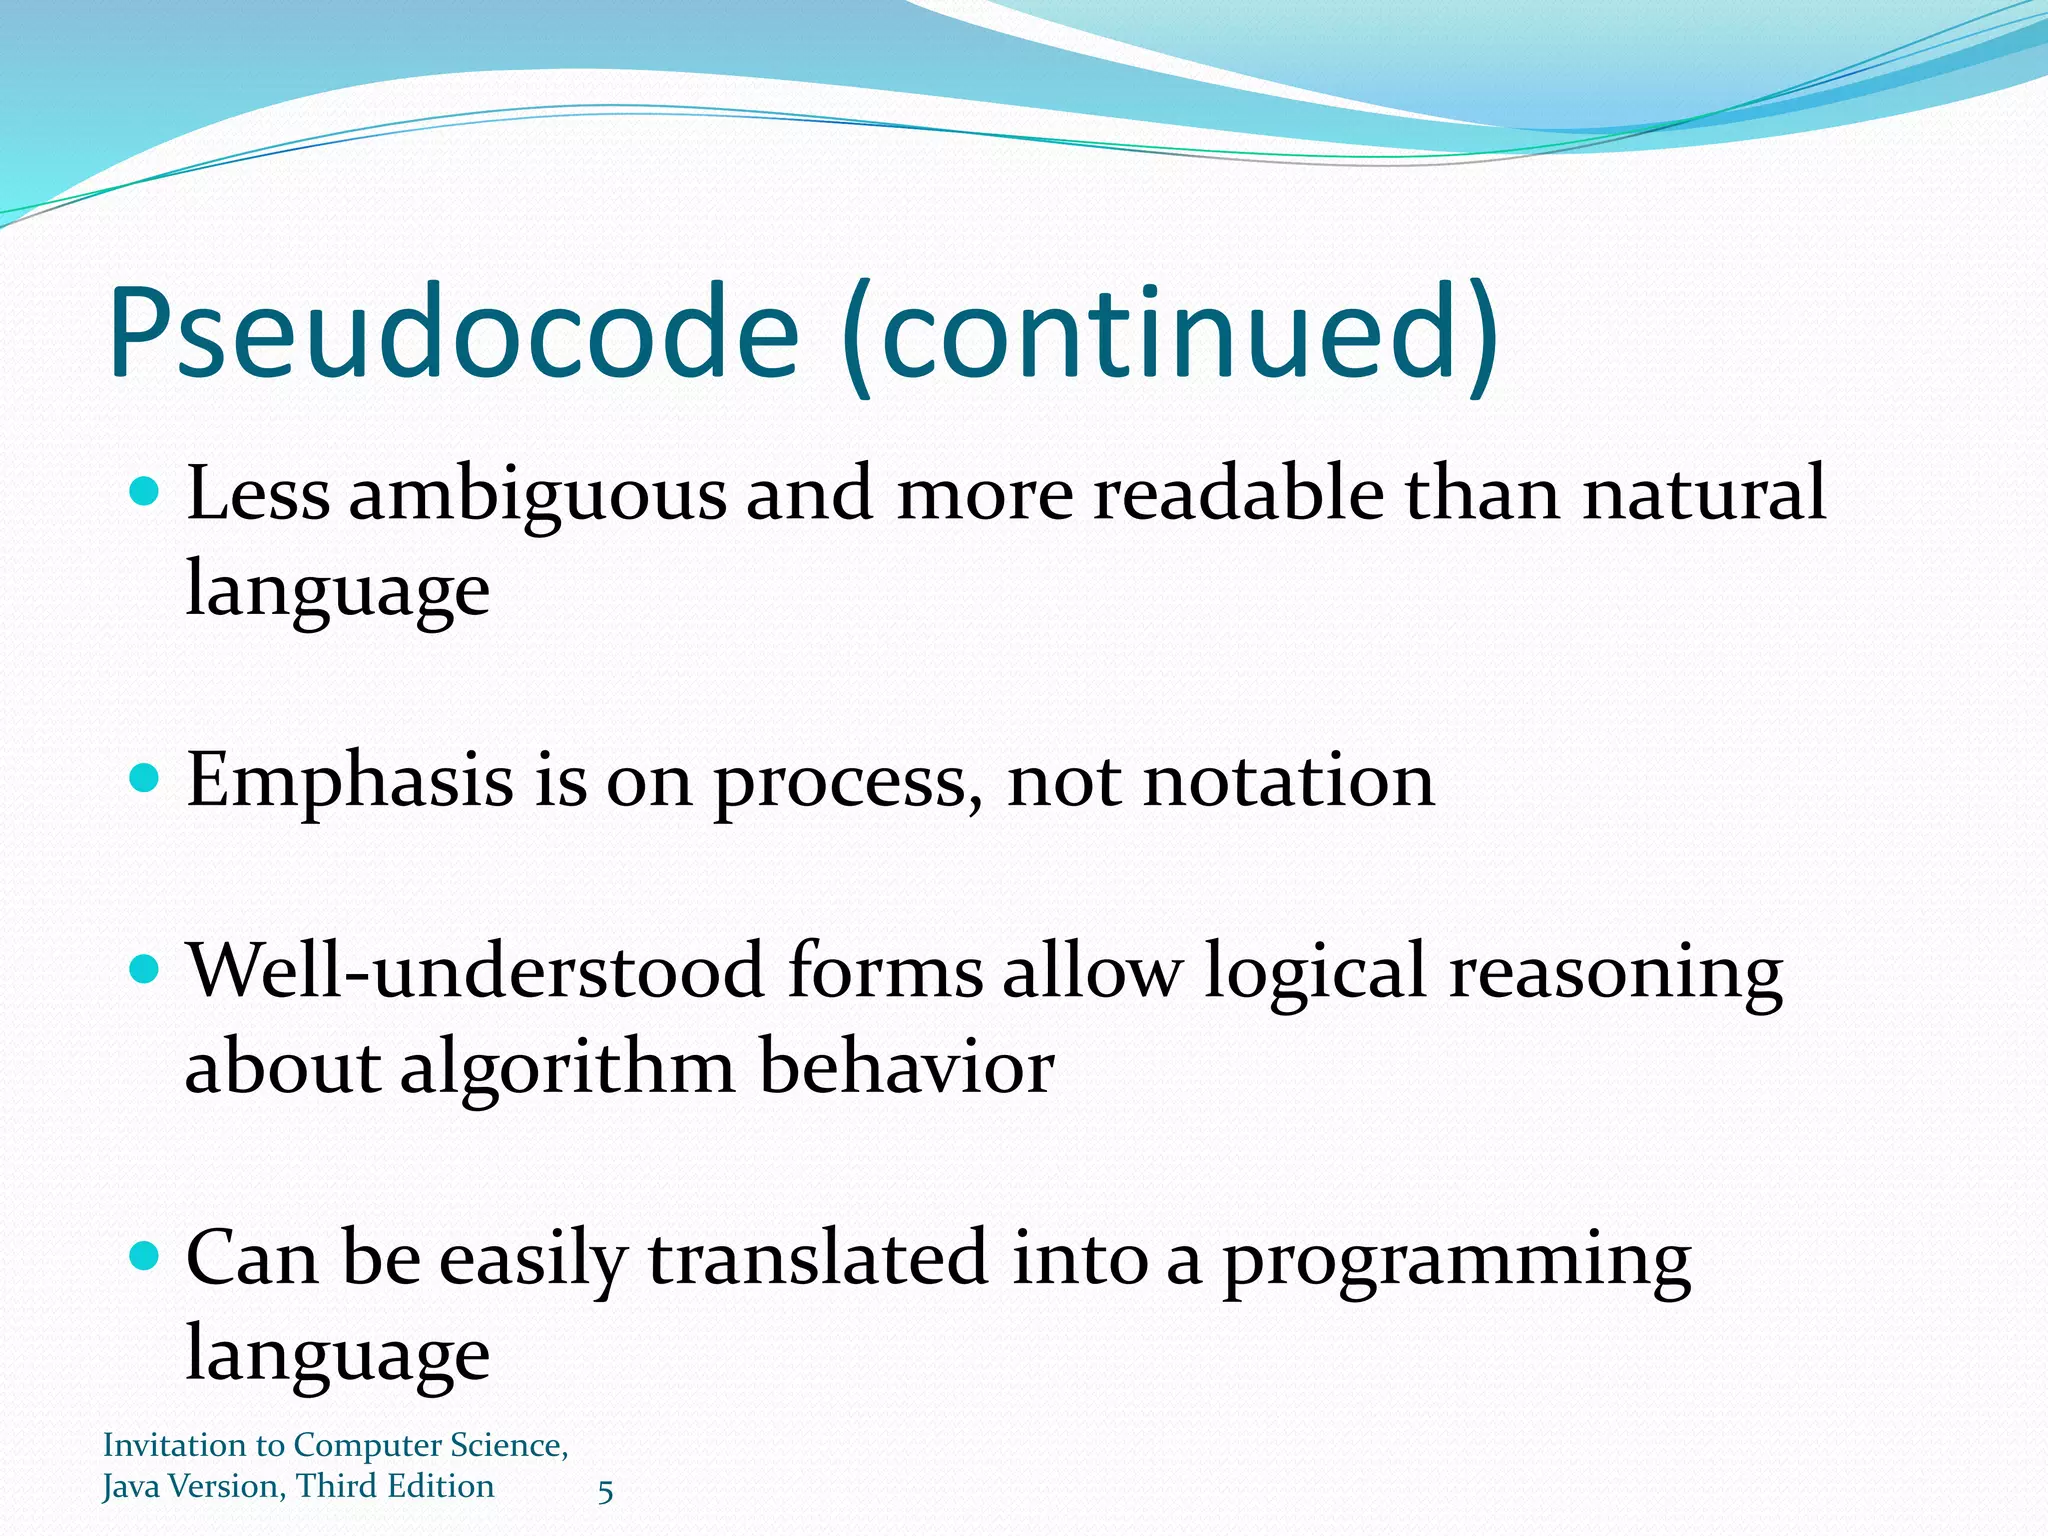

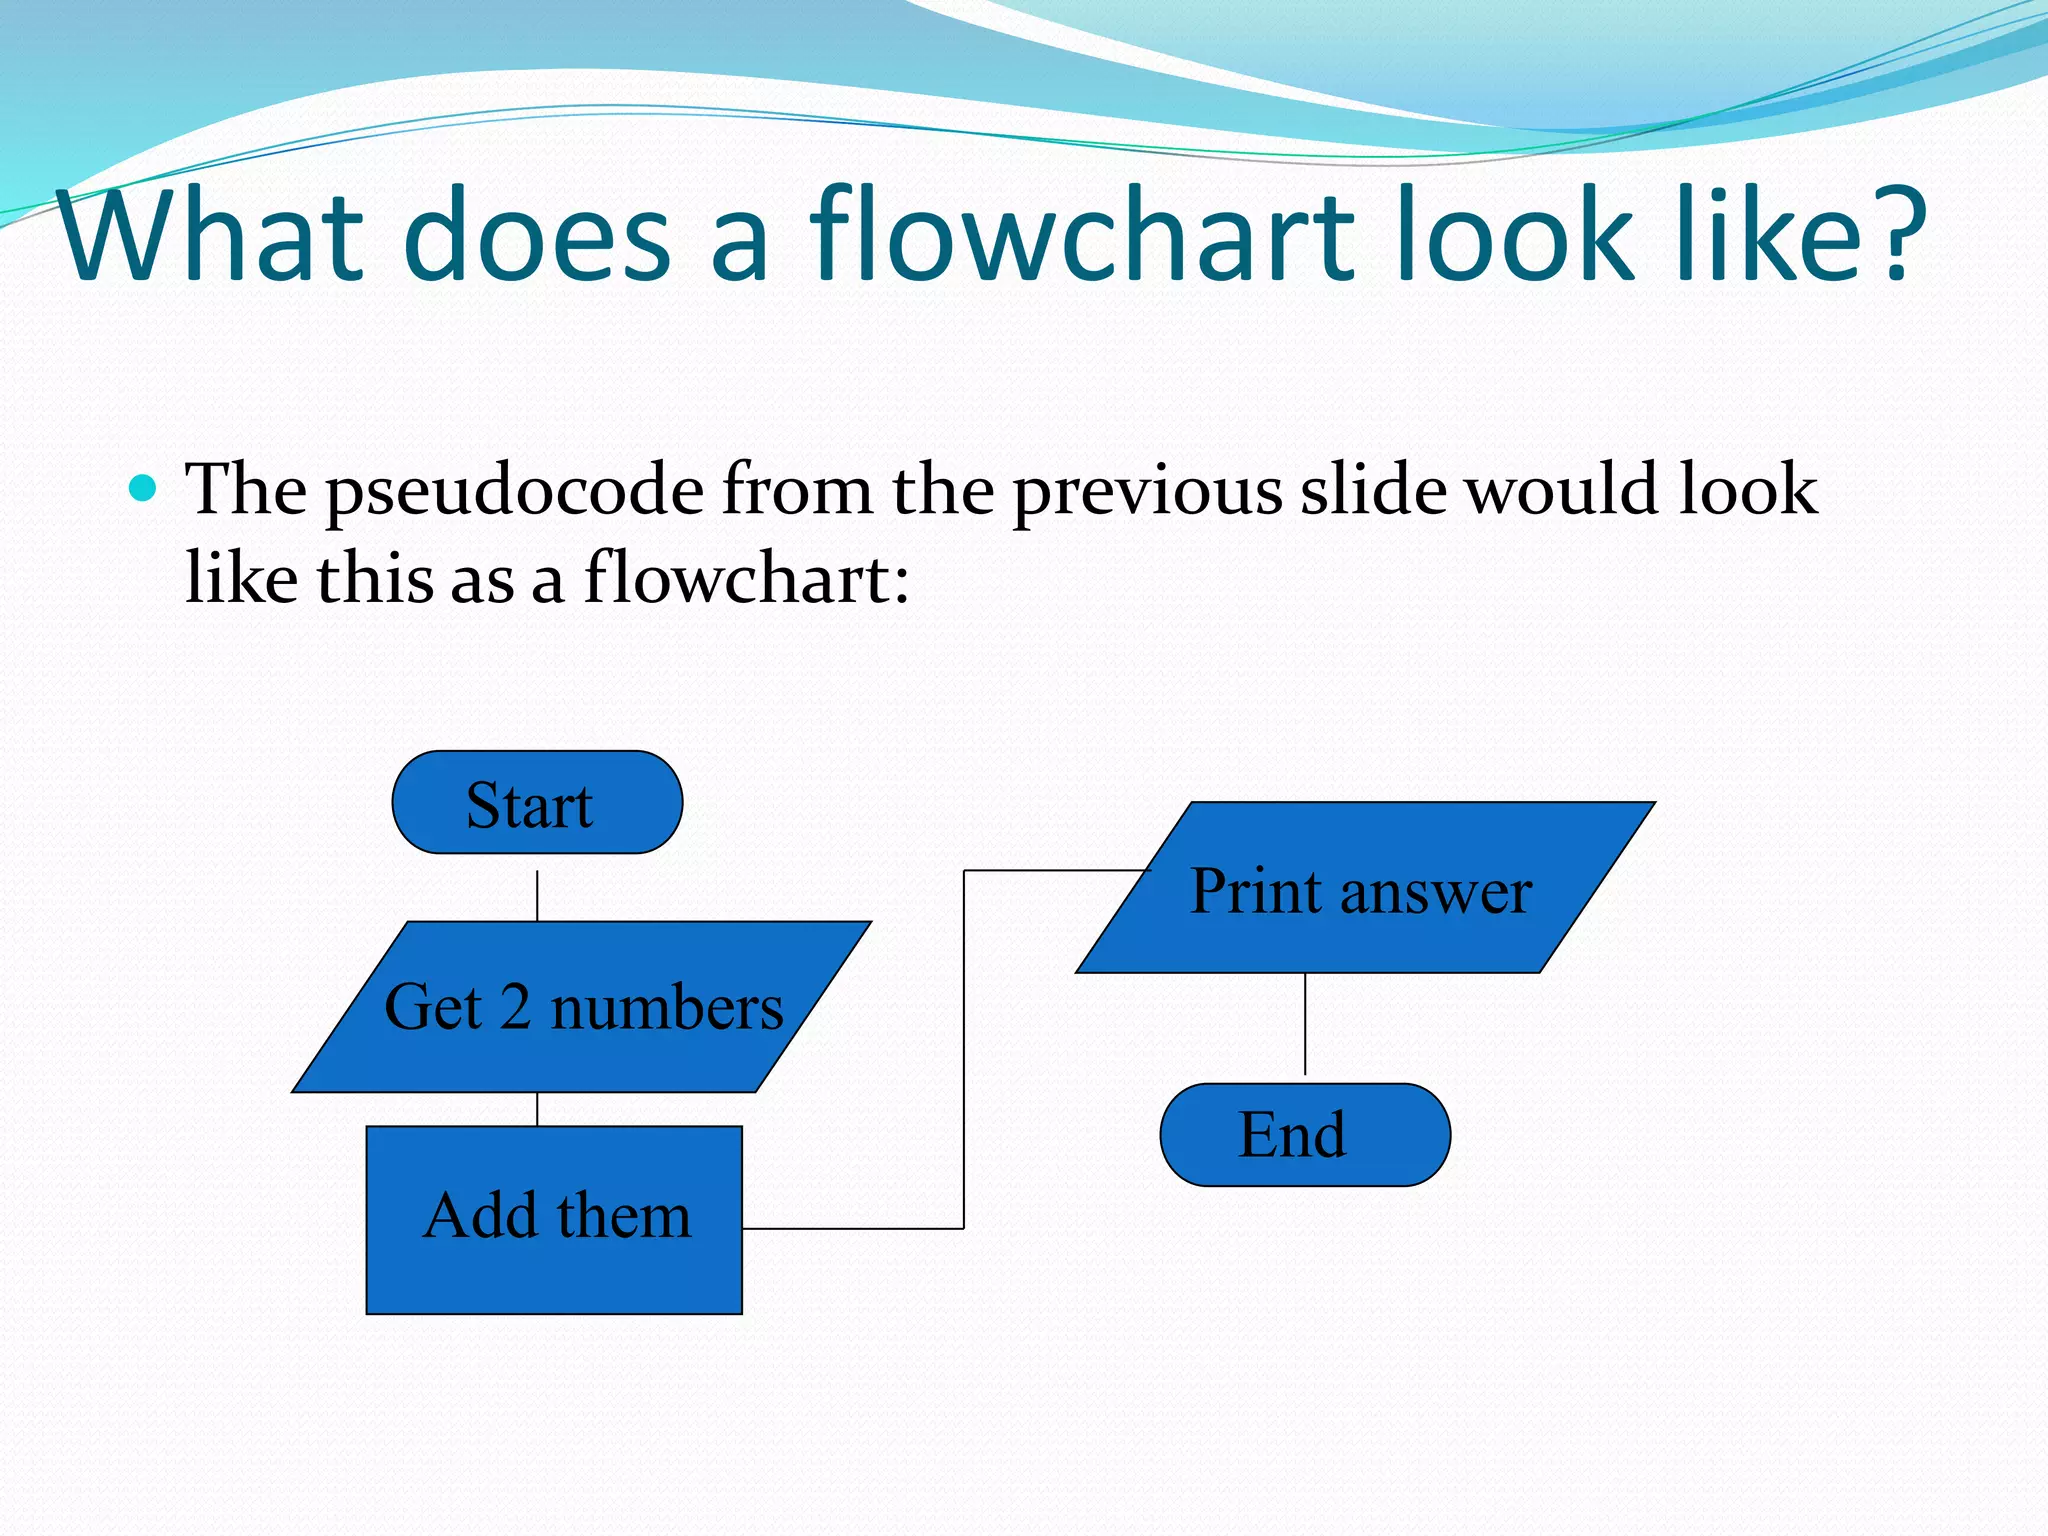

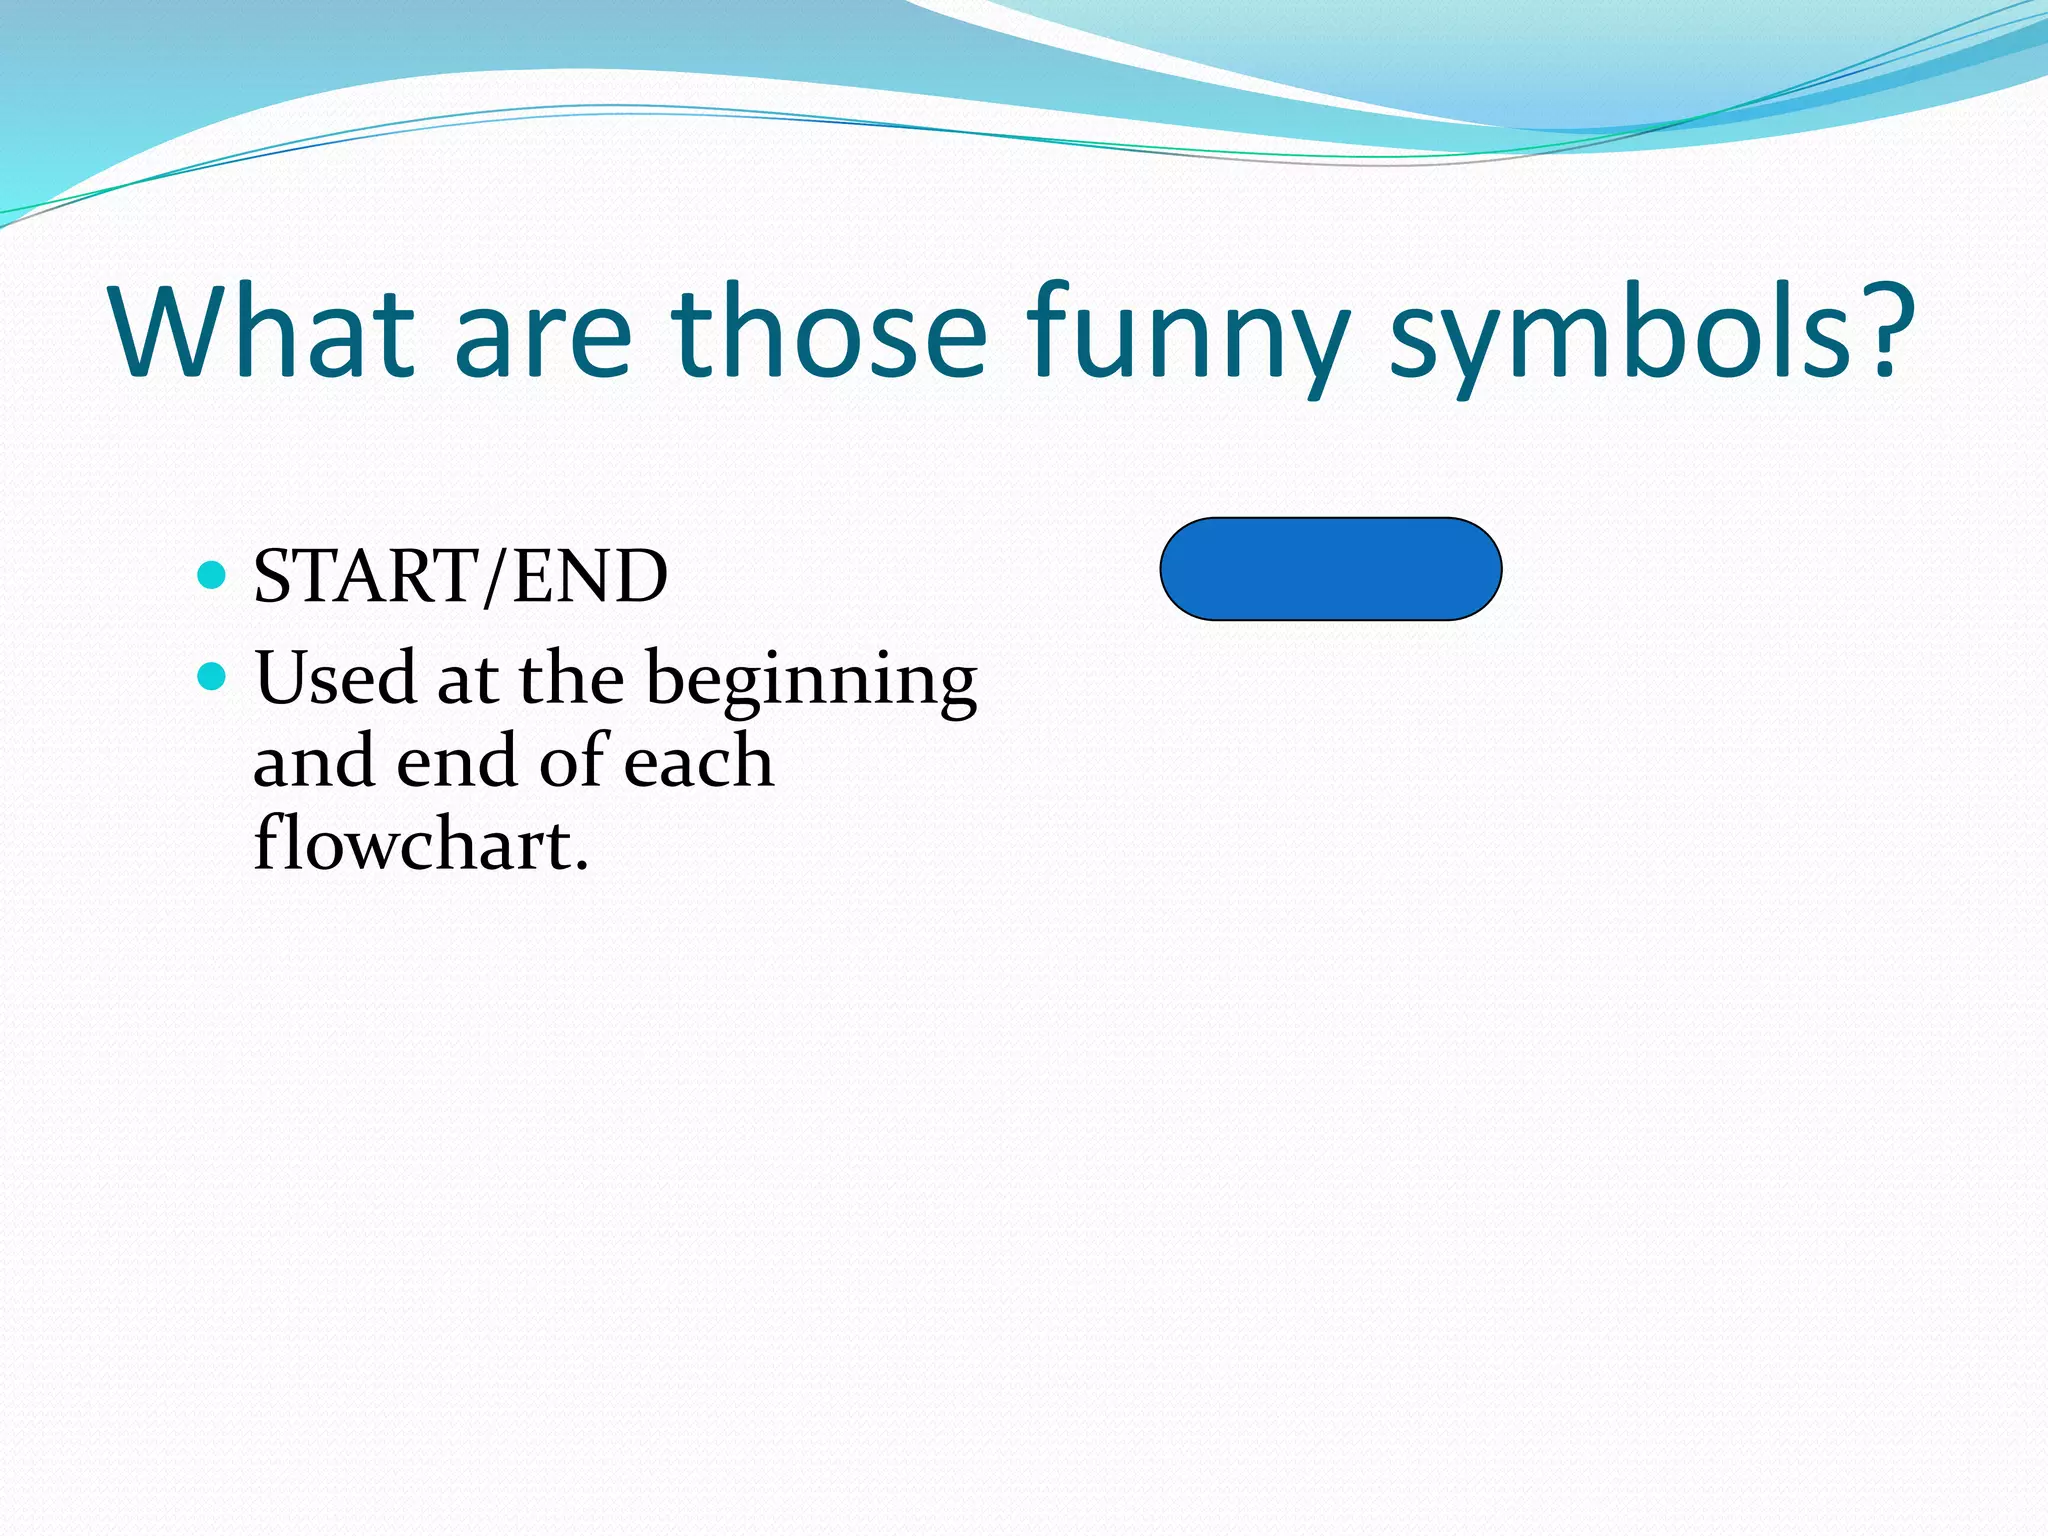
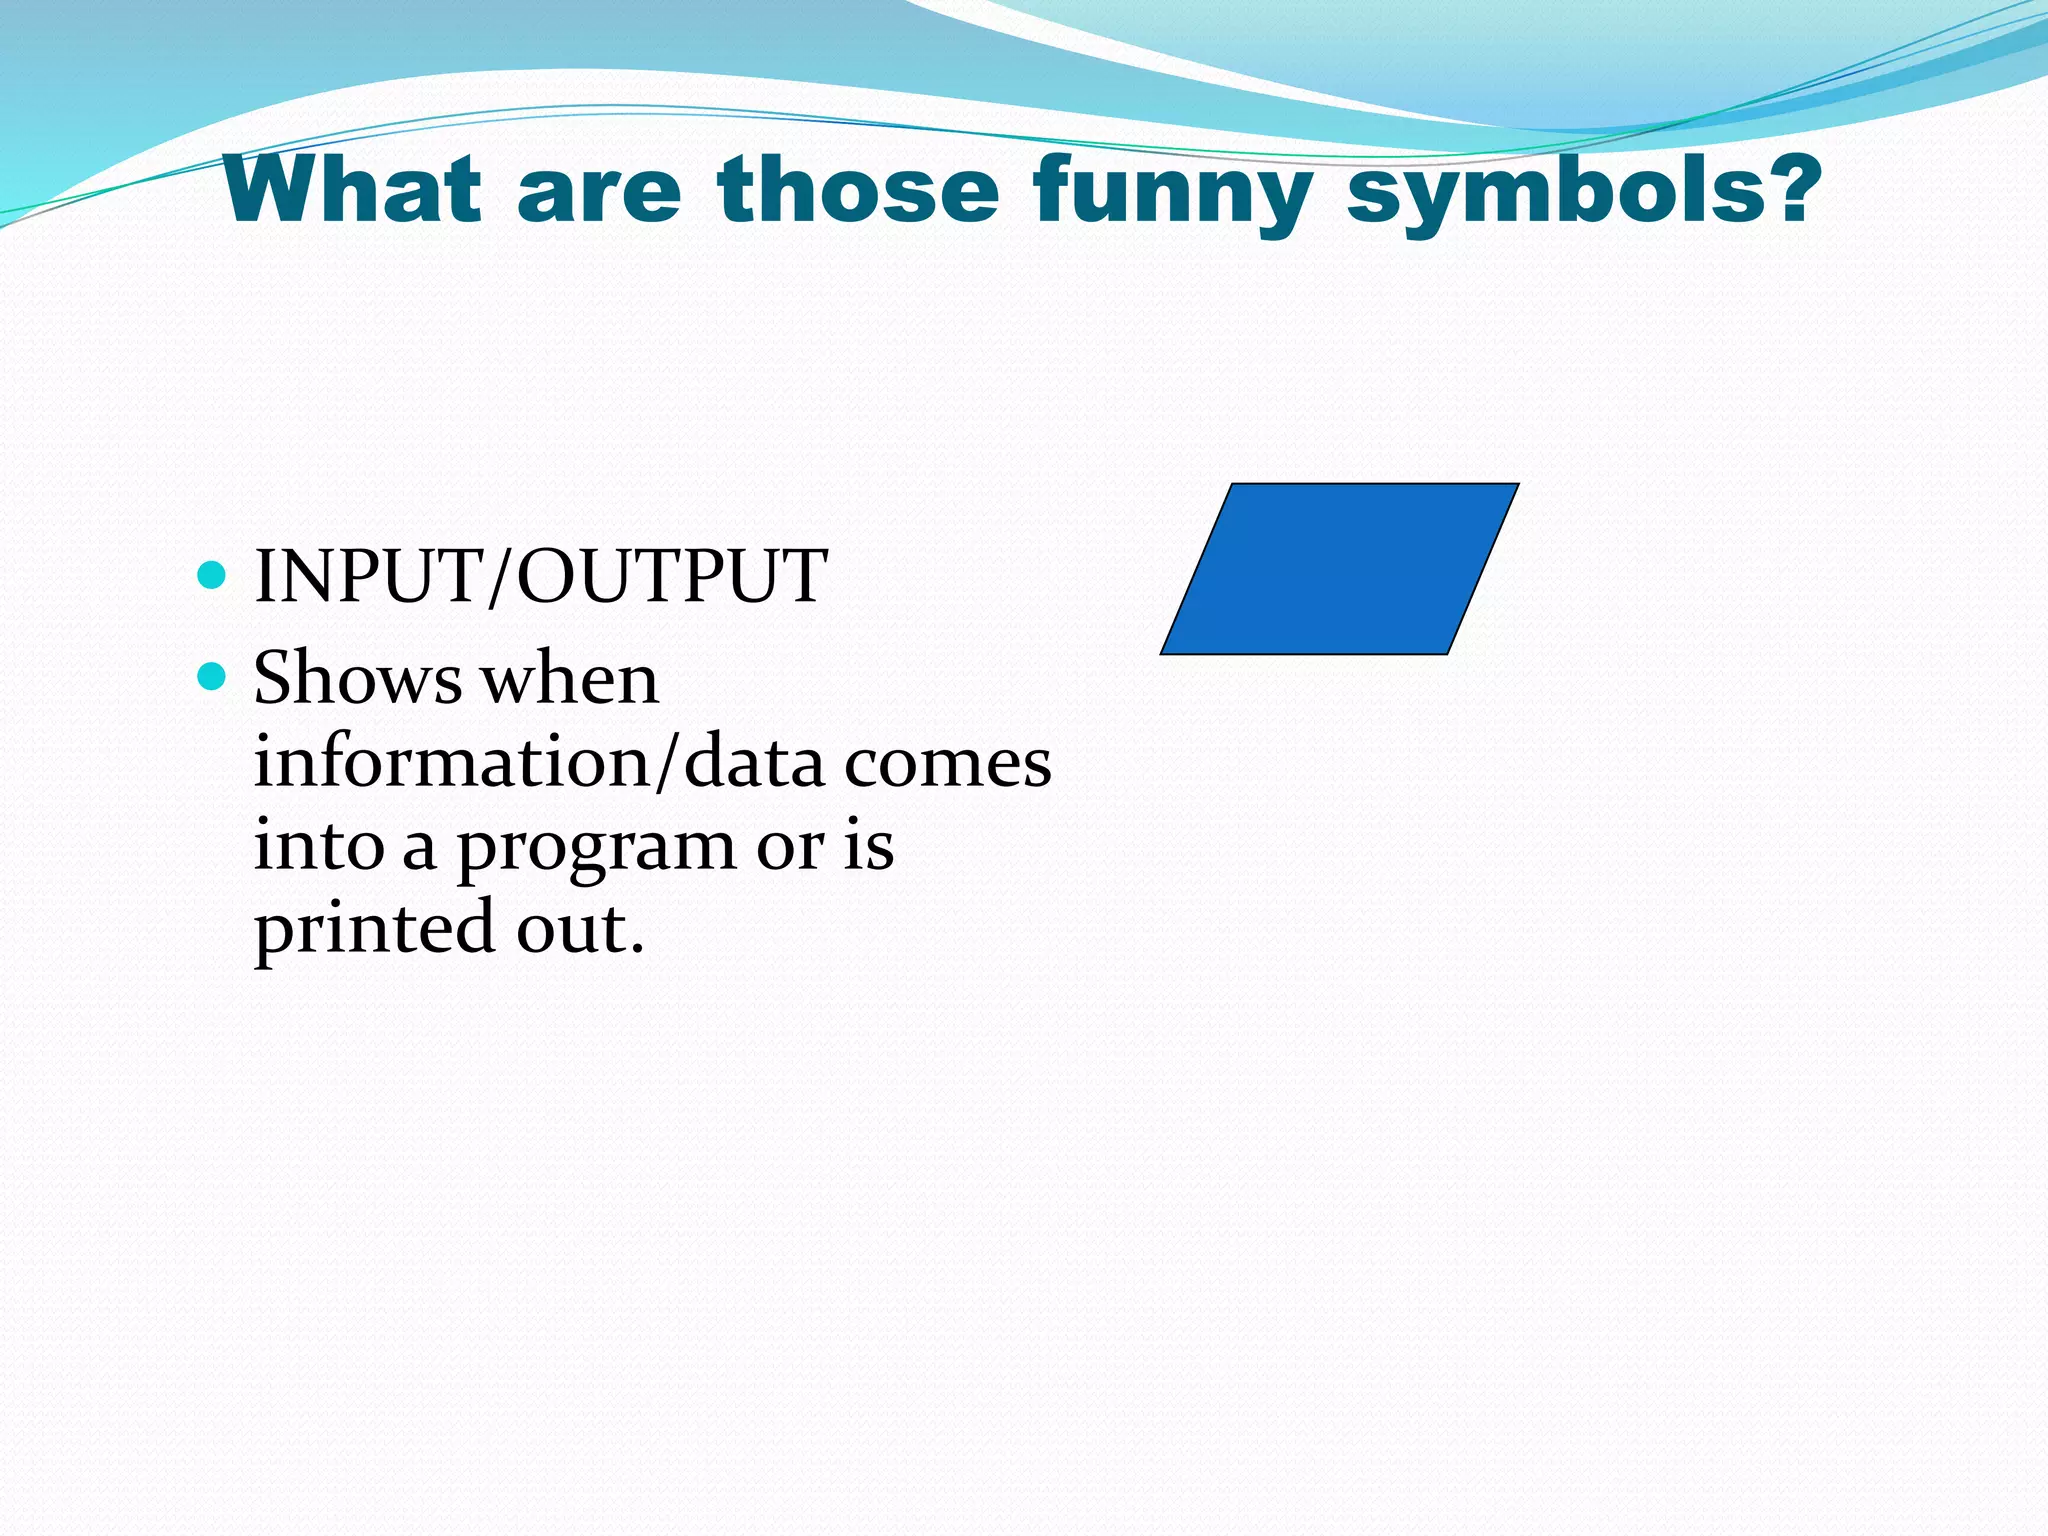
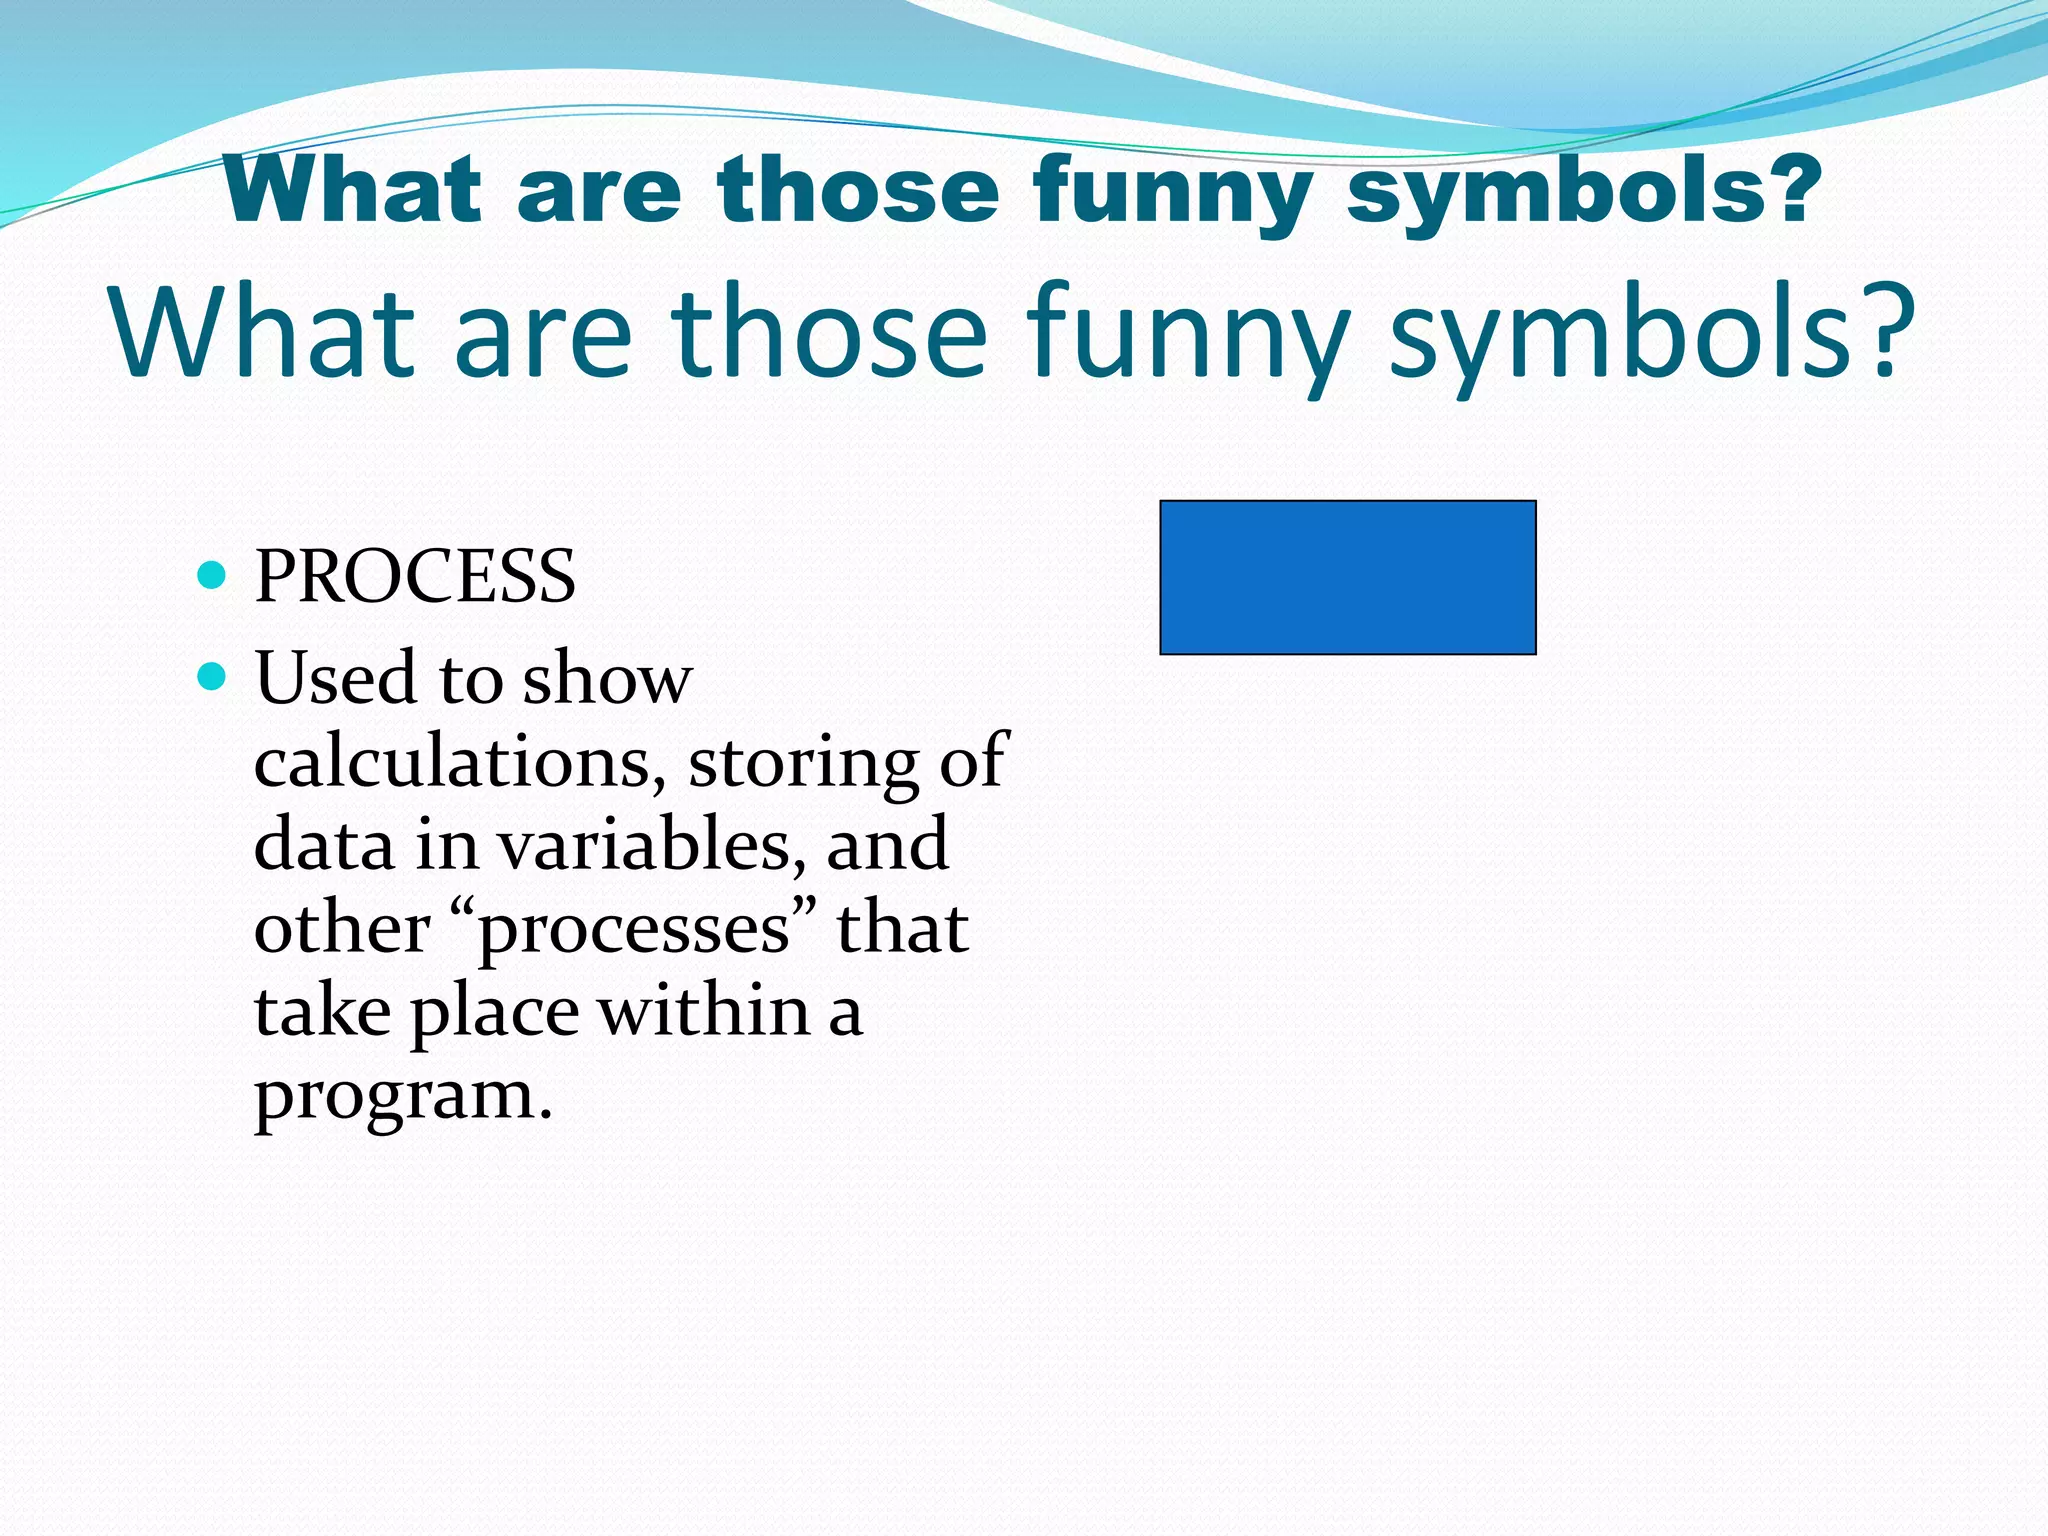
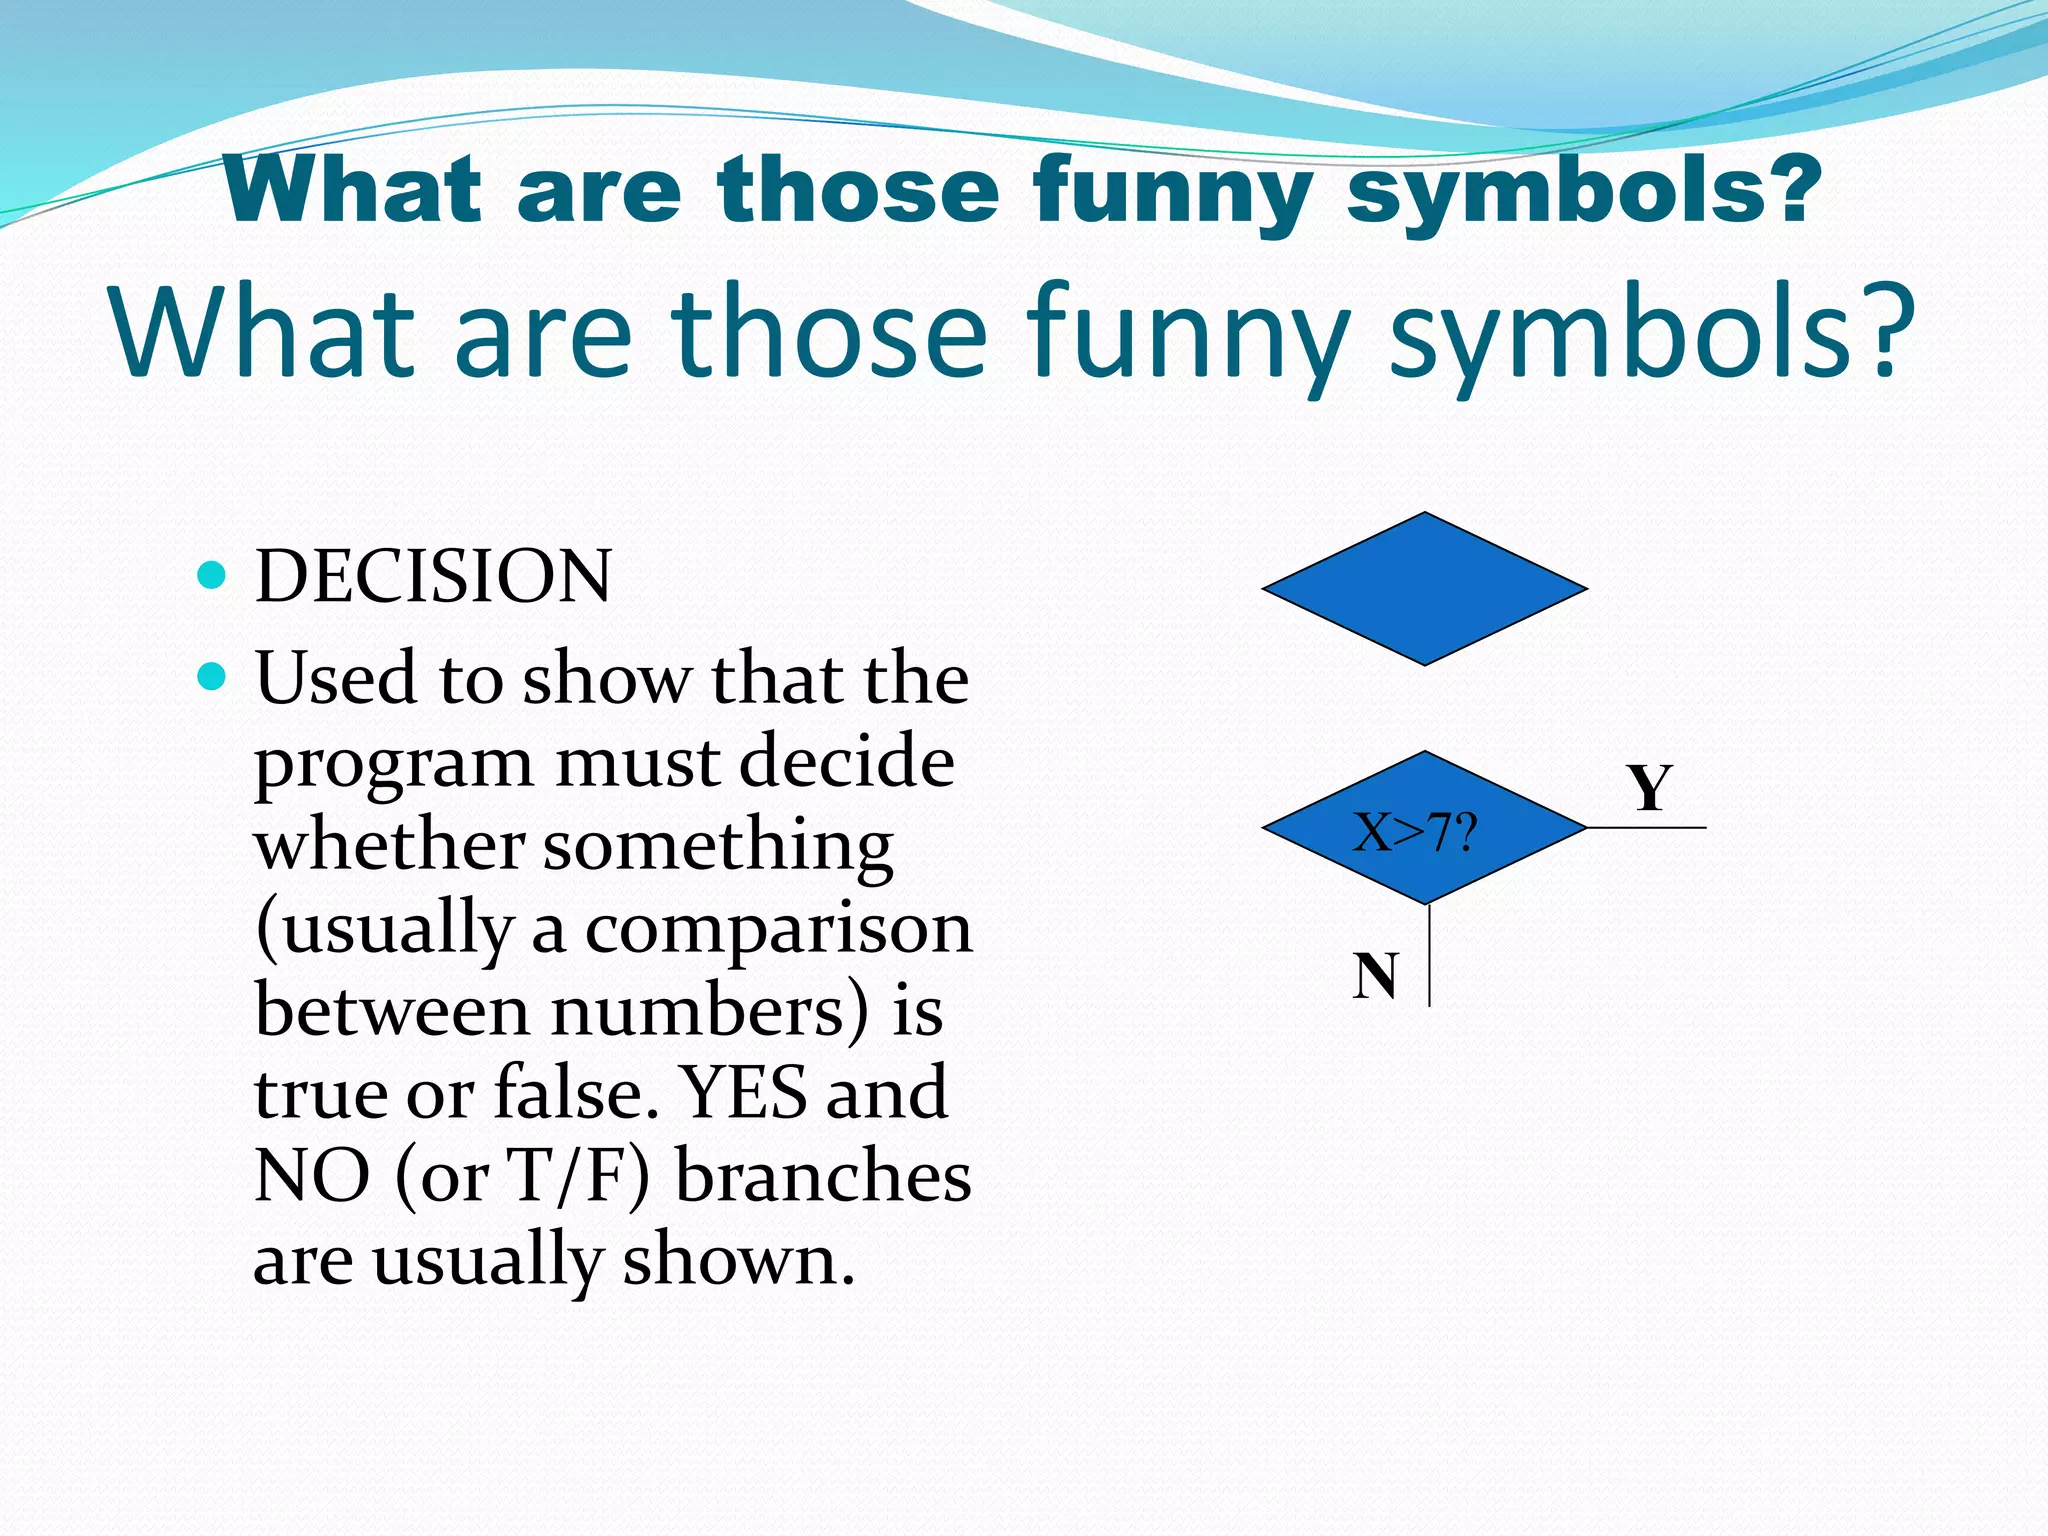
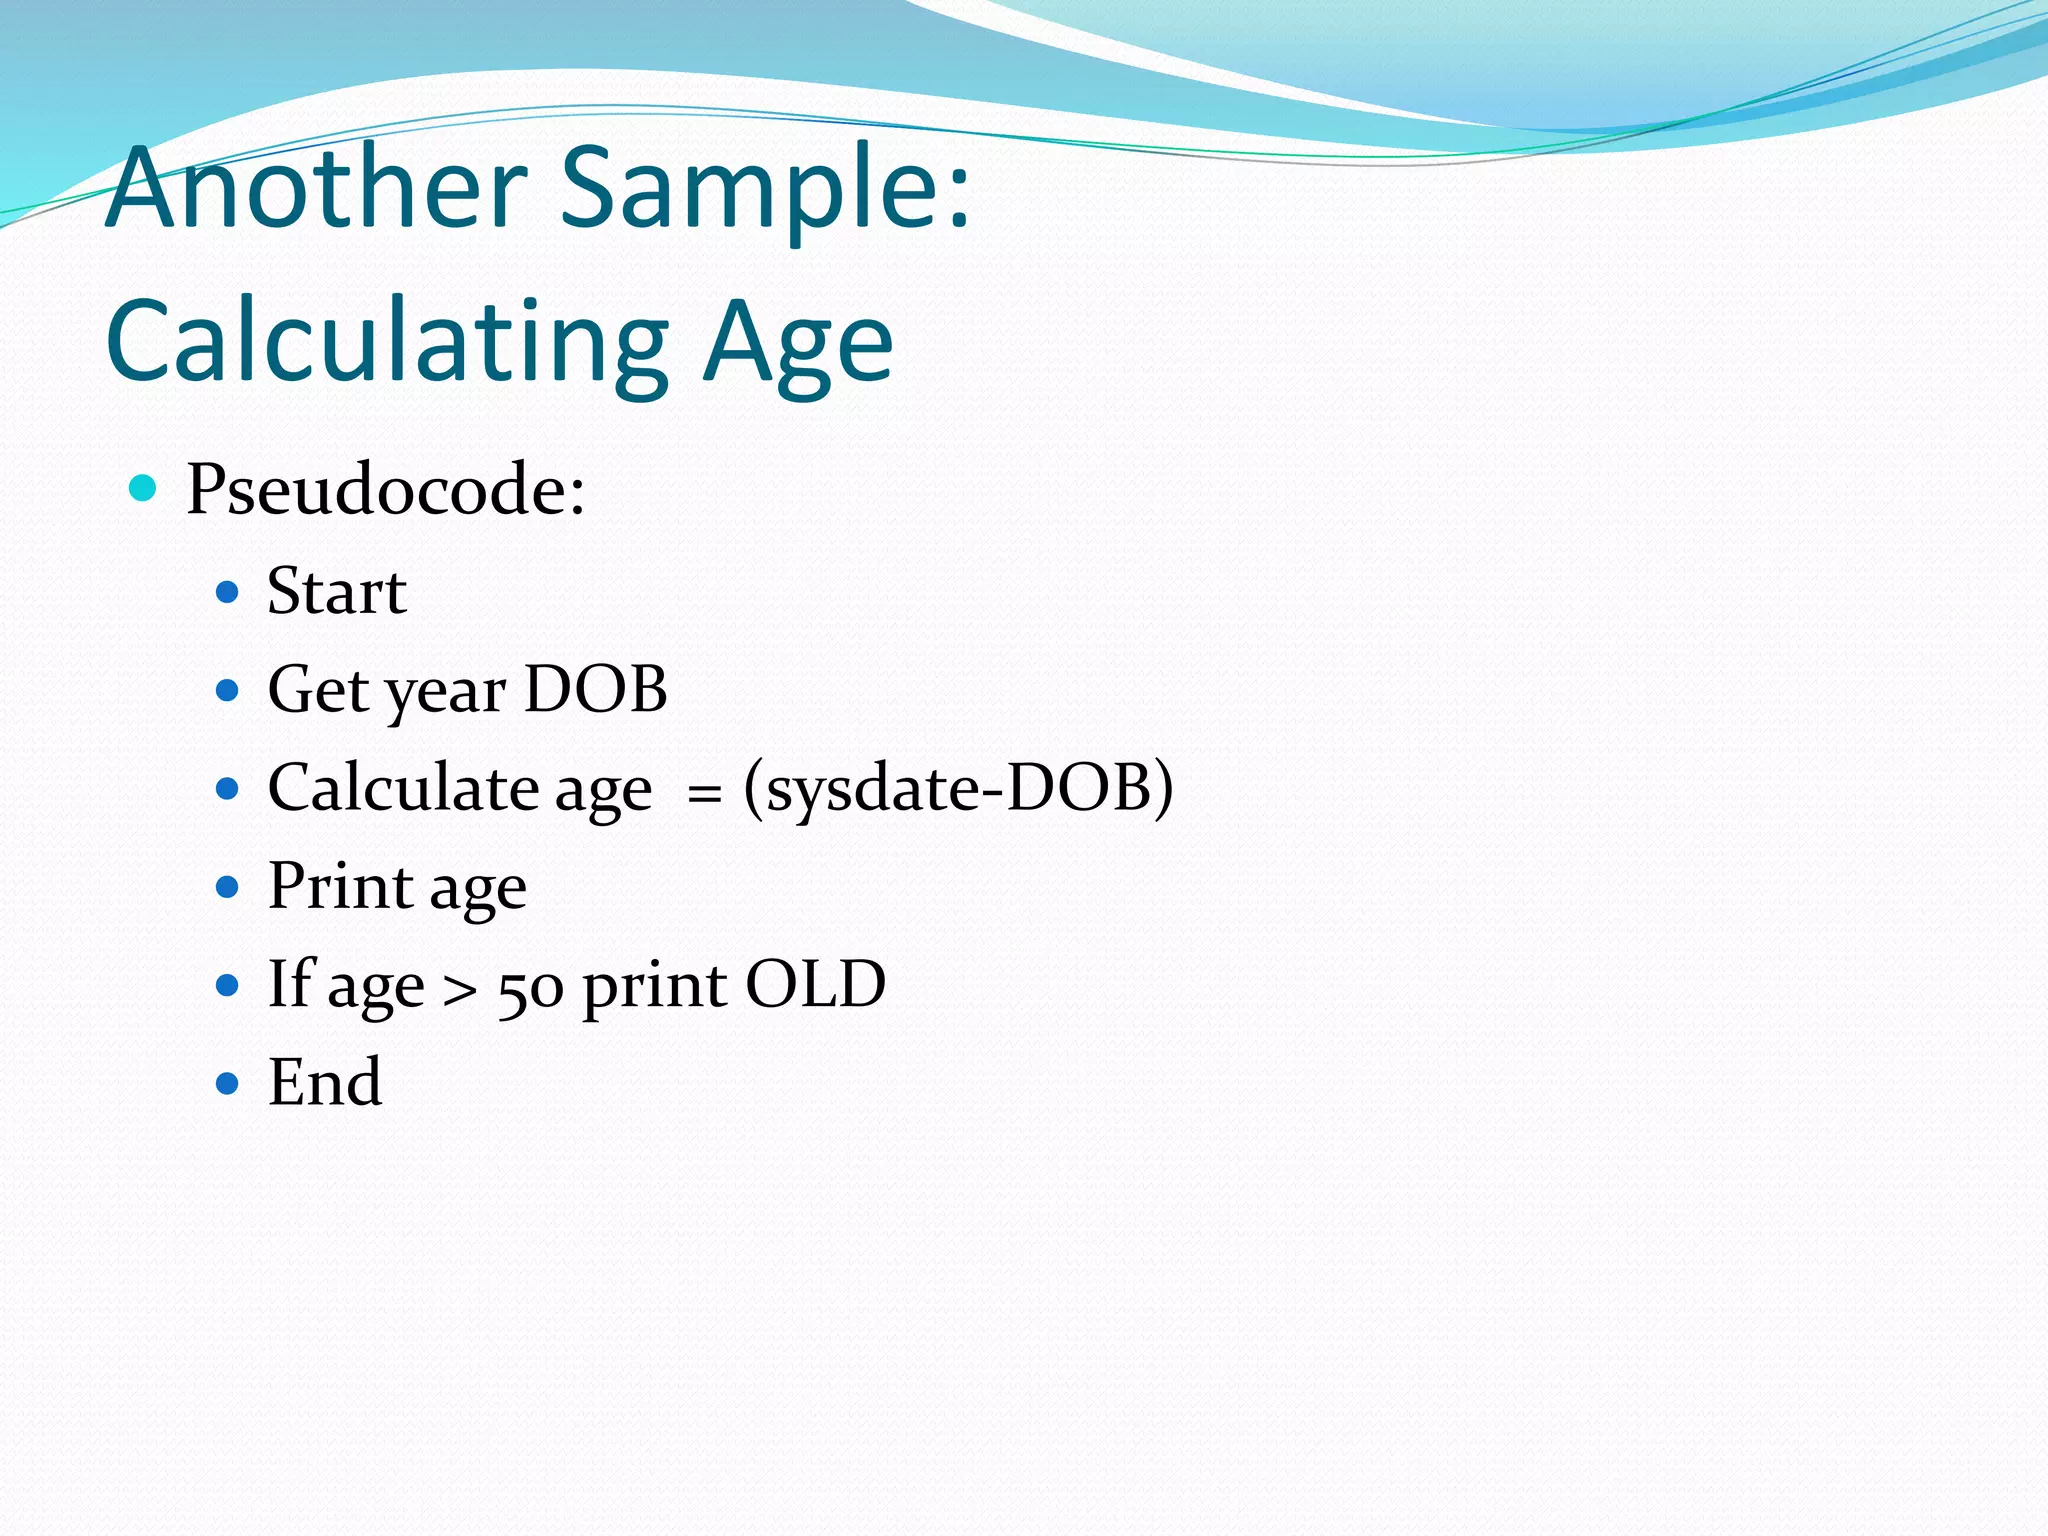
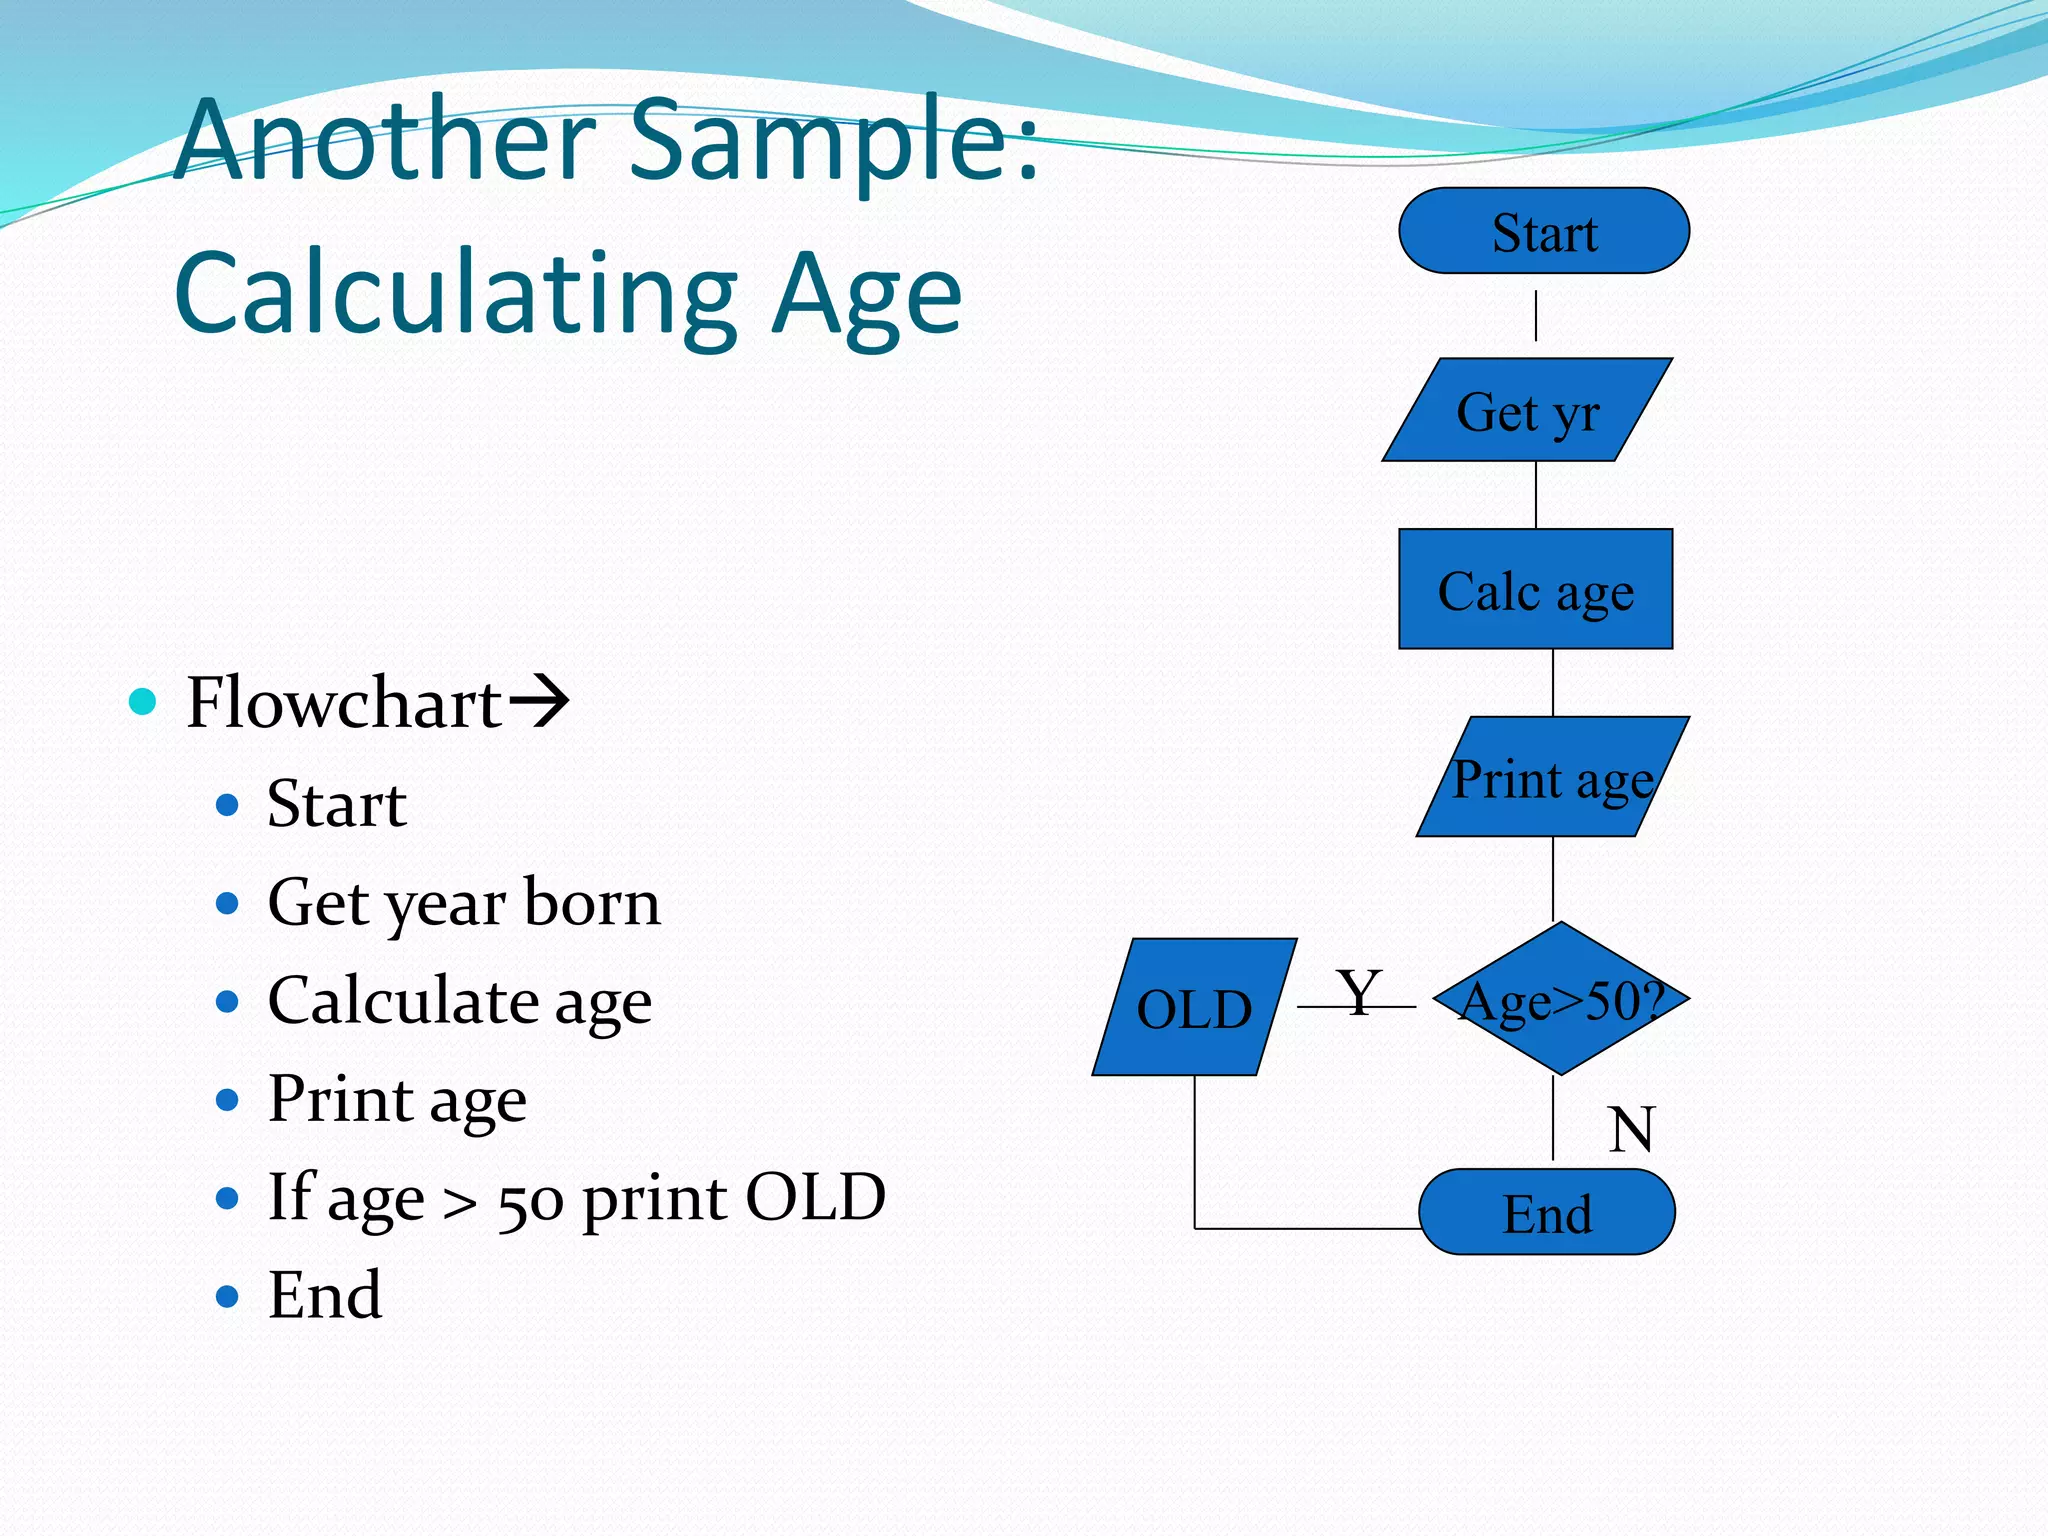
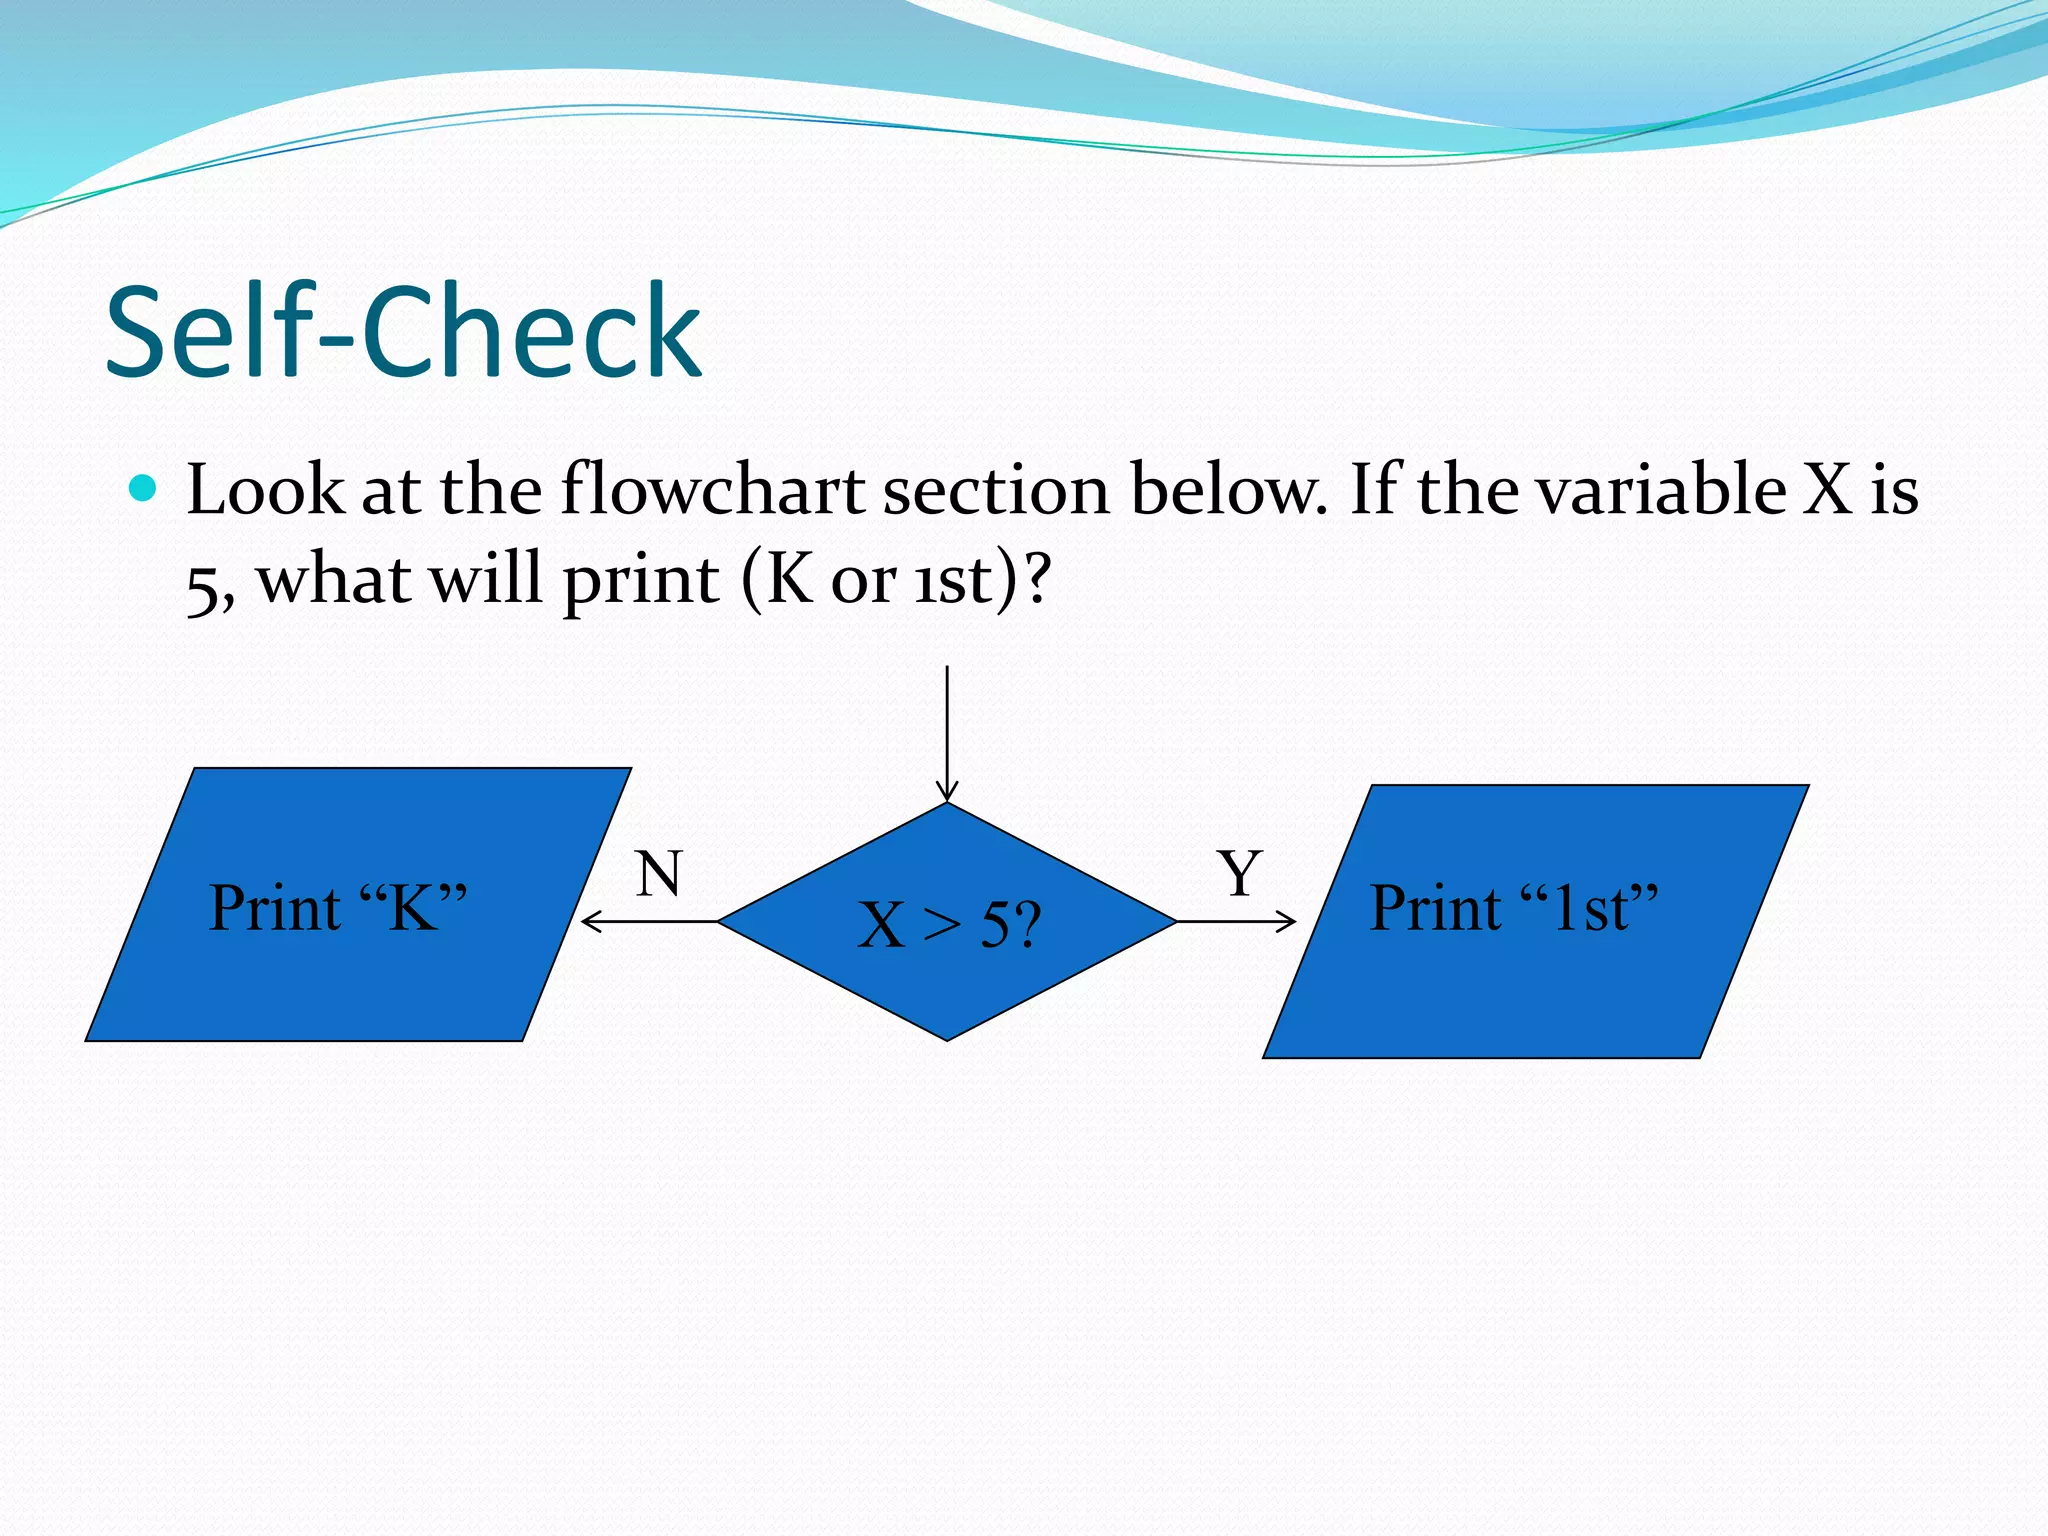
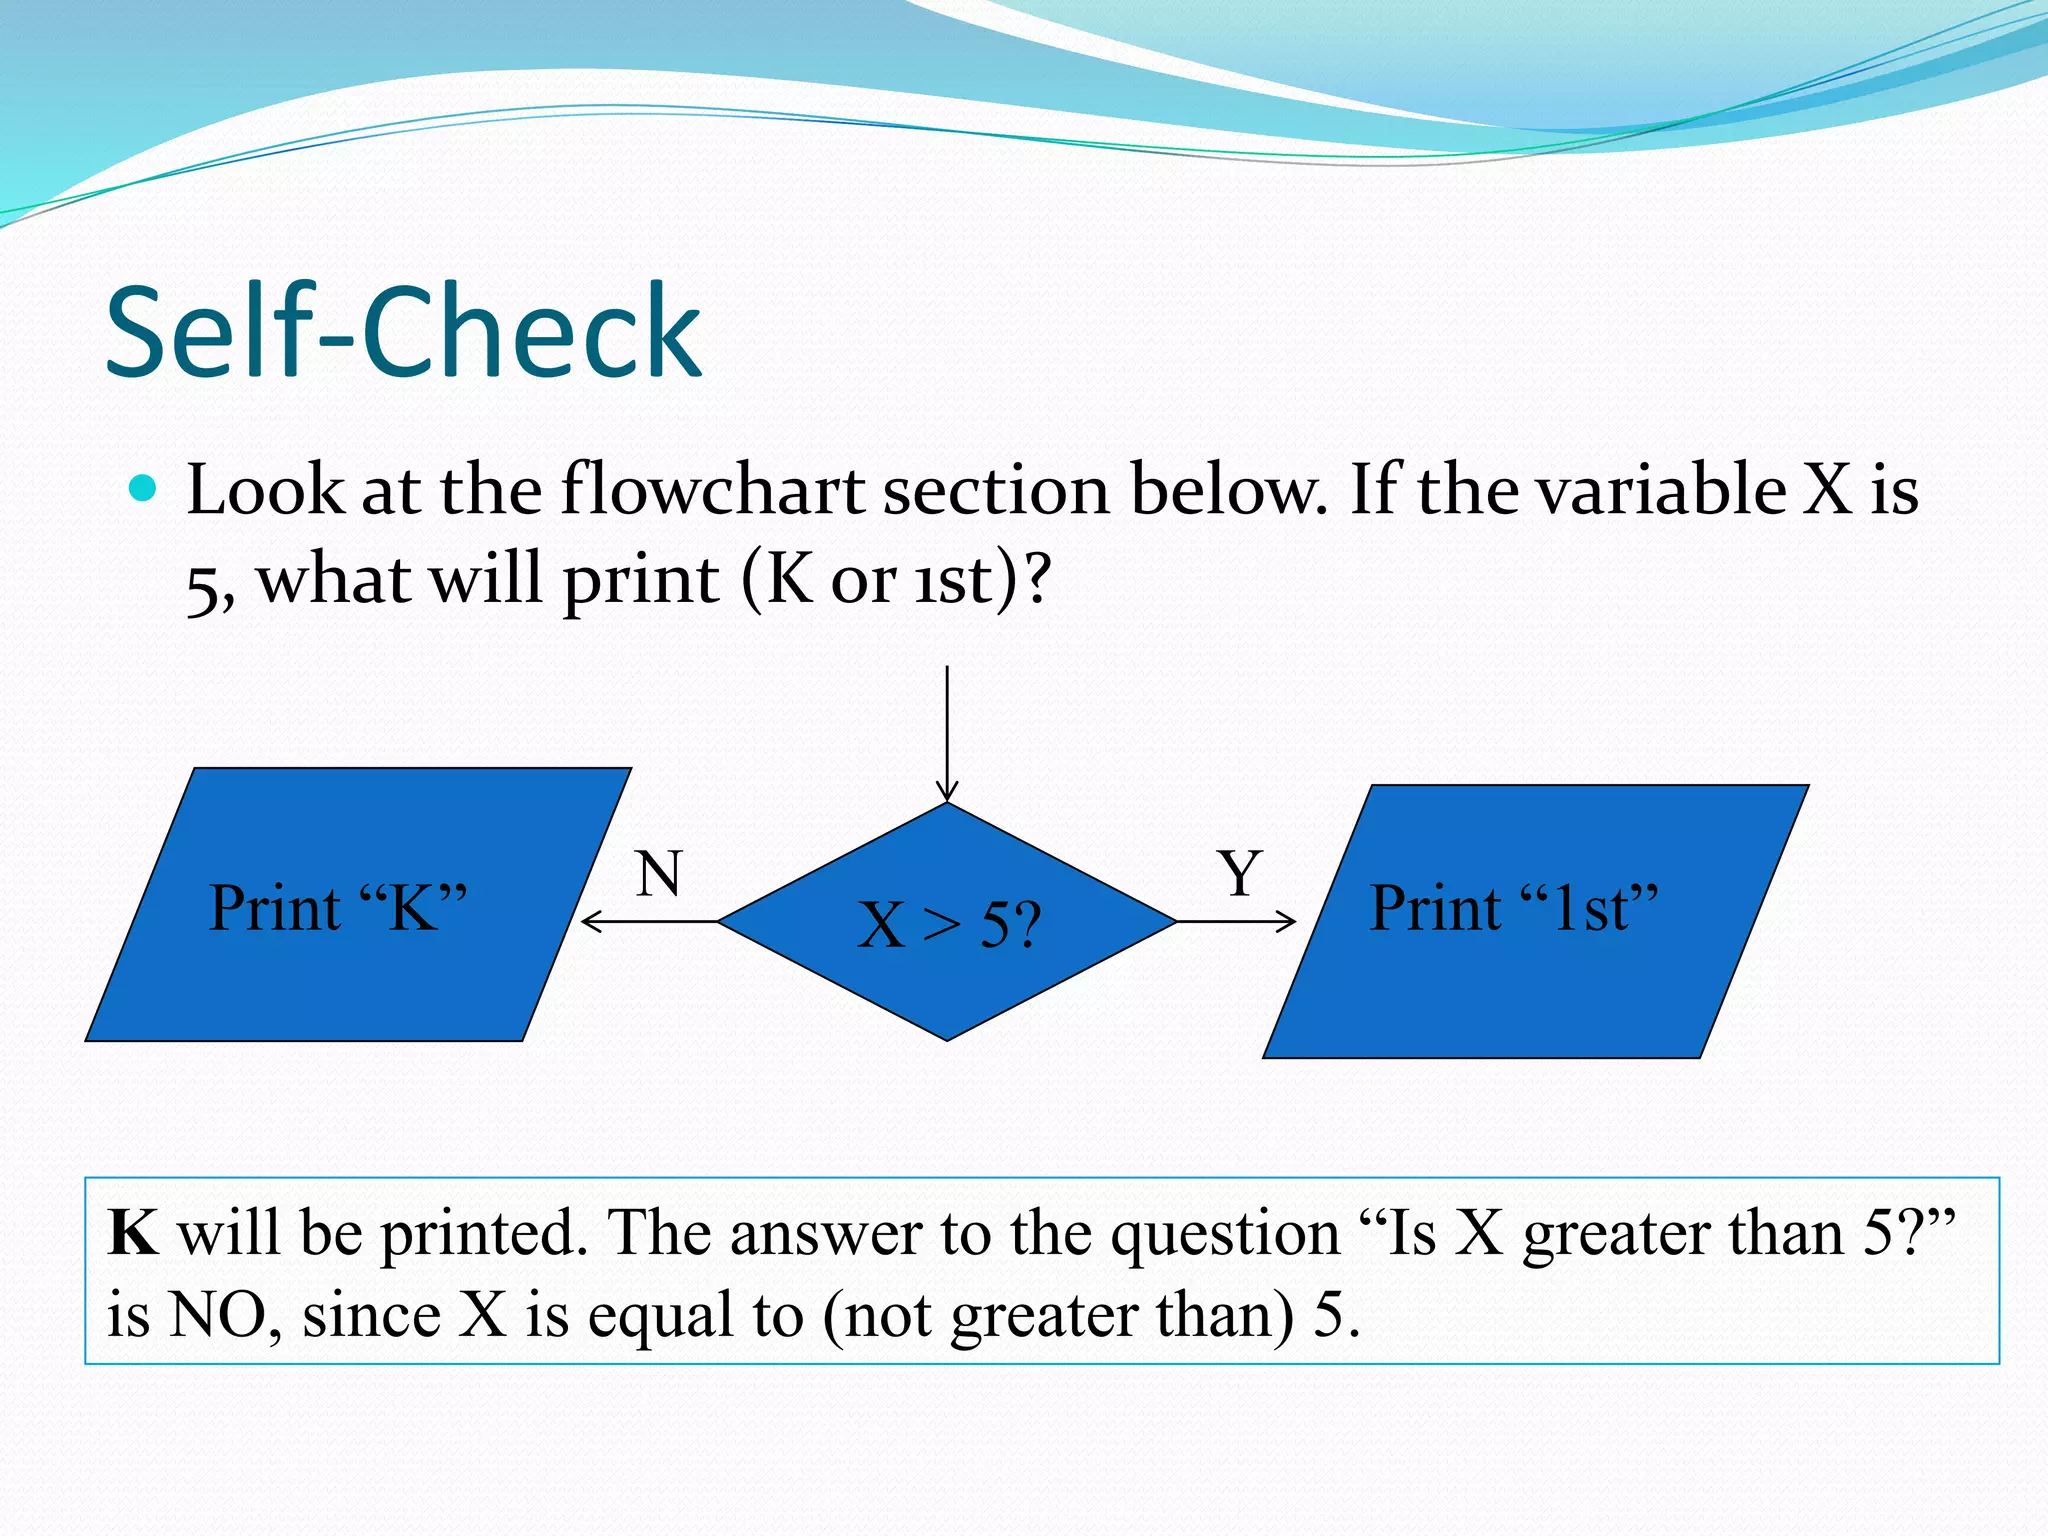
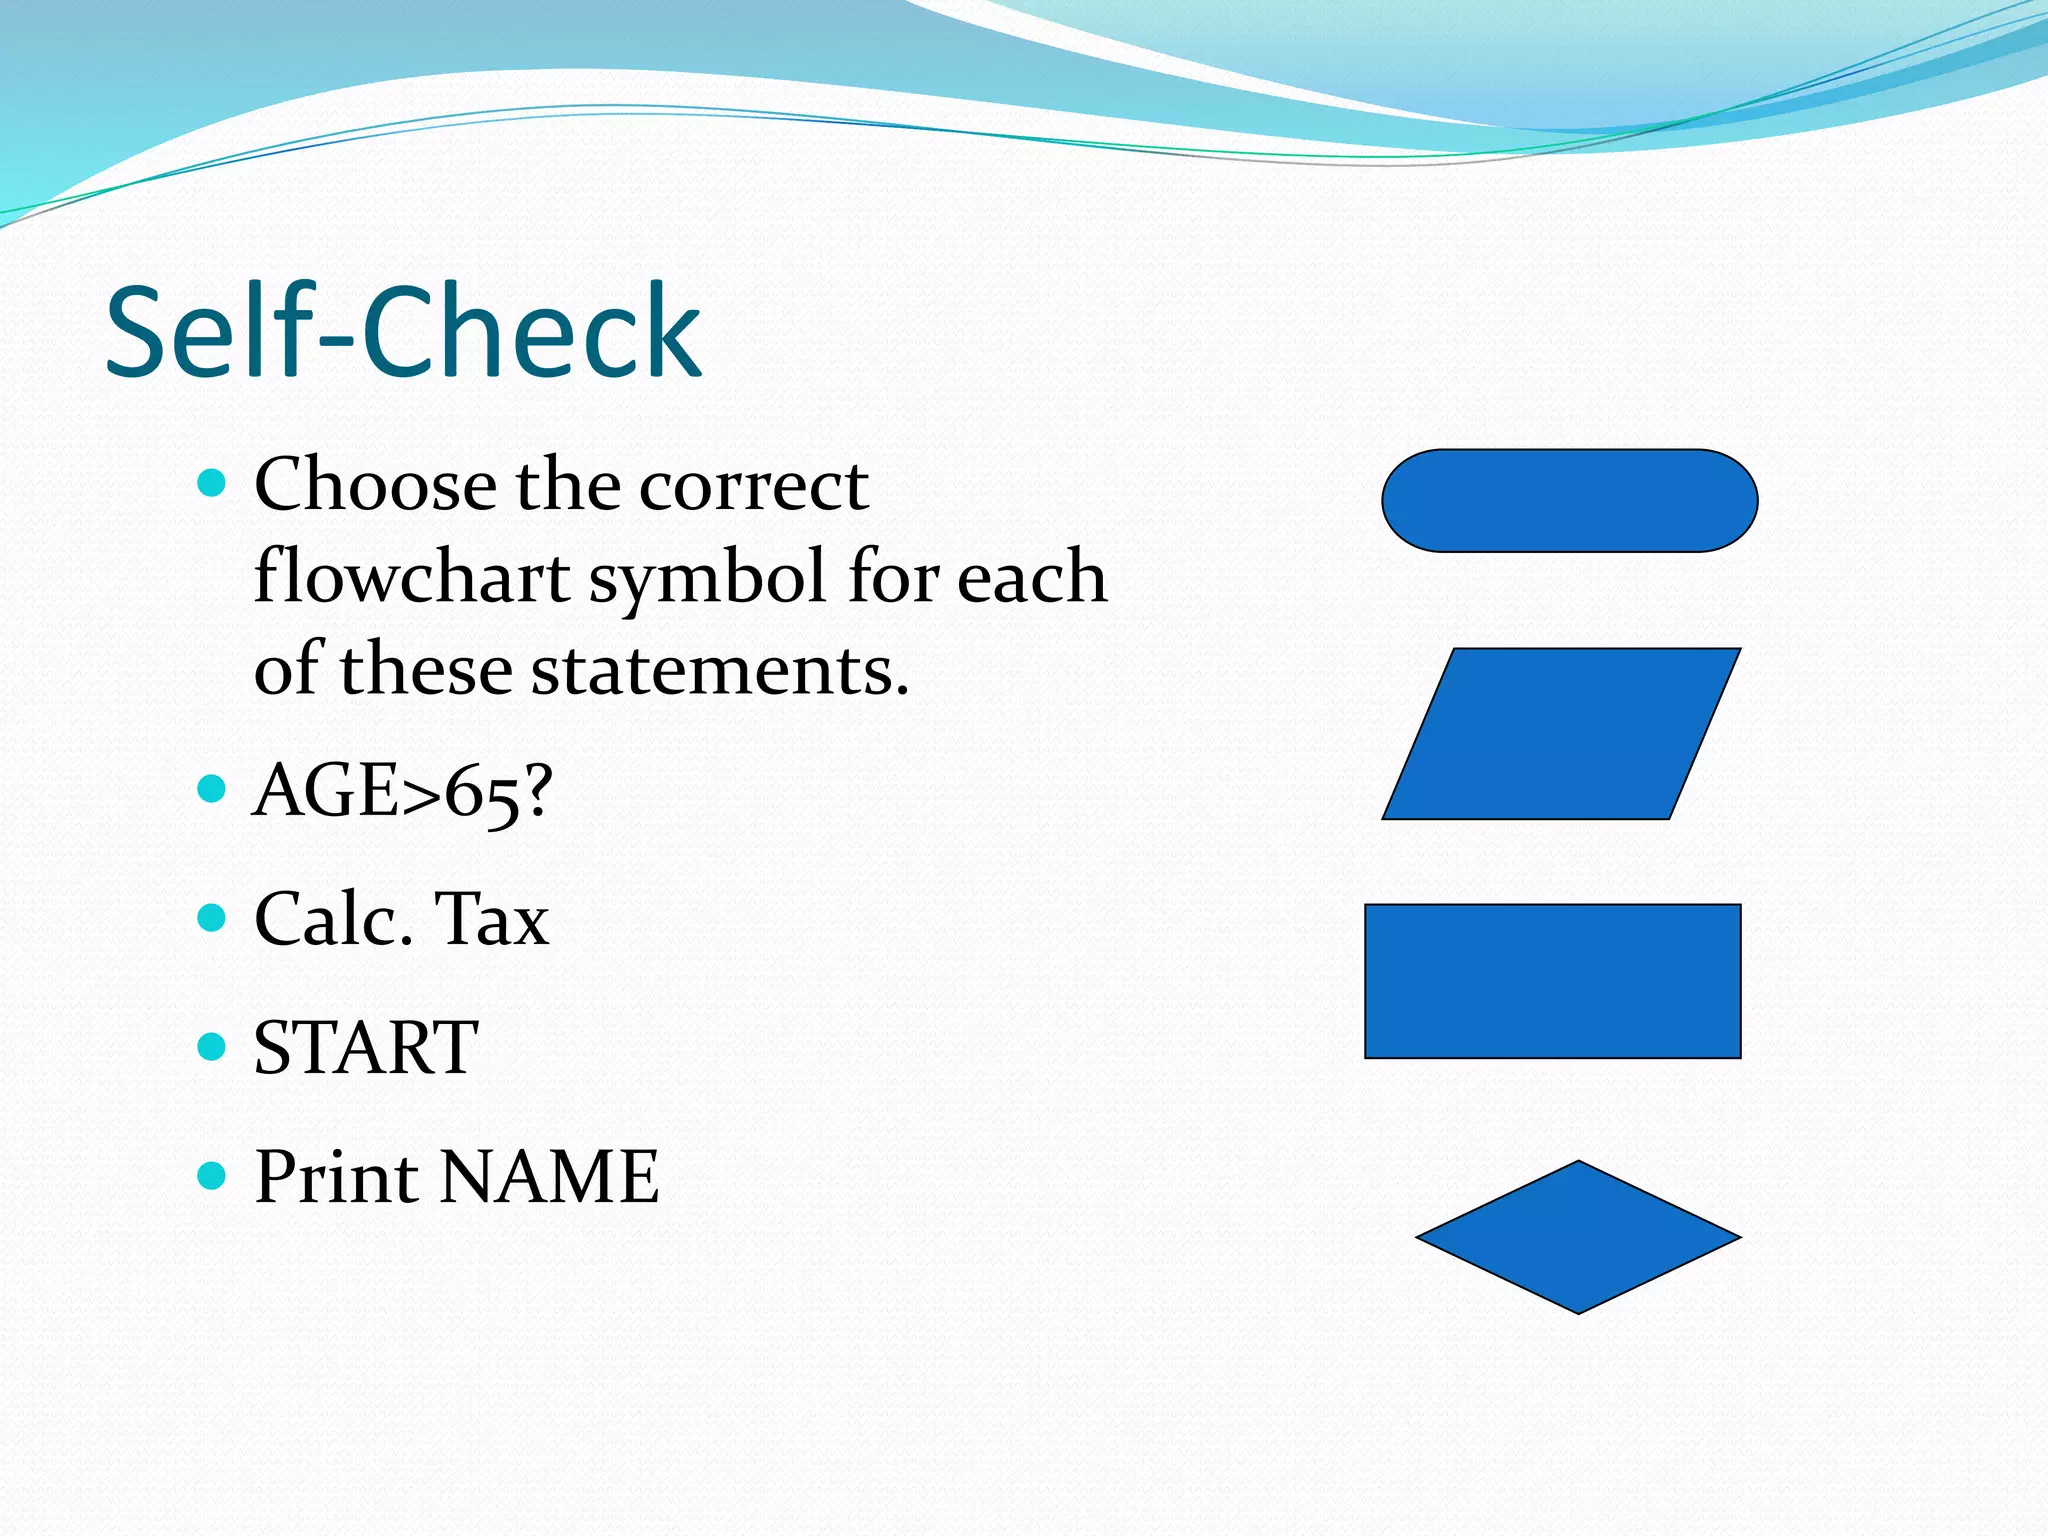
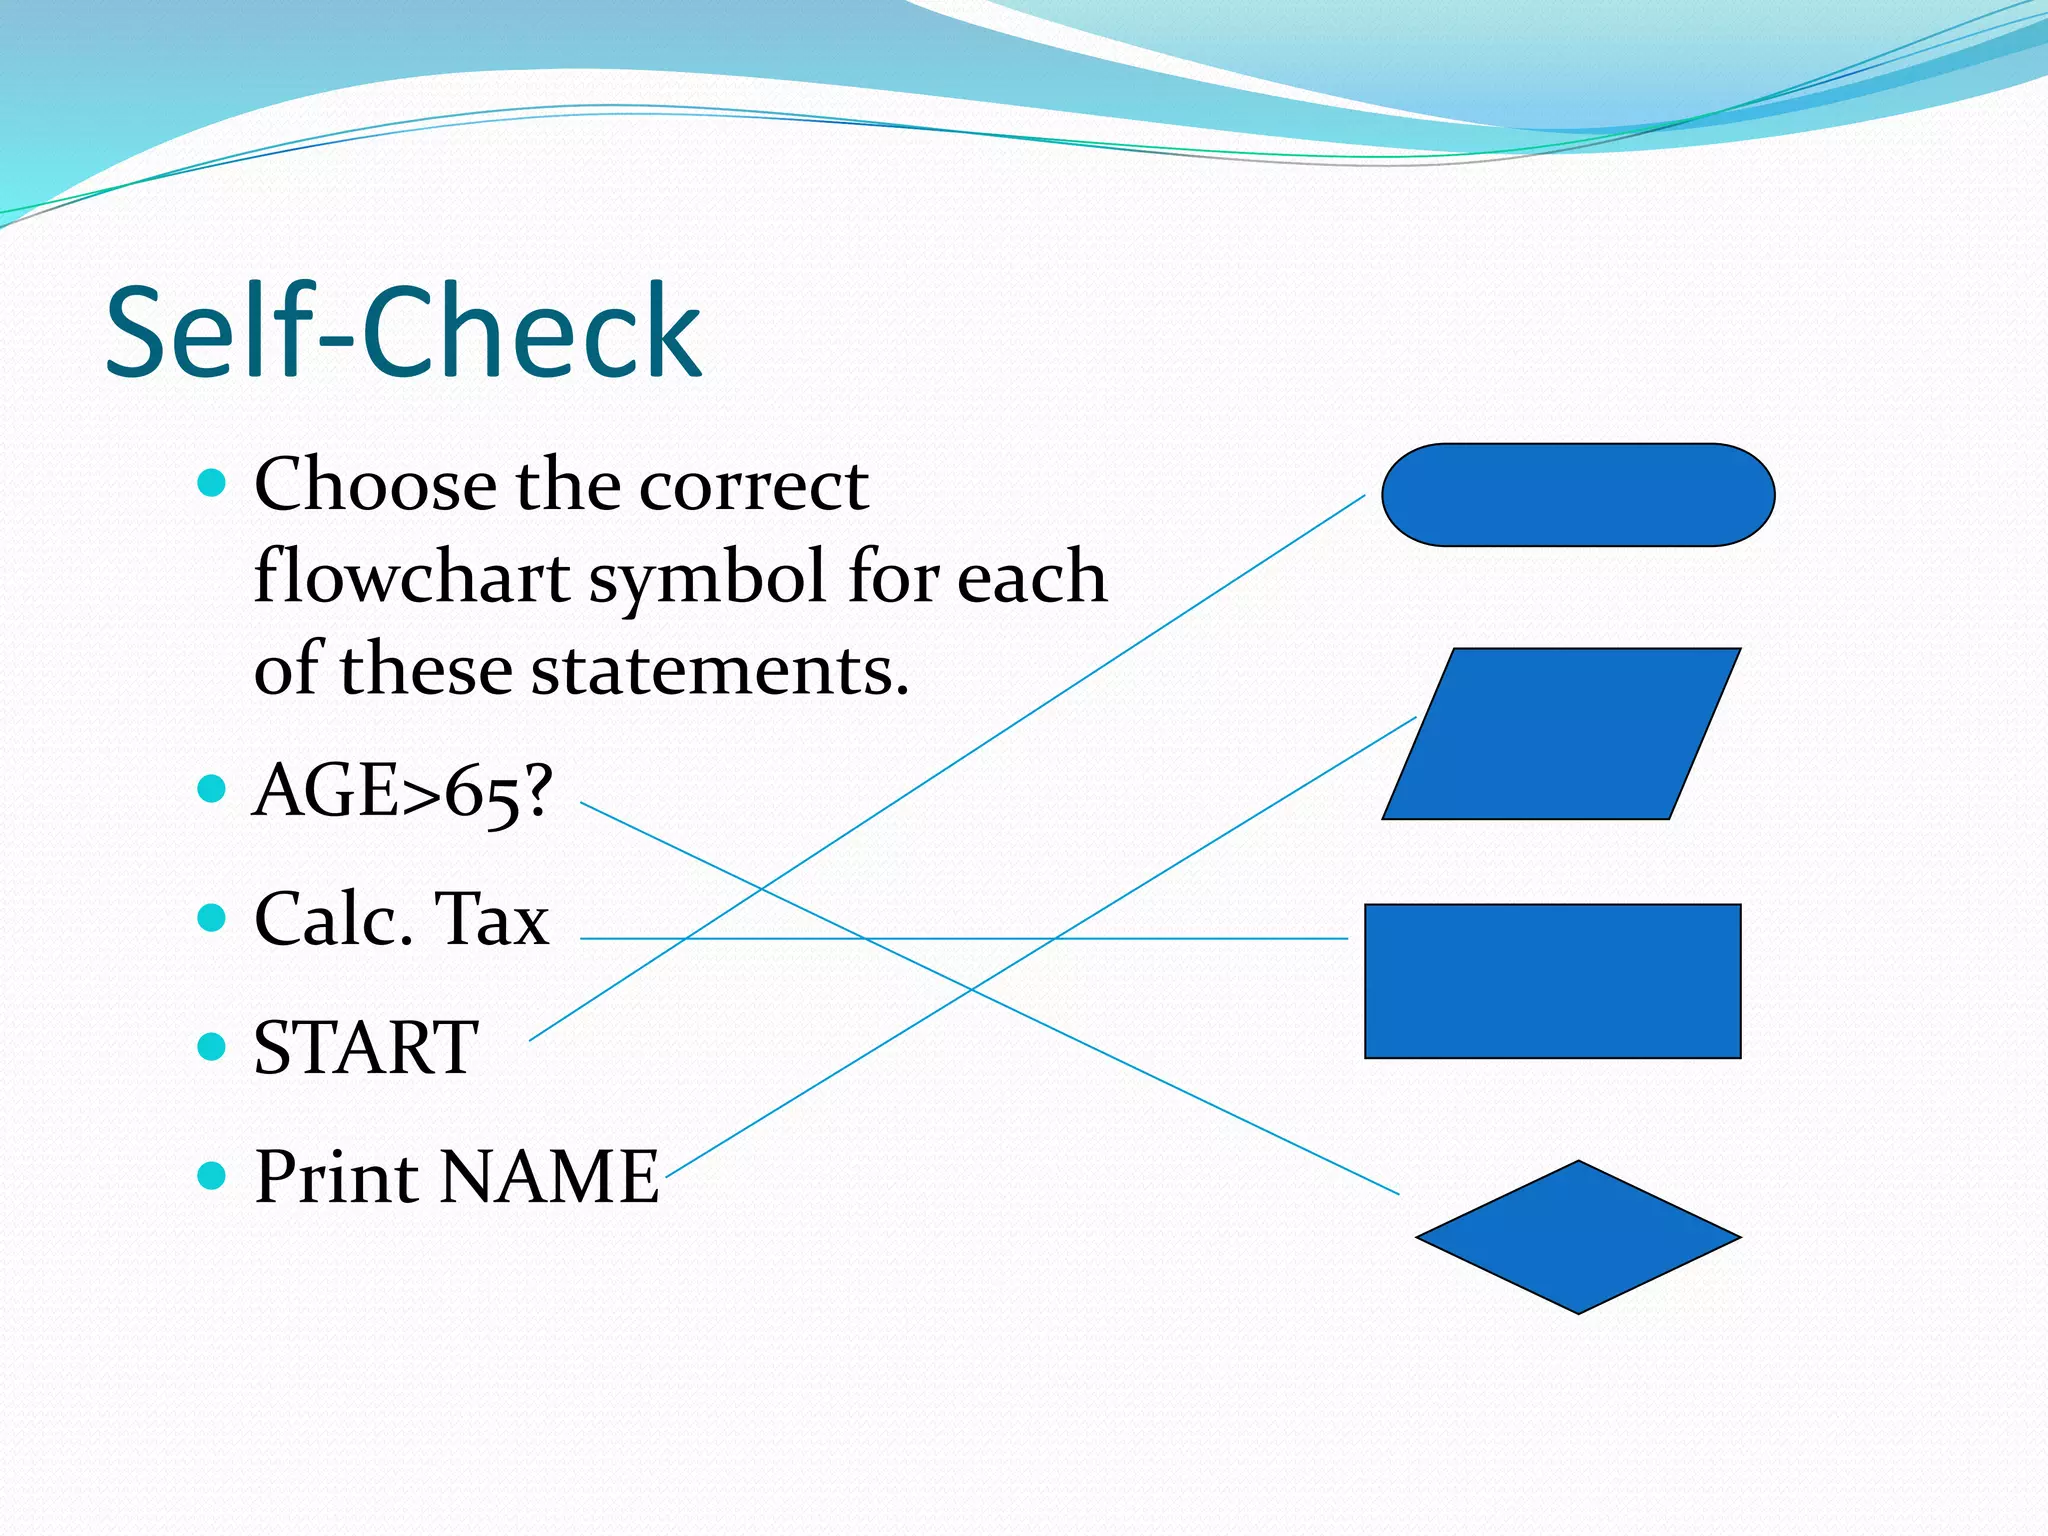
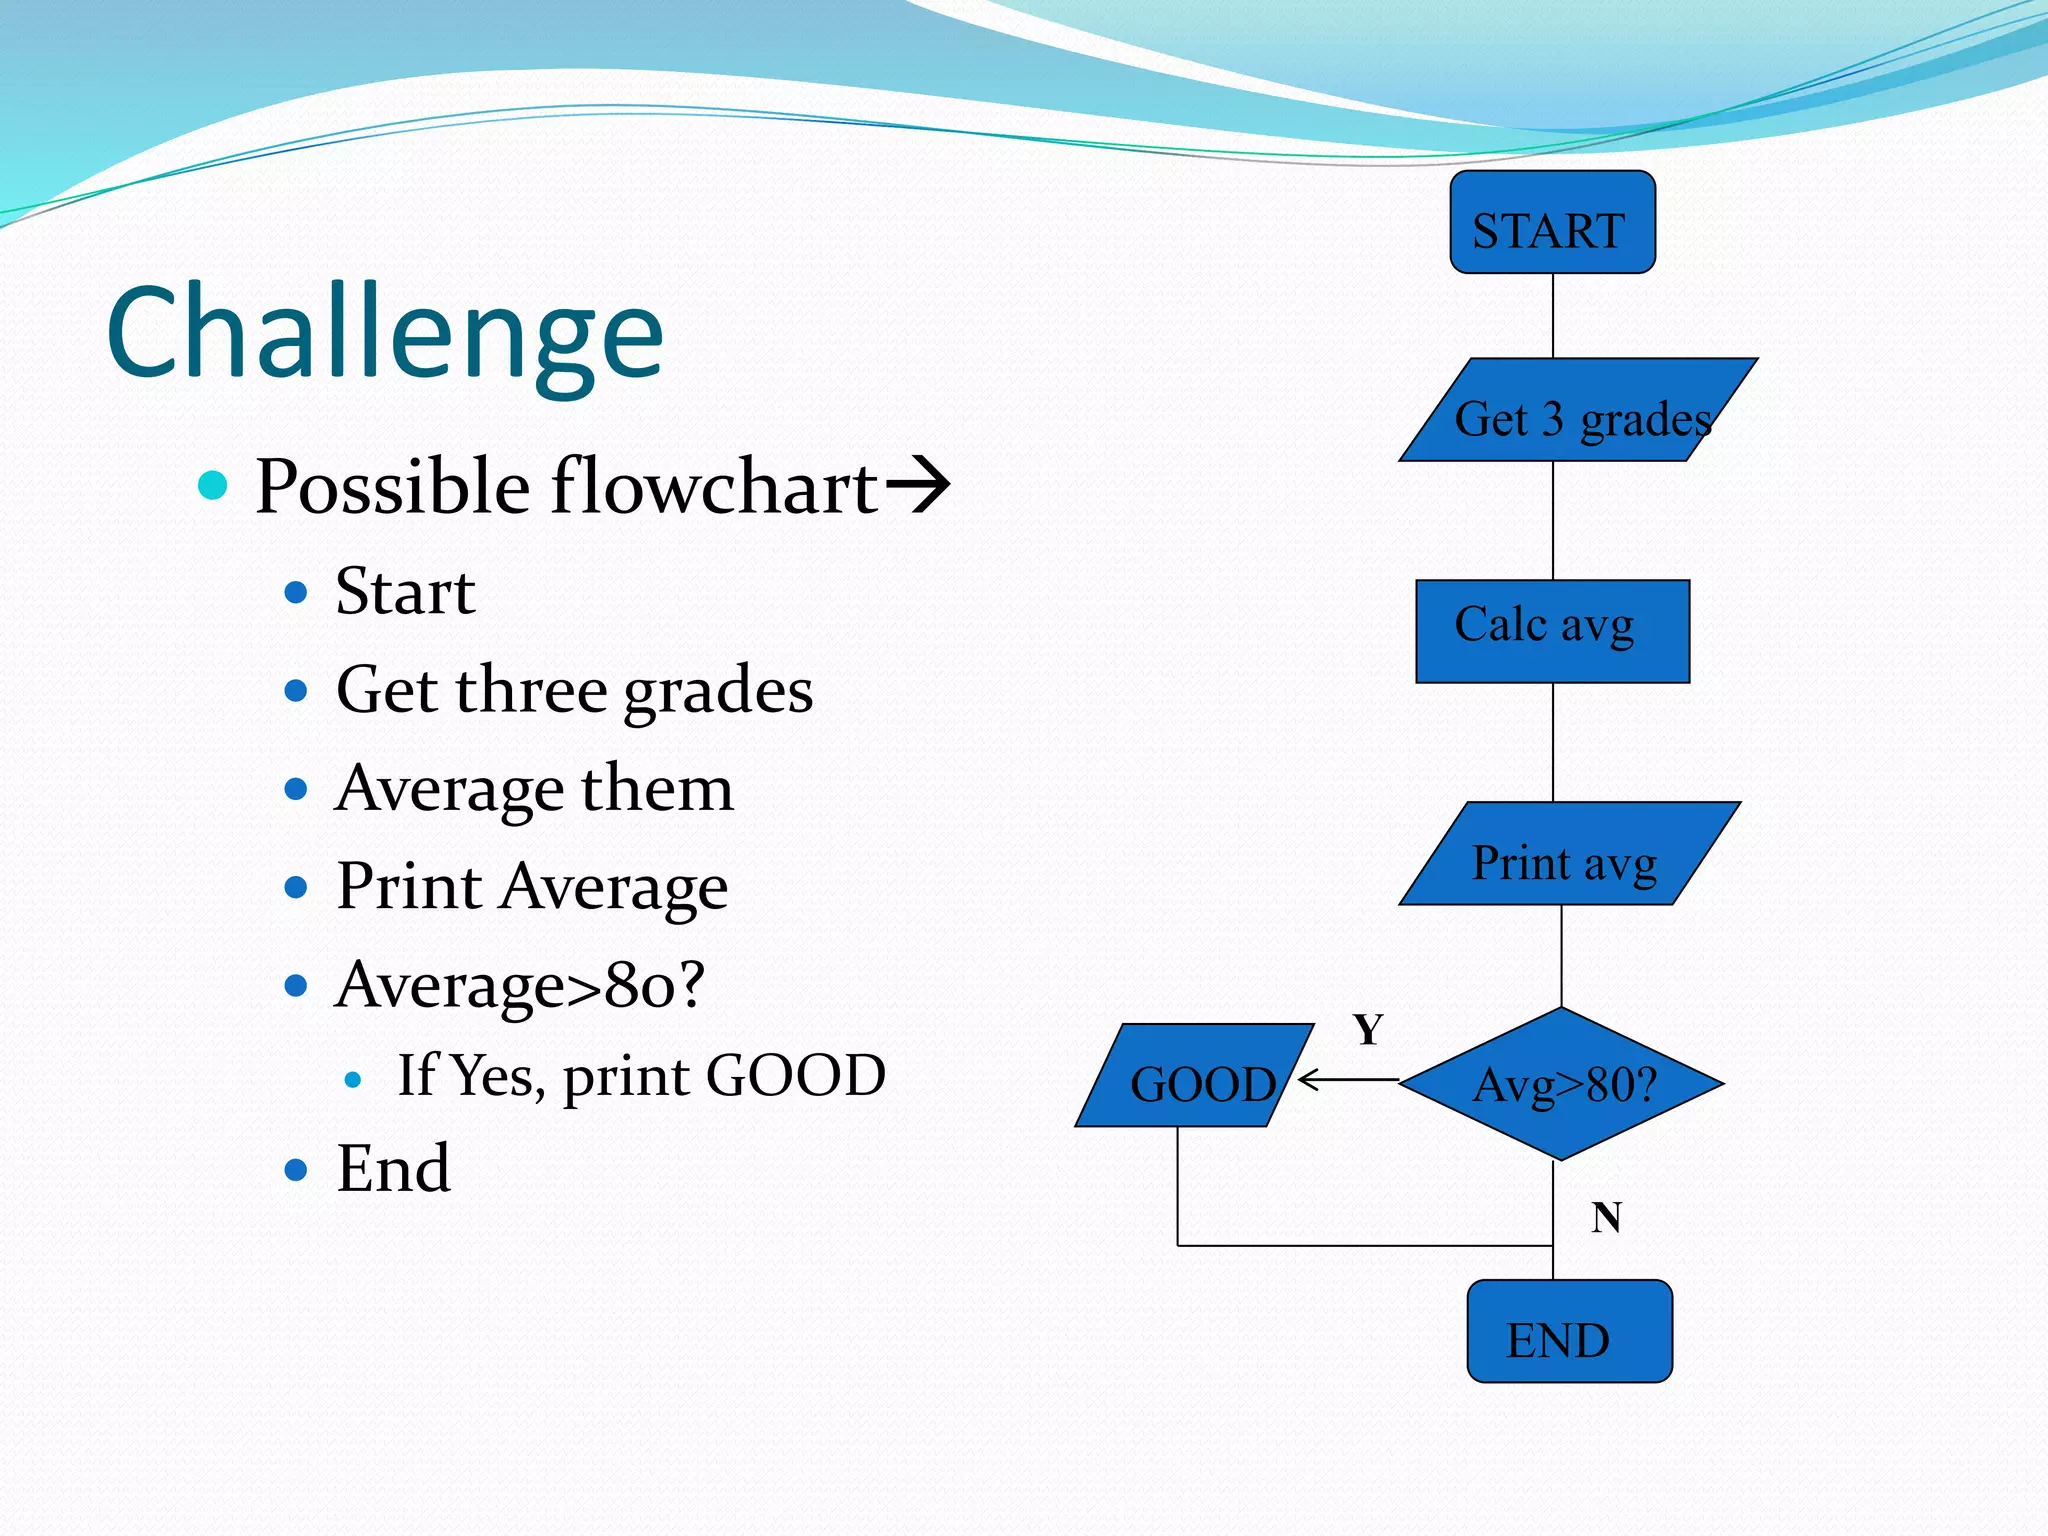

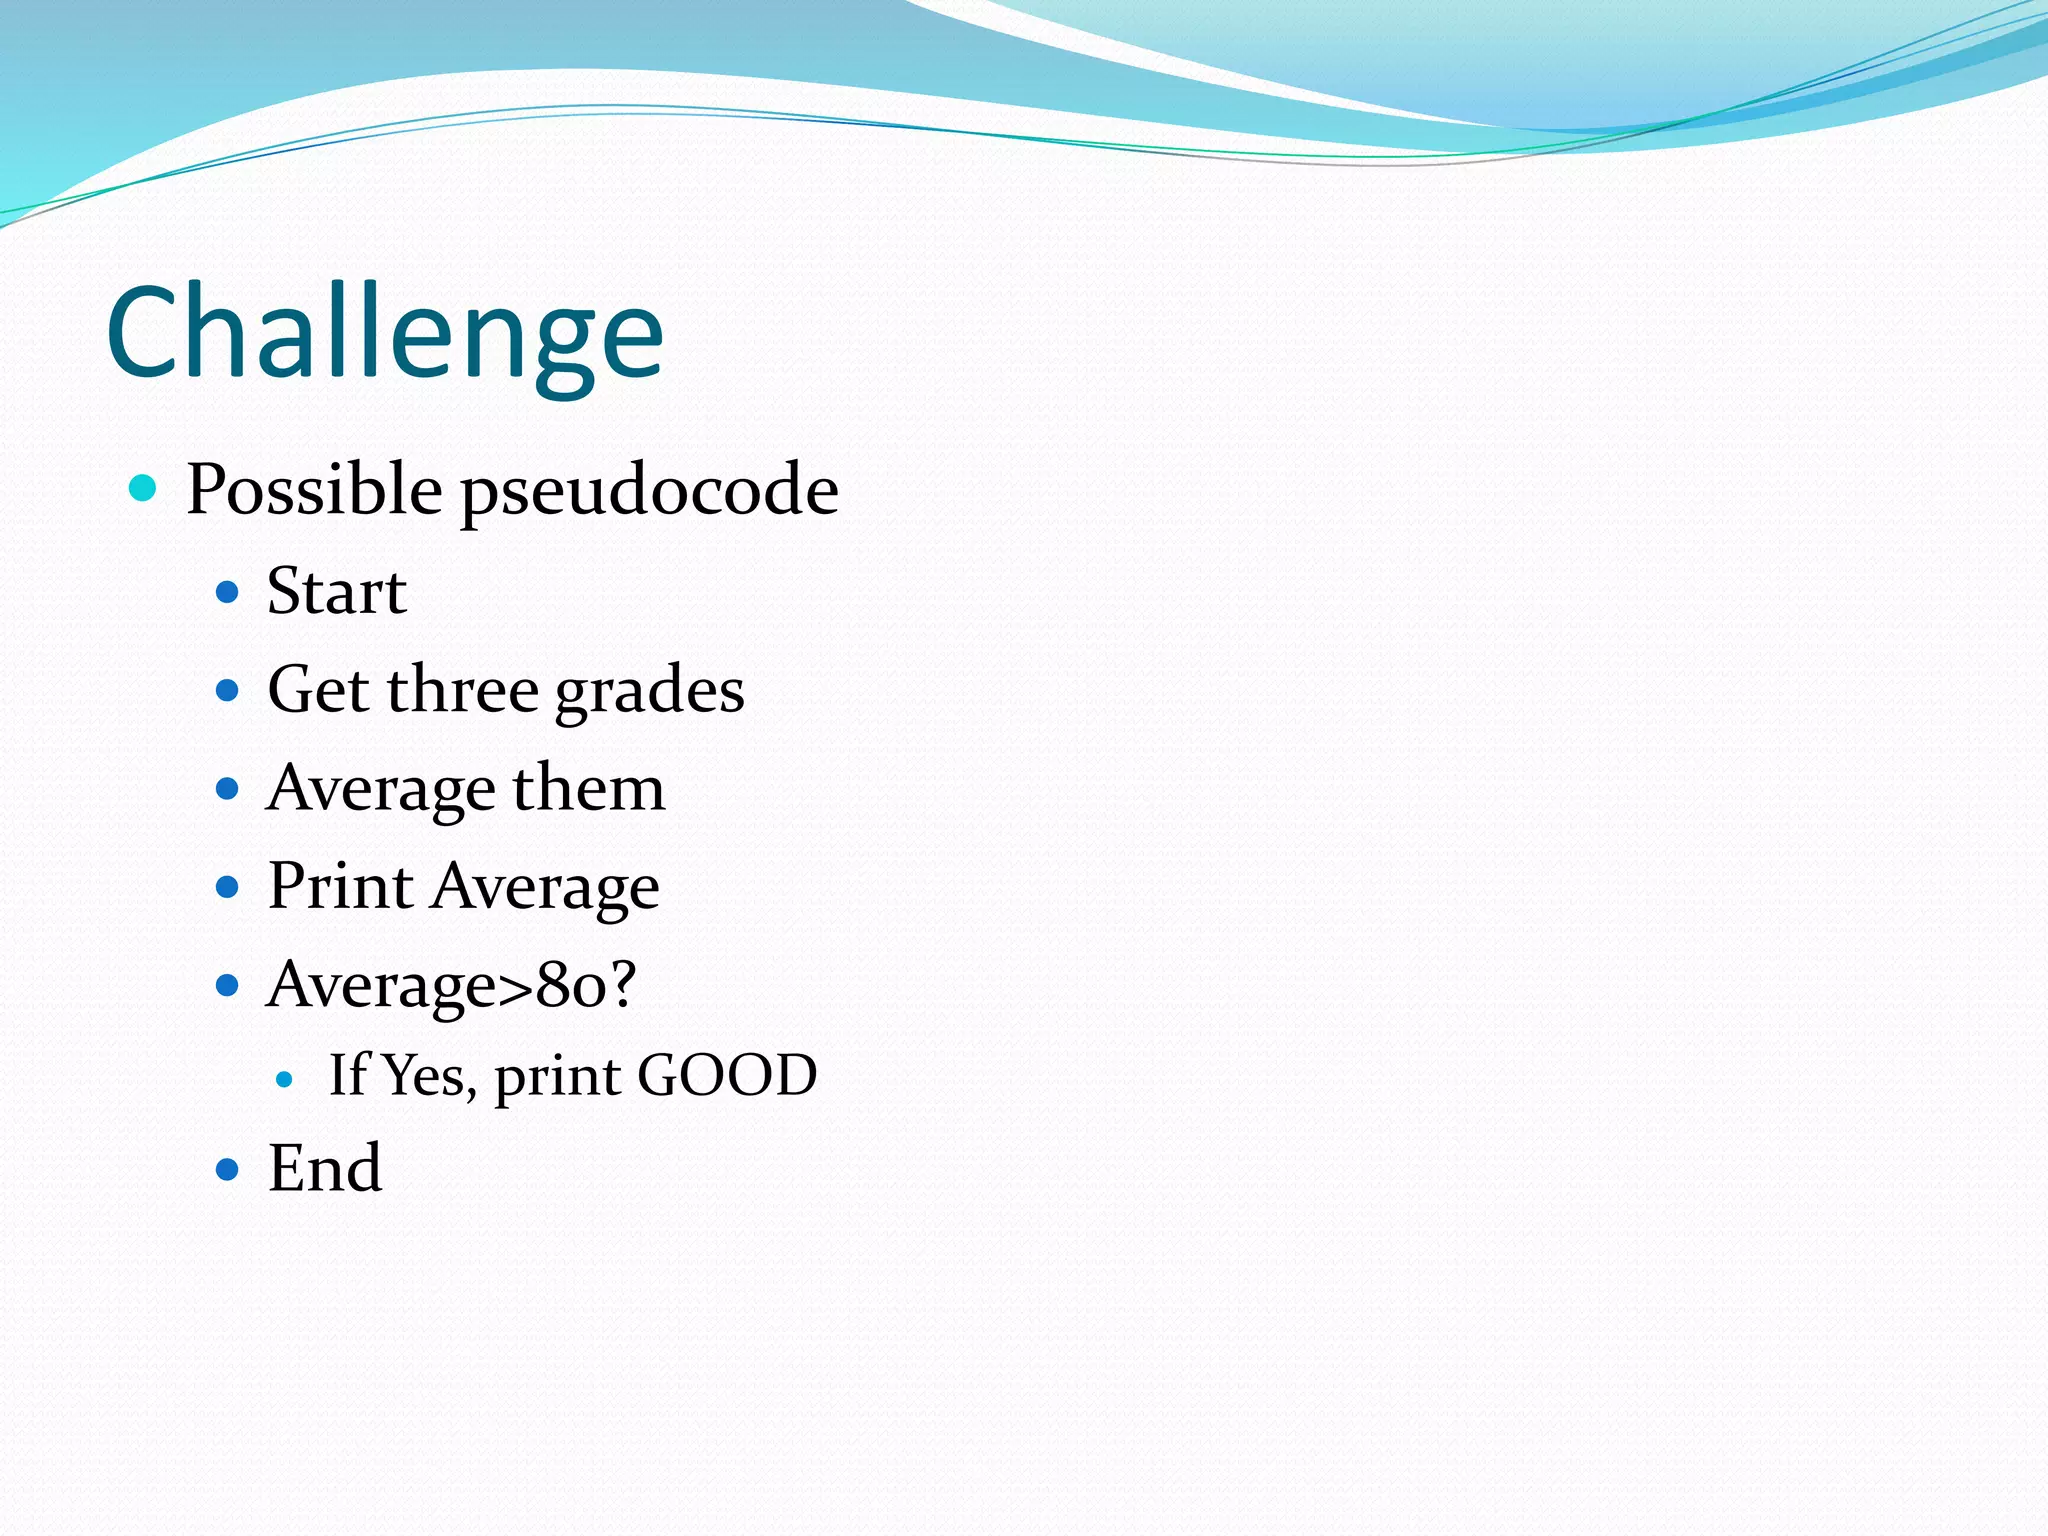

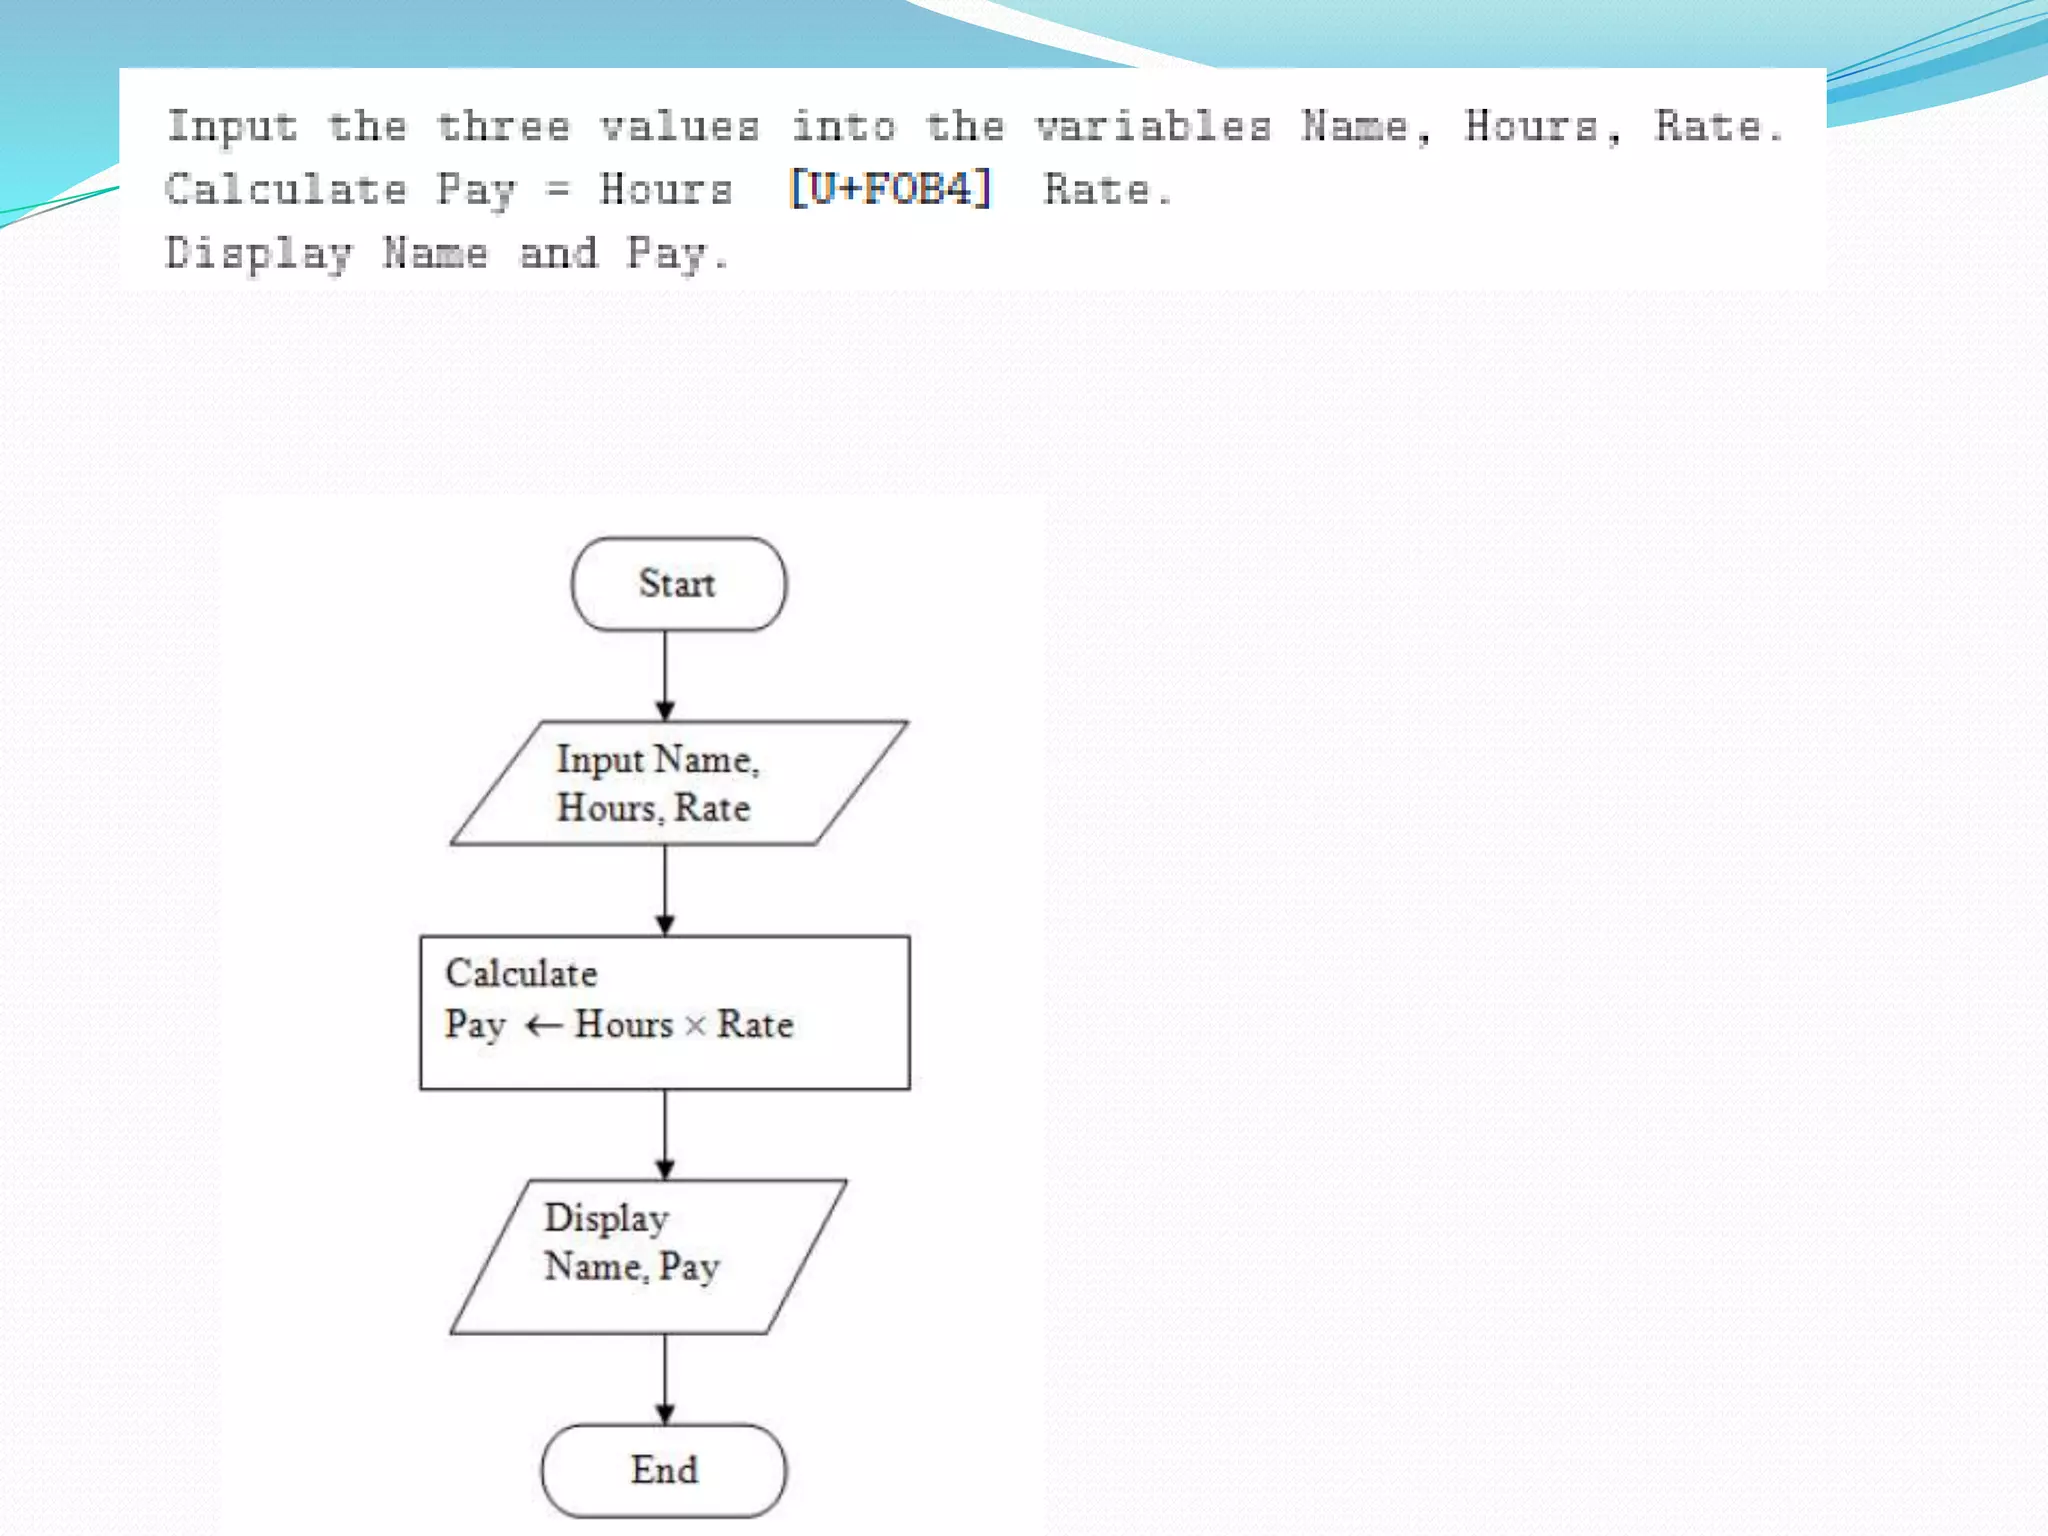
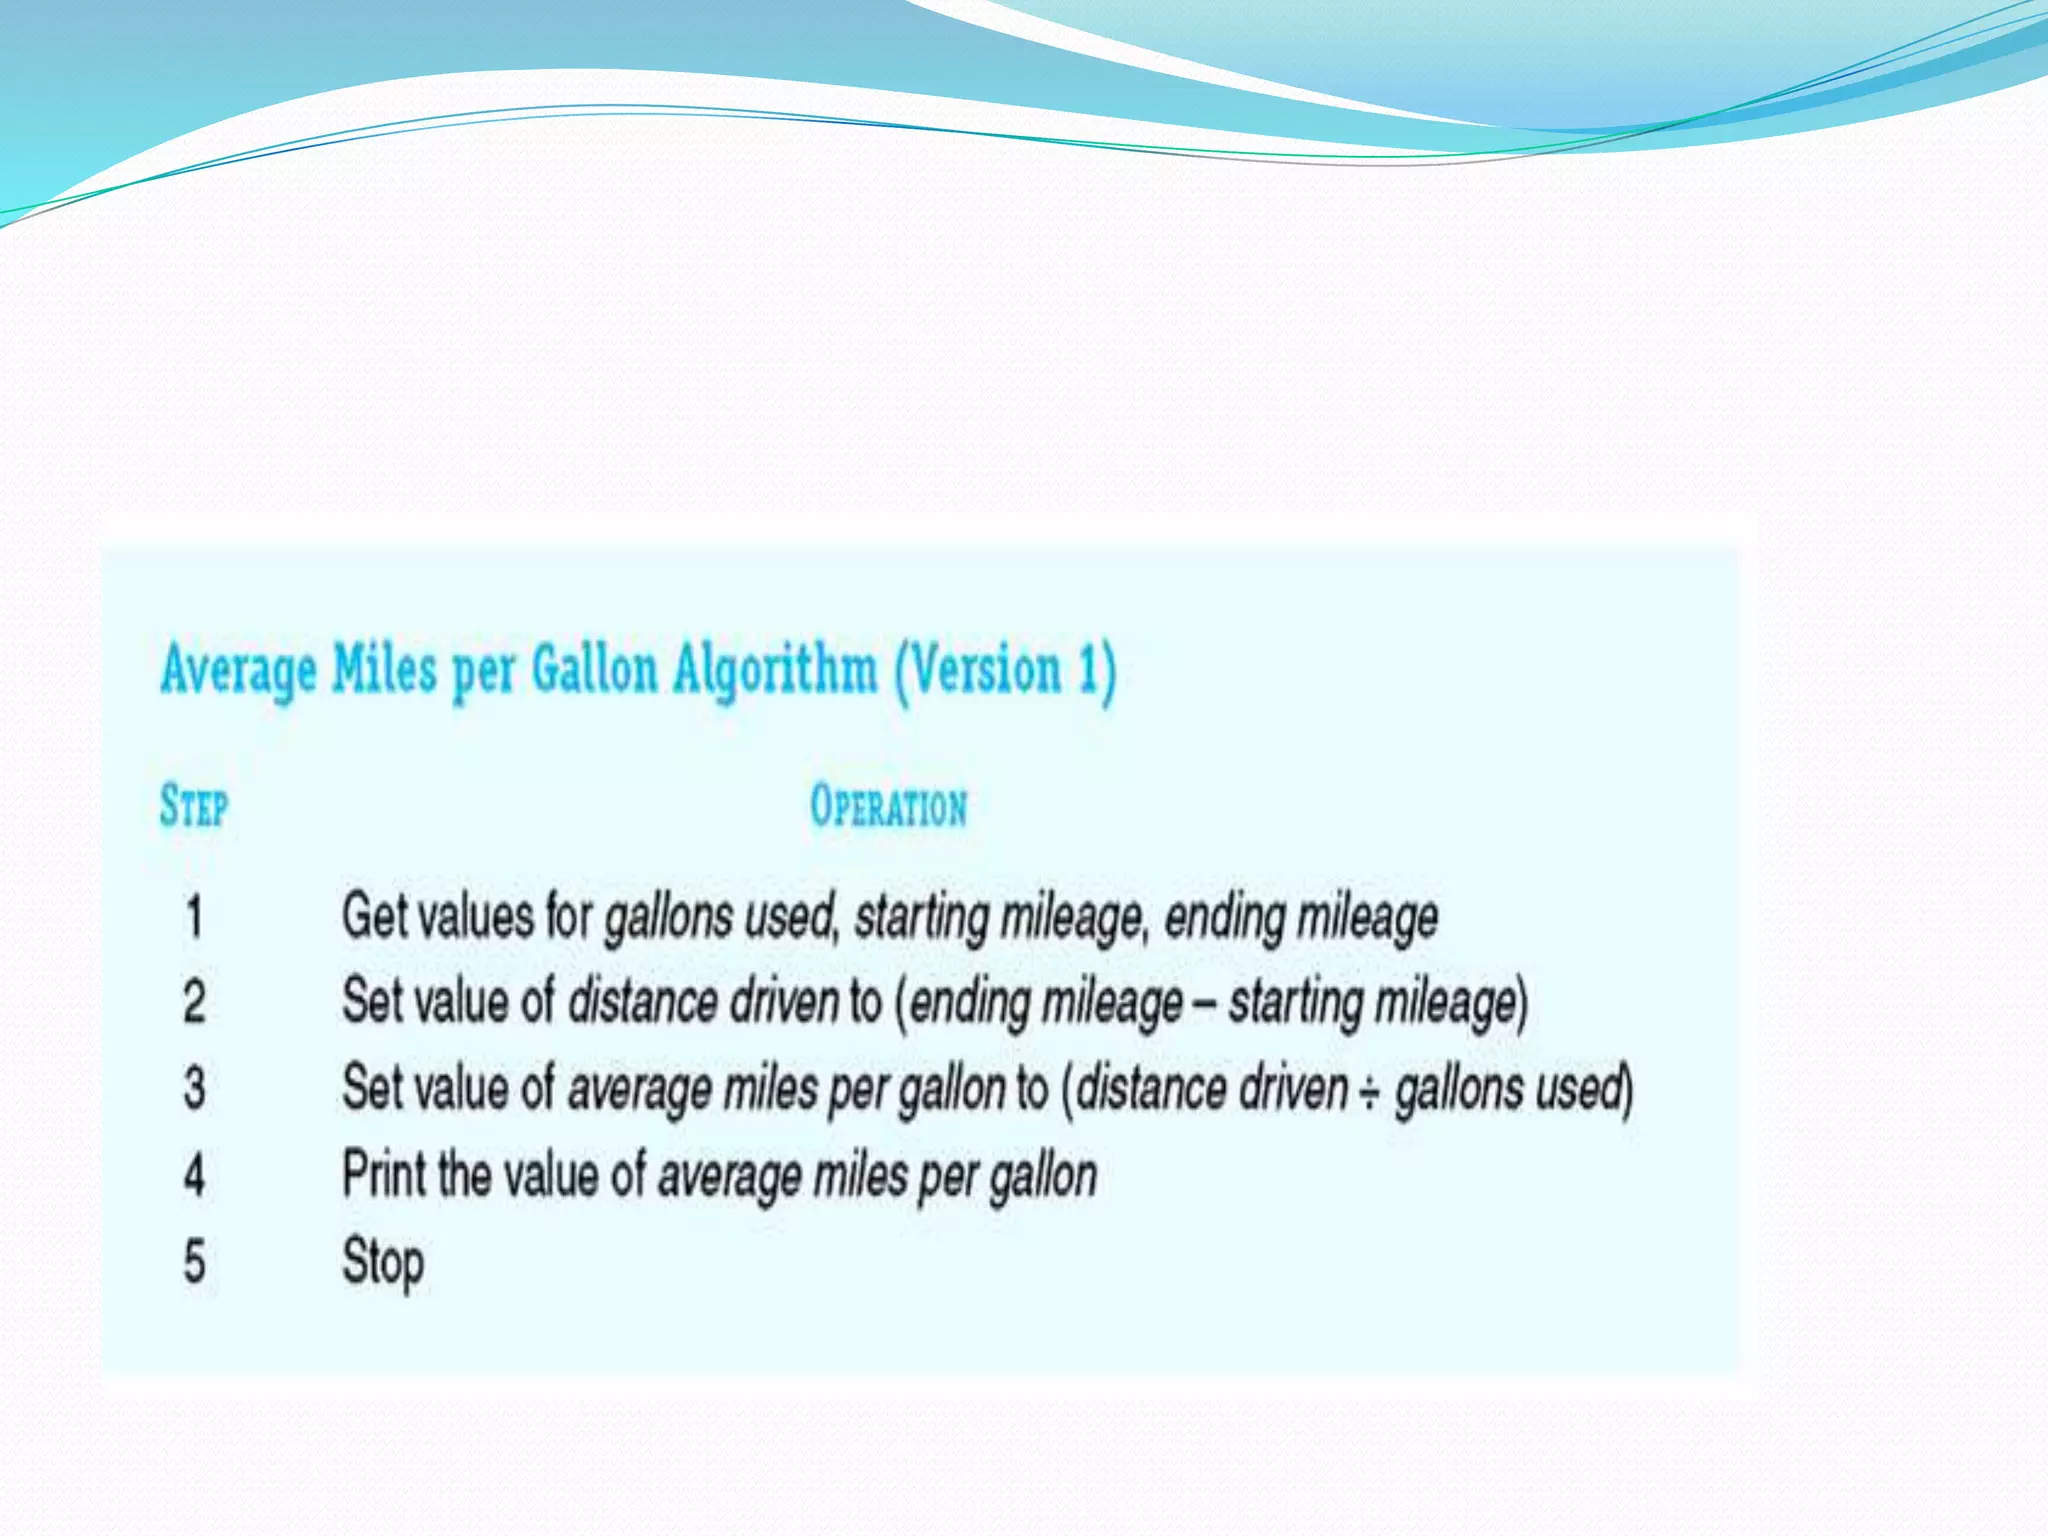
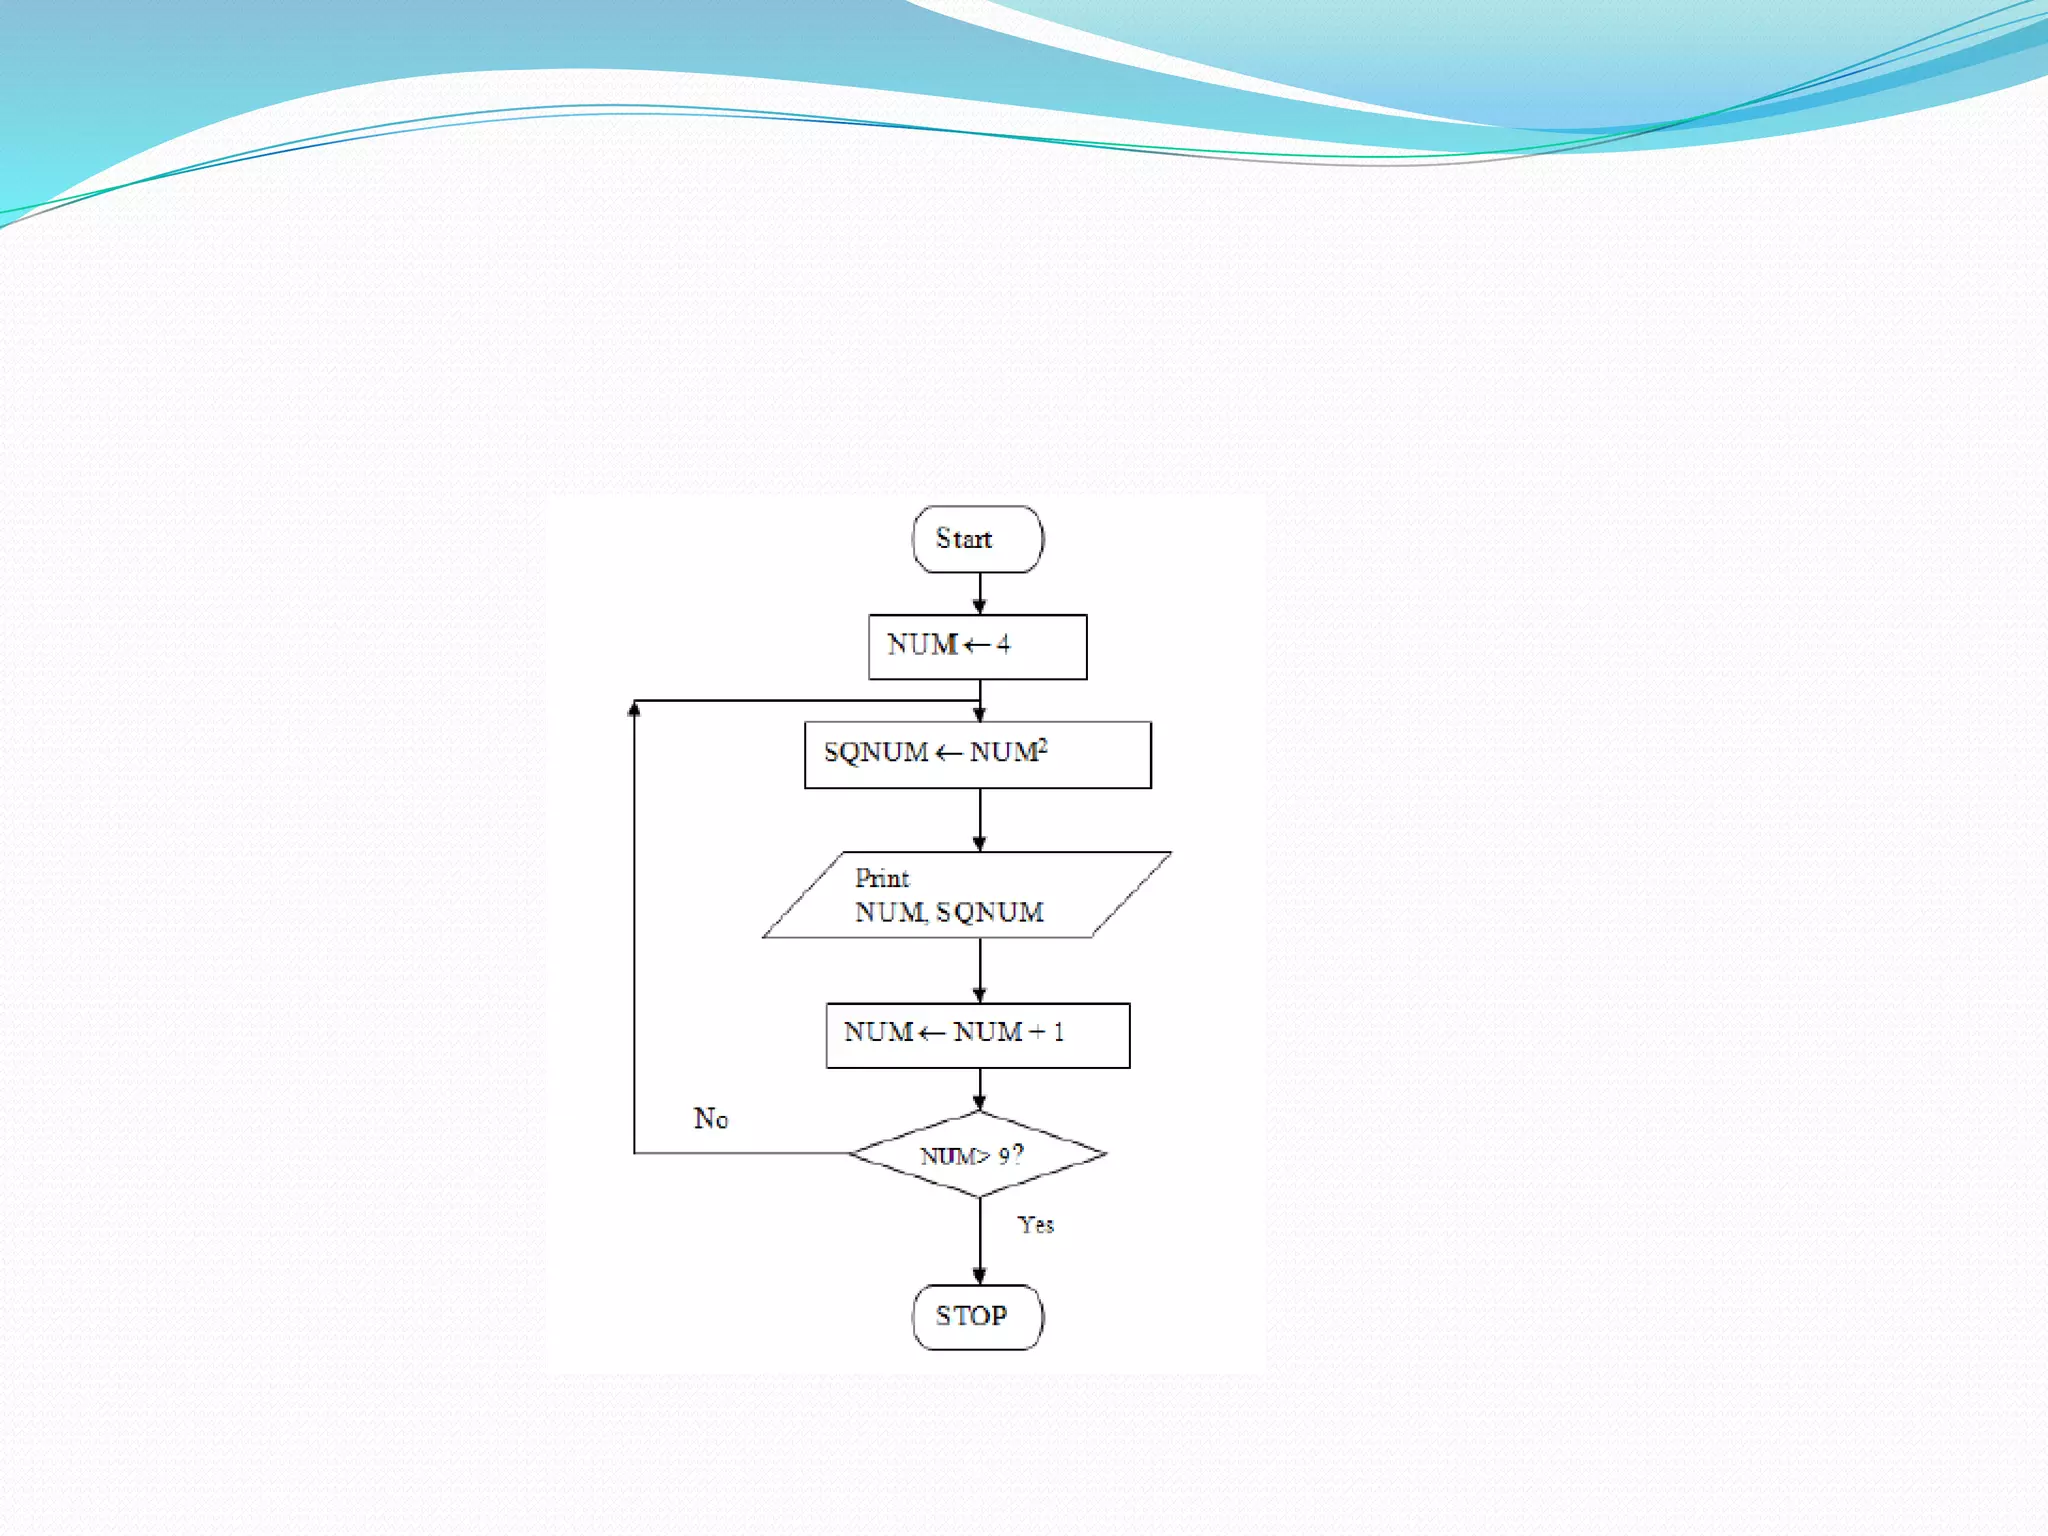


Pseudocode is a way to describe the steps of an algorithm using plain English instead of a programming language. It allows describing logical steps in a structured format without specifics of syntax. The document provides examples of pseudocode and flowcharts for simple tasks like adding numbers and calculating age. It also explains common symbols used in flowcharts like START/END, INPUT/OUTPUT, PROCESS, and DECISION.


![Lecture_01-Problem_Solving[1]||ProgrammingFundamental.ppt](https://cdn.slidesharecdn.com/ss_thumbnails/lecture01-problemsolving1-240327053222-8448be2c-thumbnail.jpg?width=640&height=640&fit=bounds)