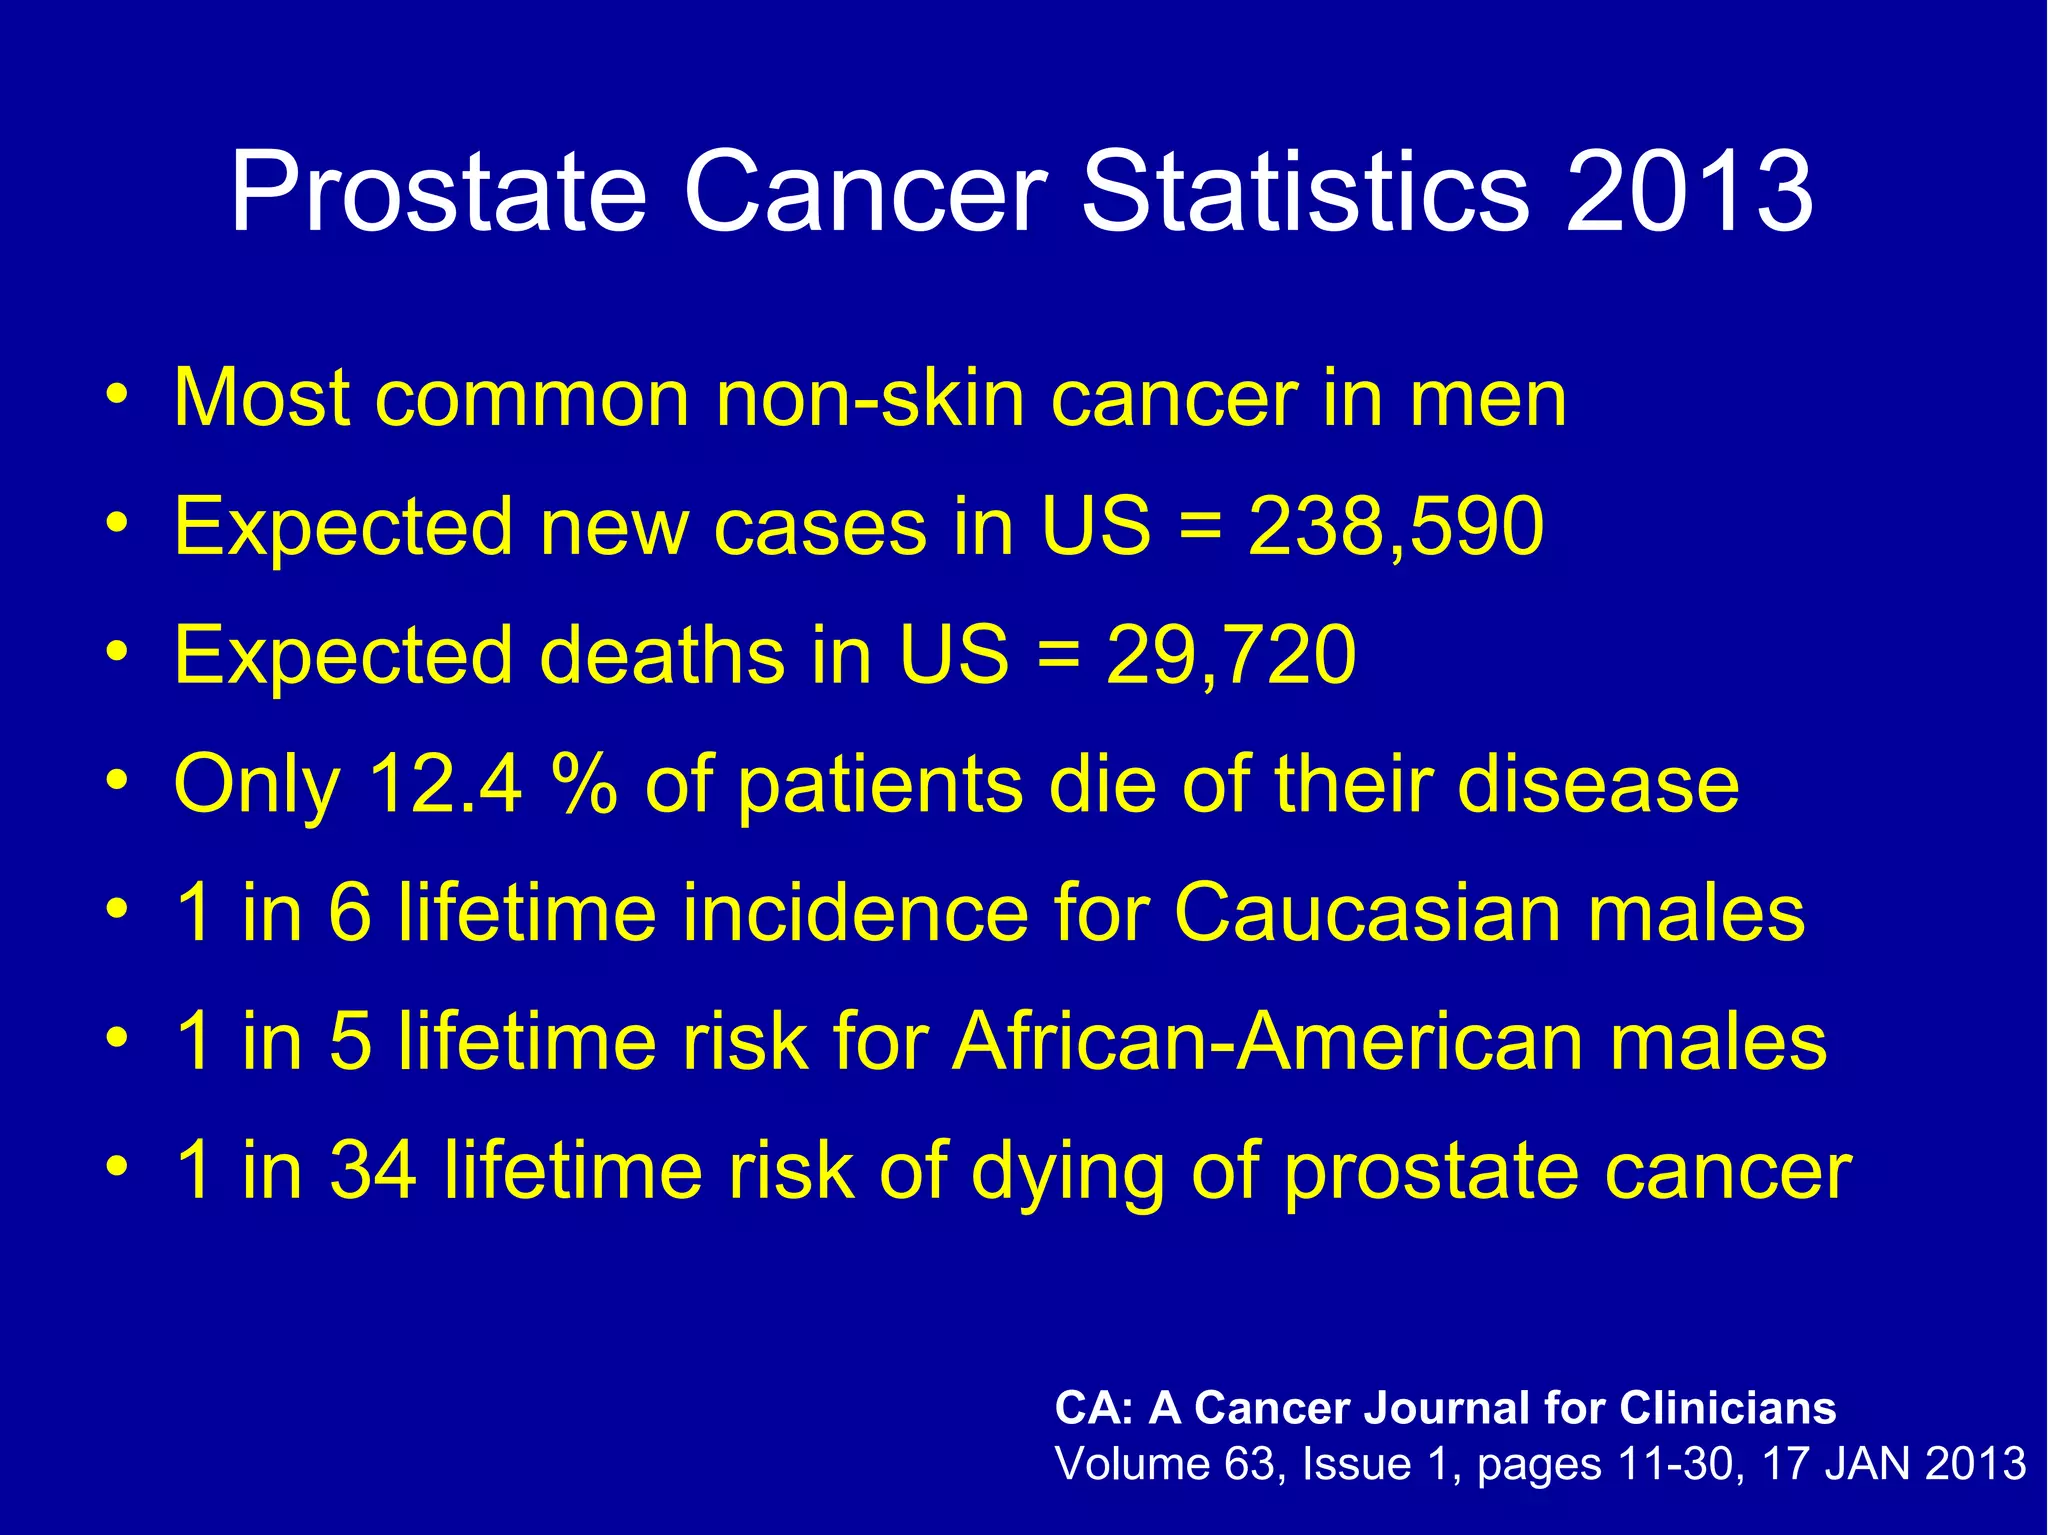
Prostate Cancer Screening

     Brad Ekstrand, MD/PhD
      California Cancer Care
 Mills-Peninsula Health Services
          San Mateo, CA
Prostate Cancer Statistics 2013
• Most common non-skin cancer in men
• Expected new cases in US = 238,590
• Expected deaths in US = 29,720
• Only 12.4 % of patients die of their disease
• 1 in 6 lifetime incidence for Caucasian males
• 1 in 5 lifetime risk for African-American males
• 1 in 34 lifetime risk of dying of prostate cancer

                           CA: A Cancer Journal for Clinicians
                           Volume 63, Issue 1, pages 11-30, 17 JAN 2013
Incidence Rates for Selected Cancers
     United States, 1975 - 2009.


                         CA: A Cancer Journal for Clinicians
                         Volume 63, Issue 1, pages 11-30, 17 JAN 2013
April 1, 1996
Historical Observations Supporting
            PSA Screening
• Decline in prostate cancer mortality since 1990s
Trends in Death Rate for Various Cancers
              1930 - 2010
Historical Observations Supporting
            PSA Screening
• Decline in prostate cancer mortality since 1990s
• Countries with higher screening rates have
  greater declines in PC mortality
• Stage migration
Stage Migration From PSA Screening


         Organ     Regionally
Year                            Metastatic
        Confined   Advanced
1985   37%         19%          42%

2009   91%         4%           4%


                                      SEER database
Historical Observations Supporting
            PSA Screening
• Decline in prostate cancer mortality since 1990s
• Countries with higher screening rates have
  greater declines in PC mortality
• Stage migration
• Numerous observational studies on regional,
  national, and international level
Problems with Observational
              Studies
• Other potential causes of declining mortality
  – Better local therapy for early stage disease
  – Better systemic therapy
• Stage migration = lead-time bias?
• Length-time bias
• Randomized controlled trials required to prove
  effectiveness
Major Randomized Trials of
      Prostate Cancer Screening
• Laval University study (Quebec)
  – 46,000 men; 1988 - 1996
  – Now largely ignored due to poor statistical analysis
Major Randomized Trials of
       Prostate Cancer Screening
• Laval University study (Quebec)
  – 46,000 men; 1988 - 1996
  – Now largely ignored due to poor statistical analysis
• European Randomized Study of Screening for Prostate
  Cancer (ERSPC)
  – 9 countries; each had slightly different protocol
  – Schroder et al (2009) NEJM 360:1320-8
• Prostate, Lung, Colon, Ovarian Cancer Screening Trial
  (PLCO)
  – USA; 10 mostly urban centers
  – Andriole et al (2009) NEJM 360:1310-9
ERSPC vs PLCO Trials
                     Design

                 ERSPC             PLCO
                     182,160
# enrolled                         76,693
                  (core 162,243)
                      50-74
Age range                          55-74
                   (core 55-69)
PSA Frequency    Average q 4 yrs   q 1 yr x 6 yrs
                     2.5 – 4.0
PSA cutoff                         4.0
                    (most 3.0)
DRE Offered?     Variable          Mandated (x4 yr)
ERSPC vs PLCO Trials
                 Results
                    ERSPC            PLCO
Median f/u           9 yr              7 yr
Contamination                   44% had prior PSA
                  20% (8-29%)
Rate                             52% during trial
Compliance with
                     82%              85%
Screening
Biopsy if
                    80-90%       32% within 1 yr
indicated
ERSPC vs PLCO
             Prostate Cancer Incidence
                 ERSPC                PLCO

                 Screen    Control    Screen    Control

Cancers          5590      4307       2820      2322

Cum. Incidence 8.2%        4.8%       7.4%      6.1%

Rate/1000 p-y    9.3       5.5        11.6      9.5
Rate Ratio
                 1.71 (1.32 – 2.33)   1.22 (1.16 – 1.29)
(95% CI)
ERSPC vs PLCO
             Prostate Cancer Mortality
                  ERSPC              PLCO

                  Screen Control     Screen    Control

Patients          82,816 99,184      38,343    38,350

PC Deaths         261      363       50        44

Rate/1000 p-y     0.35     0.41      0.20      0.17
Rate Ratio
                  0.80 (0.65 – 0.98) 1.13 (0.75 – 1.7)
(95%CI)
ERSCP vs PLCO
Prostate Cancer Deaths

ERSCP               PLCO
Criticism of the PLCO Study
• Low-risk group of patients: 44% had PSA
  before study entry
• Low number of prostate cancer deaths
• Shorter follow up
• Underpowered
  – Few Events
  – 52% contamination of controls
  – Poor compliance with biopsy

                                    Stephenson AJ; ASCO 2010
Criticism of ERSPC Study

• Wide confidence intervals; p = 0.04
• Variable benefit seen in different age groups
• Differences in treatment of cancers between
  arms
• Relatively small # of PC deaths
Overdiagnosis


• To prevent 1 PC death in 10 yr:
  – 1410 men screened
  – 48 men diagnosed and treated for PC
  – Breast Cancer: 1339 screen and 10 treat
Harm from Screening
•   Hospitalization from biopsy complication 1%
•   Biopsy pain 55%
•   Psychological burden: stigma, PSA anxiety
•   Risks of Therapy:
    –   Incontinence
    –   Erectile dysfunction
    –   Bowel effects
    –   Metabolic Syndrome
    –   Osteoporosis
• $$$ of case finding and treatment substantial
Unresolved Questions
• Should PSA screening be done at all?
• Who should be screened?
• When to start?
• When to stop?
• How often?
• When to do a biopsy?
  –   Single PSA cutoff is arbitrary
  –   Confirmatory PSA test?
  –   Multivariable calculators
  –   New biomakers (e.g. PCA3)
Guidelines
                        AUA                 ACS                  USPSTF
Shared Decision-                                  Yes                  Yes
                              Yes
Making?                                     (use decision aid)   (if requested)
Age to begin offering

     Average Risk pt           40                  50                N.A.

     High Risk pts             40                 40-45              N.A.
                                                PSA;
Screening Tests            PSA + DRE                                 N.A.
                                             (DRE optional)
Frequency                    Annual              Annual               N.A

                          Age, Fam Hx,
                         Race, DRE, total   PSA >4.0 or abn
Criteria for Biopsy                                                  N.A.
                        PSA, PSA velocity        DRE
                             + more

                              Adapted from Hoffman RM (2011) NEJM 365:2013-2019
Conclusions
• PSA is not a robust screening test
• Marginally effective in reducing PC mortality
• Risk of overdiagnosis is extremely high
• ACS Guidelines represent a balanced view
• Informed and shared decision-making is
  mandatory, but takes time
• All cancer screening needs to be individualized

Prostate Cancer Screening

  • 1.
    Prostate Cancer Screening Brad Ekstrand, MD/PhD California Cancer Care Mills-Peninsula Health Services San Mateo, CA
  • 2.
    Prostate Cancer Statistics2013 • Most common non-skin cancer in men • Expected new cases in US = 238,590 • Expected deaths in US = 29,720 • Only 12.4 % of patients die of their disease • 1 in 6 lifetime incidence for Caucasian males • 1 in 5 lifetime risk for African-American males • 1 in 34 lifetime risk of dying of prostate cancer CA: A Cancer Journal for Clinicians Volume 63, Issue 1, pages 11-30, 17 JAN 2013
  • 3.
    Incidence Rates forSelected Cancers United States, 1975 - 2009. CA: A Cancer Journal for Clinicians Volume 63, Issue 1, pages 11-30, 17 JAN 2013
  • 4.
  • 5.
    Historical Observations Supporting PSA Screening • Decline in prostate cancer mortality since 1990s
  • 6.
    Trends in DeathRate for Various Cancers 1930 - 2010
  • 7.
    Historical Observations Supporting PSA Screening • Decline in prostate cancer mortality since 1990s • Countries with higher screening rates have greater declines in PC mortality • Stage migration
  • 8.
    Stage Migration FromPSA Screening Organ Regionally Year Metastatic Confined Advanced 1985 37% 19% 42% 2009 91% 4% 4% SEER database
  • 9.
    Historical Observations Supporting PSA Screening • Decline in prostate cancer mortality since 1990s • Countries with higher screening rates have greater declines in PC mortality • Stage migration • Numerous observational studies on regional, national, and international level
  • 10.
    Problems with Observational Studies • Other potential causes of declining mortality – Better local therapy for early stage disease – Better systemic therapy • Stage migration = lead-time bias? • Length-time bias • Randomized controlled trials required to prove effectiveness
  • 11.
    Major Randomized Trialsof Prostate Cancer Screening • Laval University study (Quebec) – 46,000 men; 1988 - 1996 – Now largely ignored due to poor statistical analysis
  • 12.
    Major Randomized Trialsof Prostate Cancer Screening • Laval University study (Quebec) – 46,000 men; 1988 - 1996 – Now largely ignored due to poor statistical analysis • European Randomized Study of Screening for Prostate Cancer (ERSPC) – 9 countries; each had slightly different protocol – Schroder et al (2009) NEJM 360:1320-8 • Prostate, Lung, Colon, Ovarian Cancer Screening Trial (PLCO) – USA; 10 mostly urban centers – Andriole et al (2009) NEJM 360:1310-9
  • 13.
    ERSPC vs PLCOTrials Design ERSPC PLCO 182,160 # enrolled 76,693 (core 162,243) 50-74 Age range 55-74 (core 55-69) PSA Frequency Average q 4 yrs q 1 yr x 6 yrs 2.5 – 4.0 PSA cutoff 4.0 (most 3.0) DRE Offered? Variable Mandated (x4 yr)
  • 14.
    ERSPC vs PLCOTrials Results ERSPC PLCO Median f/u 9 yr 7 yr Contamination 44% had prior PSA 20% (8-29%) Rate 52% during trial Compliance with 82% 85% Screening Biopsy if 80-90% 32% within 1 yr indicated
  • 15.
    ERSPC vs PLCO Prostate Cancer Incidence ERSPC PLCO Screen Control Screen Control Cancers 5590 4307 2820 2322 Cum. Incidence 8.2% 4.8% 7.4% 6.1% Rate/1000 p-y 9.3 5.5 11.6 9.5 Rate Ratio 1.71 (1.32 – 2.33) 1.22 (1.16 – 1.29) (95% CI)
  • 16.
    ERSPC vs PLCO Prostate Cancer Incidence ERSPC PLCO Screen Control Screen Control Cancers 5590 4307 2820 2322 Cum. Incidence 8.2% 4.8% 7.4% 6.1% Rate/1000 p-y 9.3 5.5 11.6 9.5 Rate Ratio 1.71 (1.32 – 2.33) 1.22 (1.16 – 1.29) (95% CI)
  • 17.
    ERSPC vs PLCO Prostate Cancer Mortality ERSPC PLCO Screen Control Screen Control Patients 82,816 99,184 38,343 38,350 PC Deaths 261 363 50 44 Rate/1000 p-y 0.35 0.41 0.20 0.17 Rate Ratio 0.80 (0.65 – 0.98) 1.13 (0.75 – 1.7) (95%CI)
  • 18.
    ERSCP vs PLCO ProstateCancer Deaths ERSCP PLCO
  • 19.
    Criticism of thePLCO Study • Low-risk group of patients: 44% had PSA before study entry • Low number of prostate cancer deaths • Shorter follow up • Underpowered – Few Events – 52% contamination of controls – Poor compliance with biopsy Stephenson AJ; ASCO 2010
  • 20.
    Criticism of ERSPCStudy • Wide confidence intervals; p = 0.04 • Variable benefit seen in different age groups • Differences in treatment of cancers between arms • Relatively small # of PC deaths
  • 21.
    Overdiagnosis • To prevent1 PC death in 10 yr: – 1410 men screened – 48 men diagnosed and treated for PC – Breast Cancer: 1339 screen and 10 treat
  • 22.
    Harm from Screening • Hospitalization from biopsy complication 1% • Biopsy pain 55% • Psychological burden: stigma, PSA anxiety • Risks of Therapy: – Incontinence – Erectile dysfunction – Bowel effects – Metabolic Syndrome – Osteoporosis • $$$ of case finding and treatment substantial
  • 23.
    Unresolved Questions • ShouldPSA screening be done at all? • Who should be screened? • When to start? • When to stop? • How often? • When to do a biopsy? – Single PSA cutoff is arbitrary – Confirmatory PSA test? – Multivariable calculators – New biomakers (e.g. PCA3)
  • 24.
    Guidelines AUA ACS USPSTF Shared Decision- Yes Yes Yes Making? (use decision aid) (if requested) Age to begin offering Average Risk pt 40 50 N.A. High Risk pts 40 40-45 N.A. PSA; Screening Tests PSA + DRE N.A. (DRE optional) Frequency Annual Annual N.A Age, Fam Hx, Race, DRE, total PSA >4.0 or abn Criteria for Biopsy N.A. PSA, PSA velocity DRE + more Adapted from Hoffman RM (2011) NEJM 365:2013-2019
  • 25.
    Conclusions • PSA isnot a robust screening test • Marginally effective in reducing PC mortality • Risk of overdiagnosis is extremely high • ACS Guidelines represent a balanced view • Informed and shared decision-making is mandatory, but takes time • All cancer screening needs to be individualized

Editor's Notes

  • #4 © This slide is made available for non-commercial use only. Please note that permission may be required for re-use of images in which the copyright is owned by a third party. Trends in Incidence Rates for Selected Cancers by Sex, United States, 1975 to 2009. Rates are age adjusted to the 2000 US standard population and adjusted for delays in reporting. *Liver includes intrahepatic bile duct.