Project Time Management
Includes the processes required to manage Timely completion of the project.
Planning
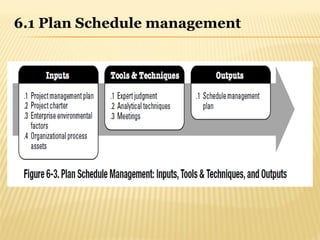
6.1 Plan Schedule management
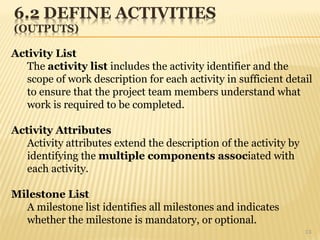
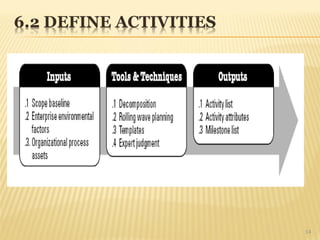
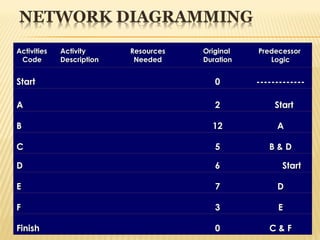
6.2 Define Activities
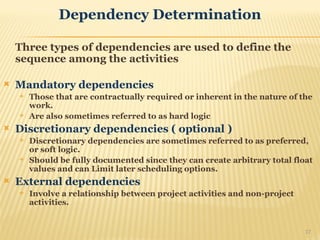
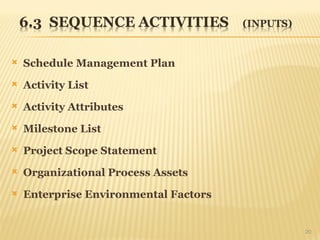
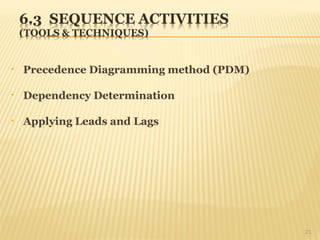
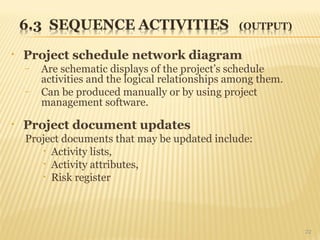
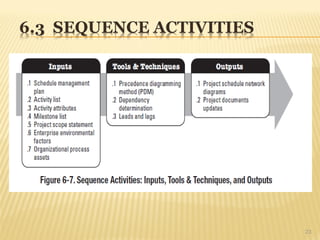
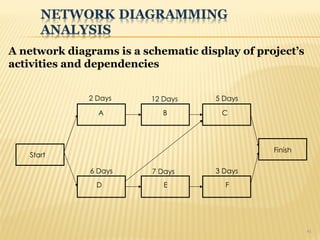
6.3 Sequence Activities
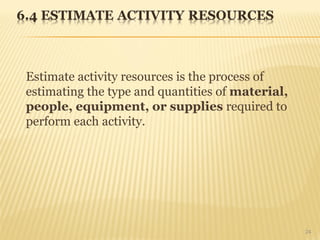
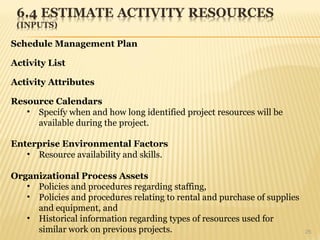
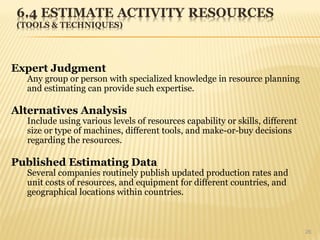
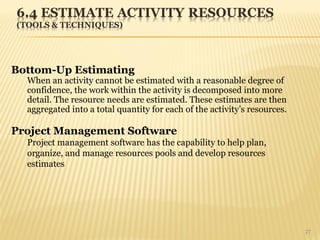
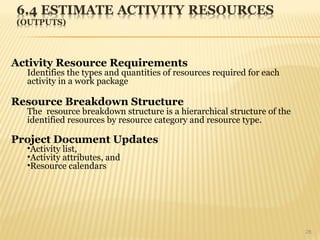
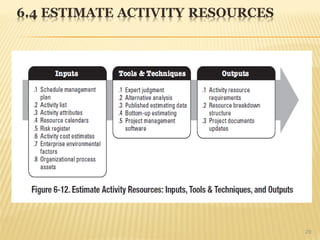
6.4 Estimate Activity Resources
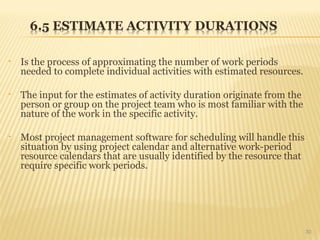
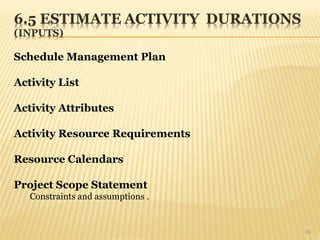
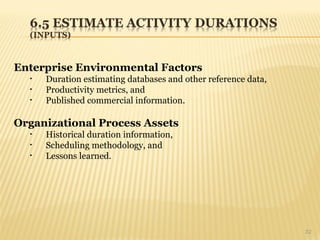
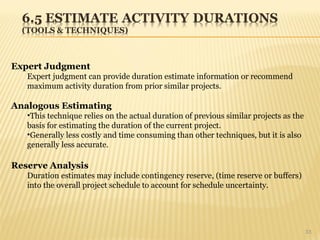
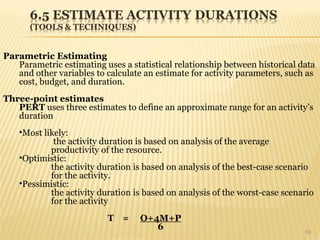
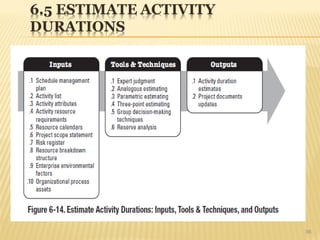
6.5 Estimate Activity Durations
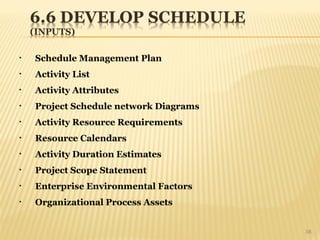
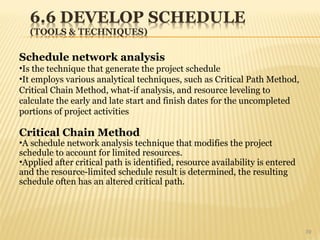
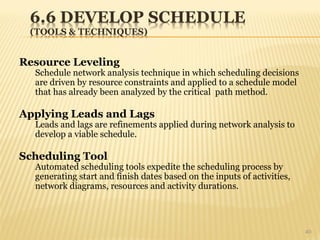
6.6 Develop Schedule
Monitoring and controlling
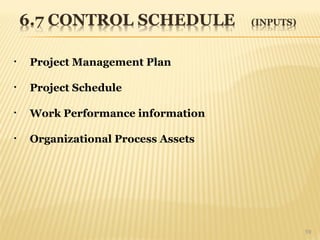
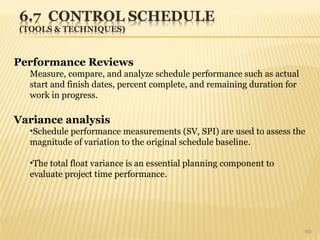
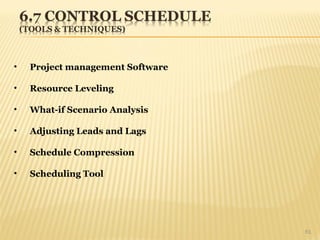
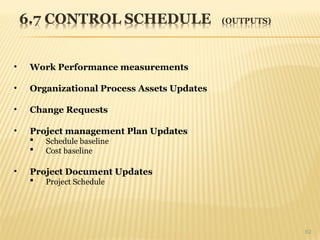
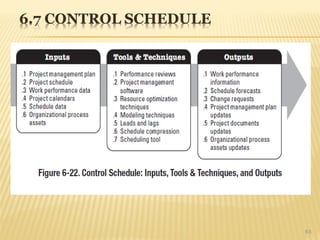
6.7 Control Schedule
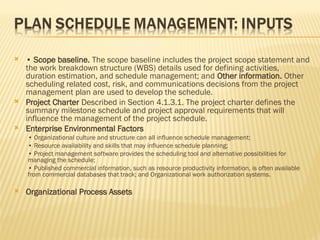
Plan Schedule Management is the process of establishing the policies, procedures, and documentation for planning, developing, managing, executing, and controlling the project schedule. The key benefit of this process is that it provides guidance and direction on how the project schedule will be managed throughout the project. The inputs, tools and techniques, and outputs