Downloaded 12 times
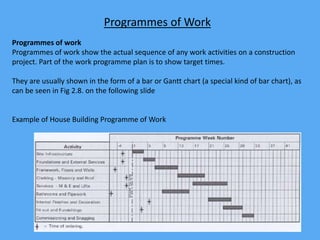
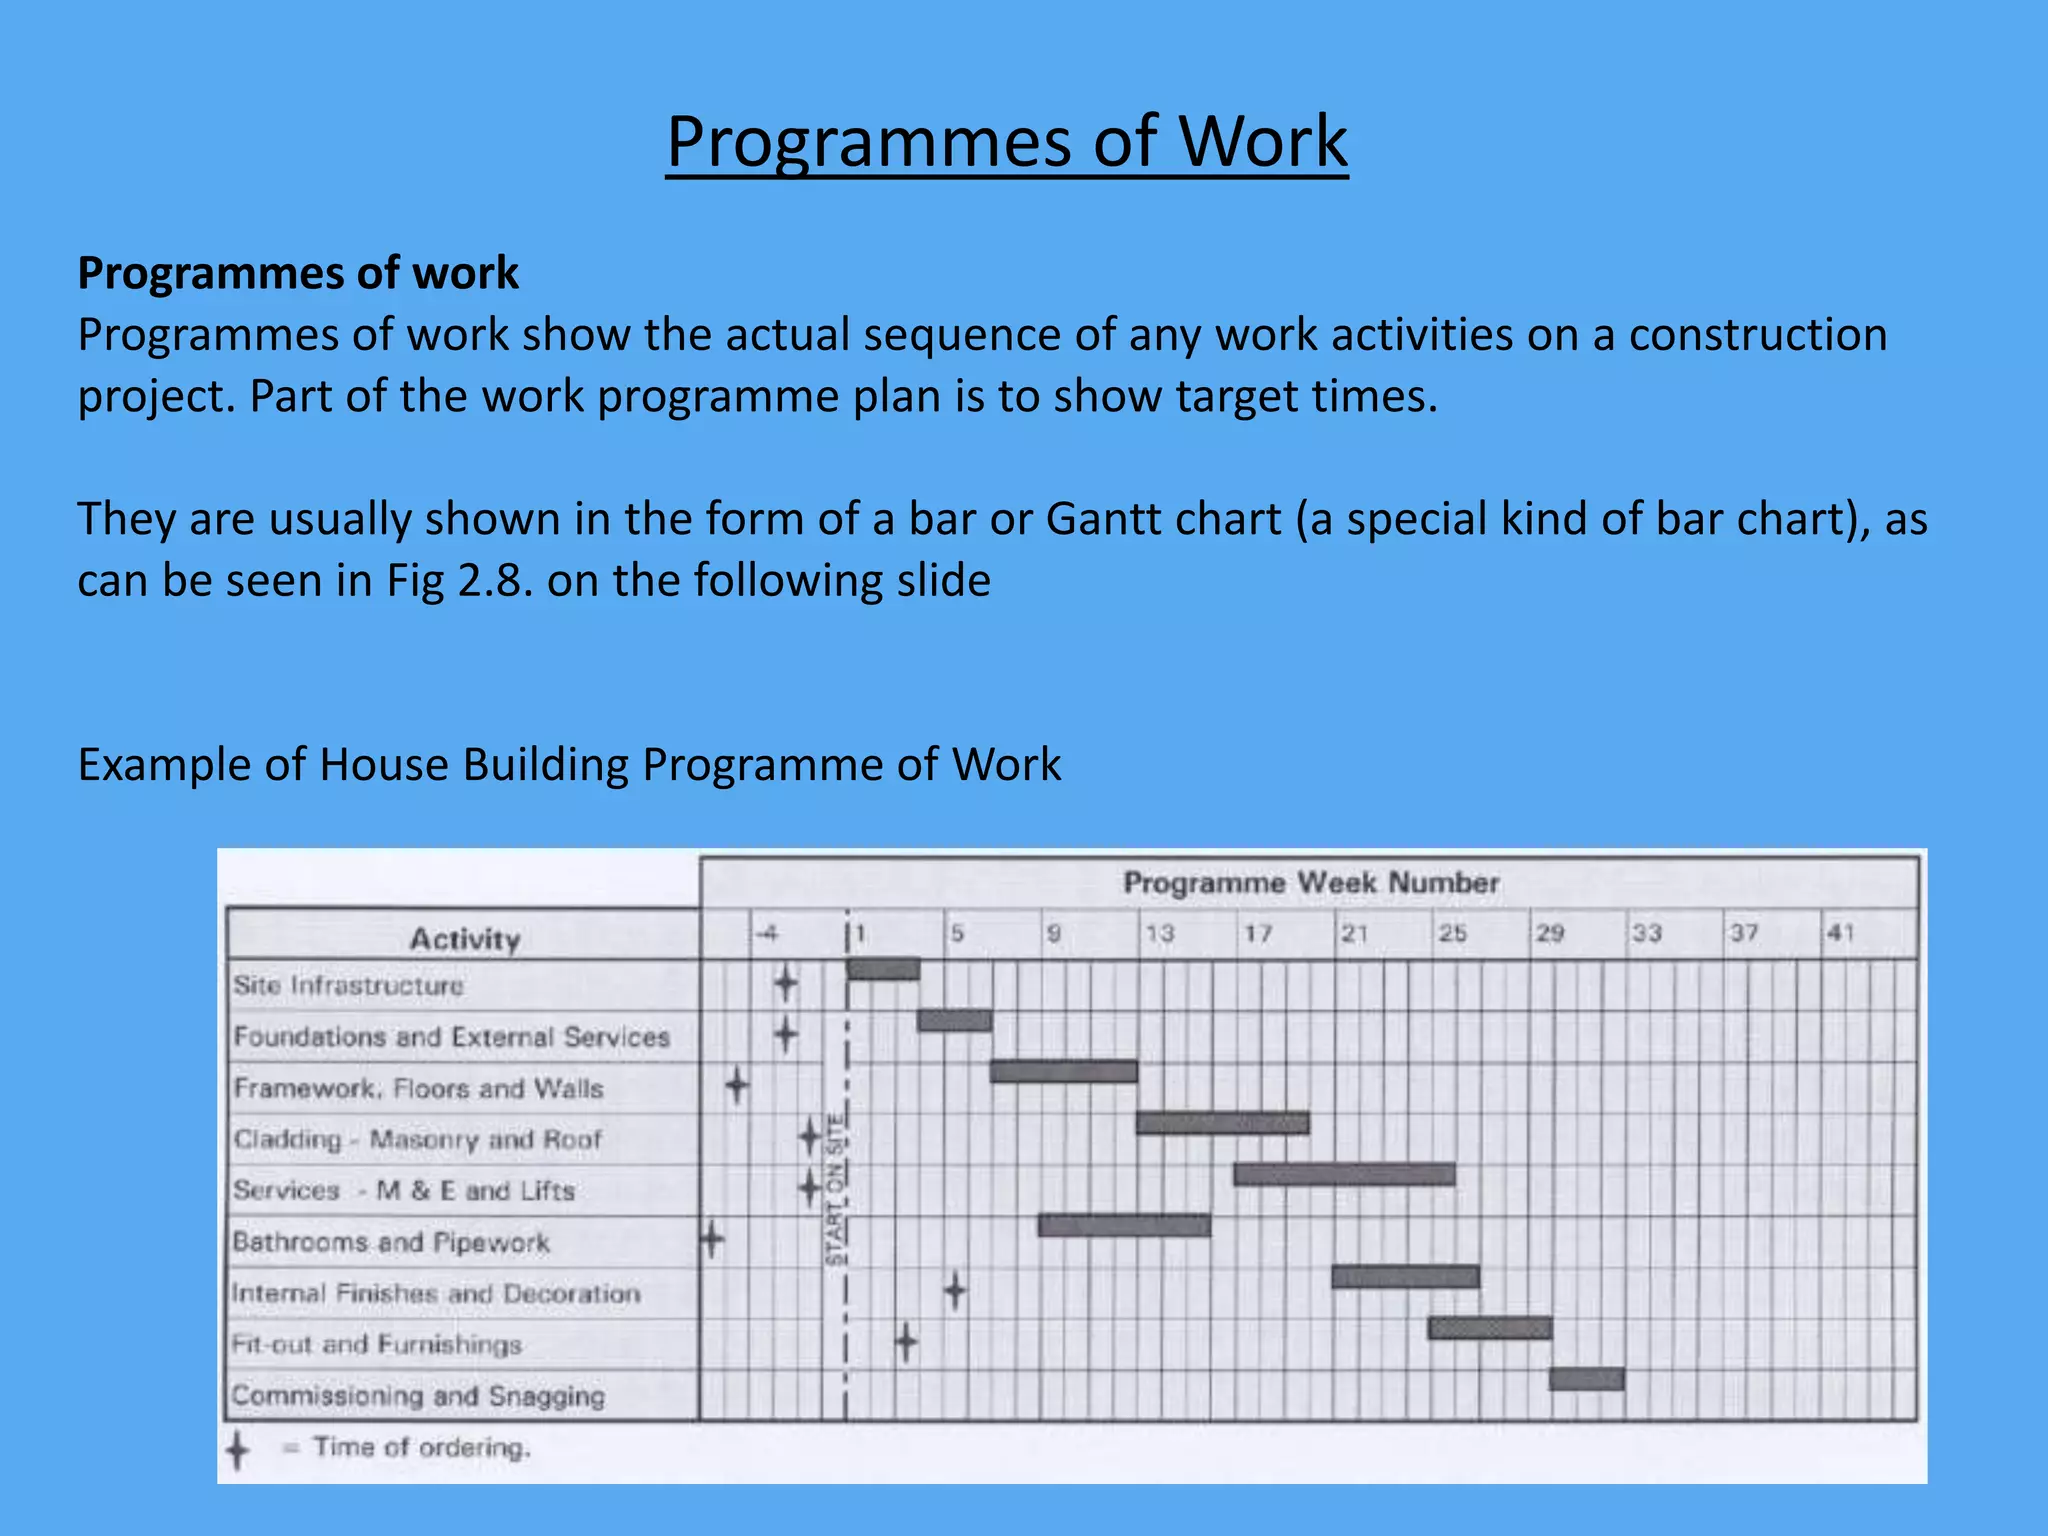
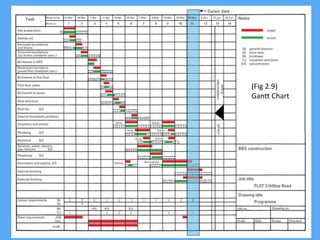

Programmes of work show the planned sequence and target timelines of activities on a construction project. They are typically displayed as bar charts or Gantt charts, with tasks listed on the left and target start and end dates for each shown as blocks on the right. More complex Gantt charts can track actual completion dates against targets, providing visibility into project progress and estimated completion.


