Download as PDF, PPTX


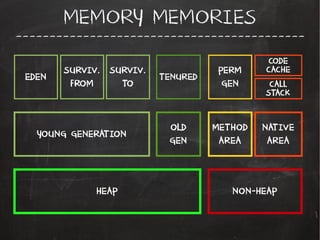


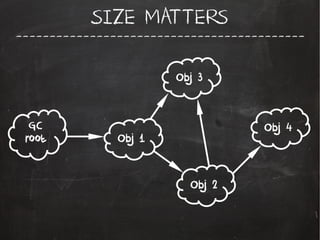
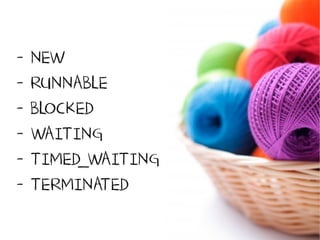


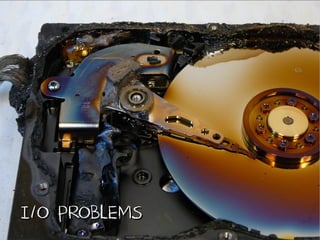


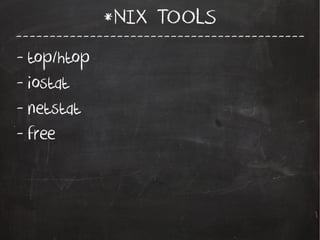

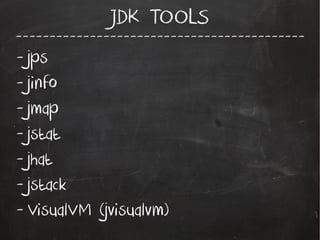


This document discusses Java profiling and provides an overview of Java memory, garbage collection, common memory problems, profiling tools, and a live demo. It begins with introductions and then covers JVM basics like memory areas, object layout, and garbage collection before discussing issues like memory leaks, I/O problems, and deadlocks. Tools covered include Linux utilities as well as JDK tools and profilers. The document concludes with a thank you and a link to view a live demo on GitHub.