TPG 4105 NTNU
PROCESSING OF PETROLEUM
Compression
Professor Jon Steinar Gudmundsson
Department of Petroleum Engineering and Applied Geophysics
Norwegian University of Science and Technology
Trondheim
November 8, 2013
Compression in Oil and Gas Production
• Recompression in separation train of gas and
condensate (same as in oil production).
• Export compression (from platform to pipeline).
• Reinjection compression (from platform to subsurface).
• Various air compressors for control equipment in
processing facilities (offshore and onshore).
• Export compression, from receiving and processing
terminal to pipeline.
• Pressure boosting, onland compression.
• Gas storage in salt caverns.
• Subsea compression (now being installed)
A: Recompression, B: Gas Drying, C: Fuel Gas, D: Export Compression,
E: Gas Pipeline, F: Injection Compression, G: Injection Well
Offshore Gas Turbines
• The oil and gas industry in 2007 represented 25 % of CO2 emissions
in Norway. 70 % is offshore (combustion, diesel and flaring)
• Requirement for electricity offshore 2007 was 15 TWh (Norway’s
total electricity production was then about 125 TWh).
• In 2007 there were 167 gas turbines on offshore installations
amounting to 3000 MW.
• About 45 % of the power is for electrical equipment. The remaining
power is gas turbines for compressors and other equipment.
• The thermal efficiency of the gas turbines is in the range 30-37 %.
• Thermal recovery is used in most of the installations, increasing the
thermal efficiency to about 40 %
Kraft fra land til norsk sokkel (2008), OD o.a.
Types of Compressors
• Reciprocating piston compressors
– Low flow rate
– High compression ratio
• Rotating centrifugal compressors
– High flow rate
– Low compression ratio each stage
– Several stages higher compression ratio
Radial Flow Compressor
Centrifugal Compressor
Axial Flow Compressor
Subsea Compressor
Characteristic Curve
Characteristic Curves
A: Centrifugal, B: Axial,
C: Piston, D: Screw
Left: Radial,
Middel: xxx,
Right:Axia
Thermodynamic Processes
Process Condition Exponent
Adiabatic
Isobaric
Isothermal
Isentropic
Polytropic
Isometric
dq=0
dp=0
dT=0
ds=0
∑ds=0
dV=0
k=Cp/Cv
k=0
k=1
k=Cp/Cv
k<n
k=∞
Reversible adiabatic process = Isentropic process
Compressor Work


2
1
vdp
W
A = Suction, B = Compression, C =Delivery, D = Expansion
Adiabatic/Isentropic Process
nRT
pV 
RT
pv 
v
p
C
C
k 
k
k
p
p
T
T
1
1
2
1
2










k
k
v
p
v
p 2
2
1
1 
Adiabatic/Isentropic Compression


2
1
vdp
W






















1
1
1
1
2
1
1
k
k
p
p
k
k
v
p
W






















1
1
1
1
2
1
k
k
p
p
k
k
RT
M
m
P
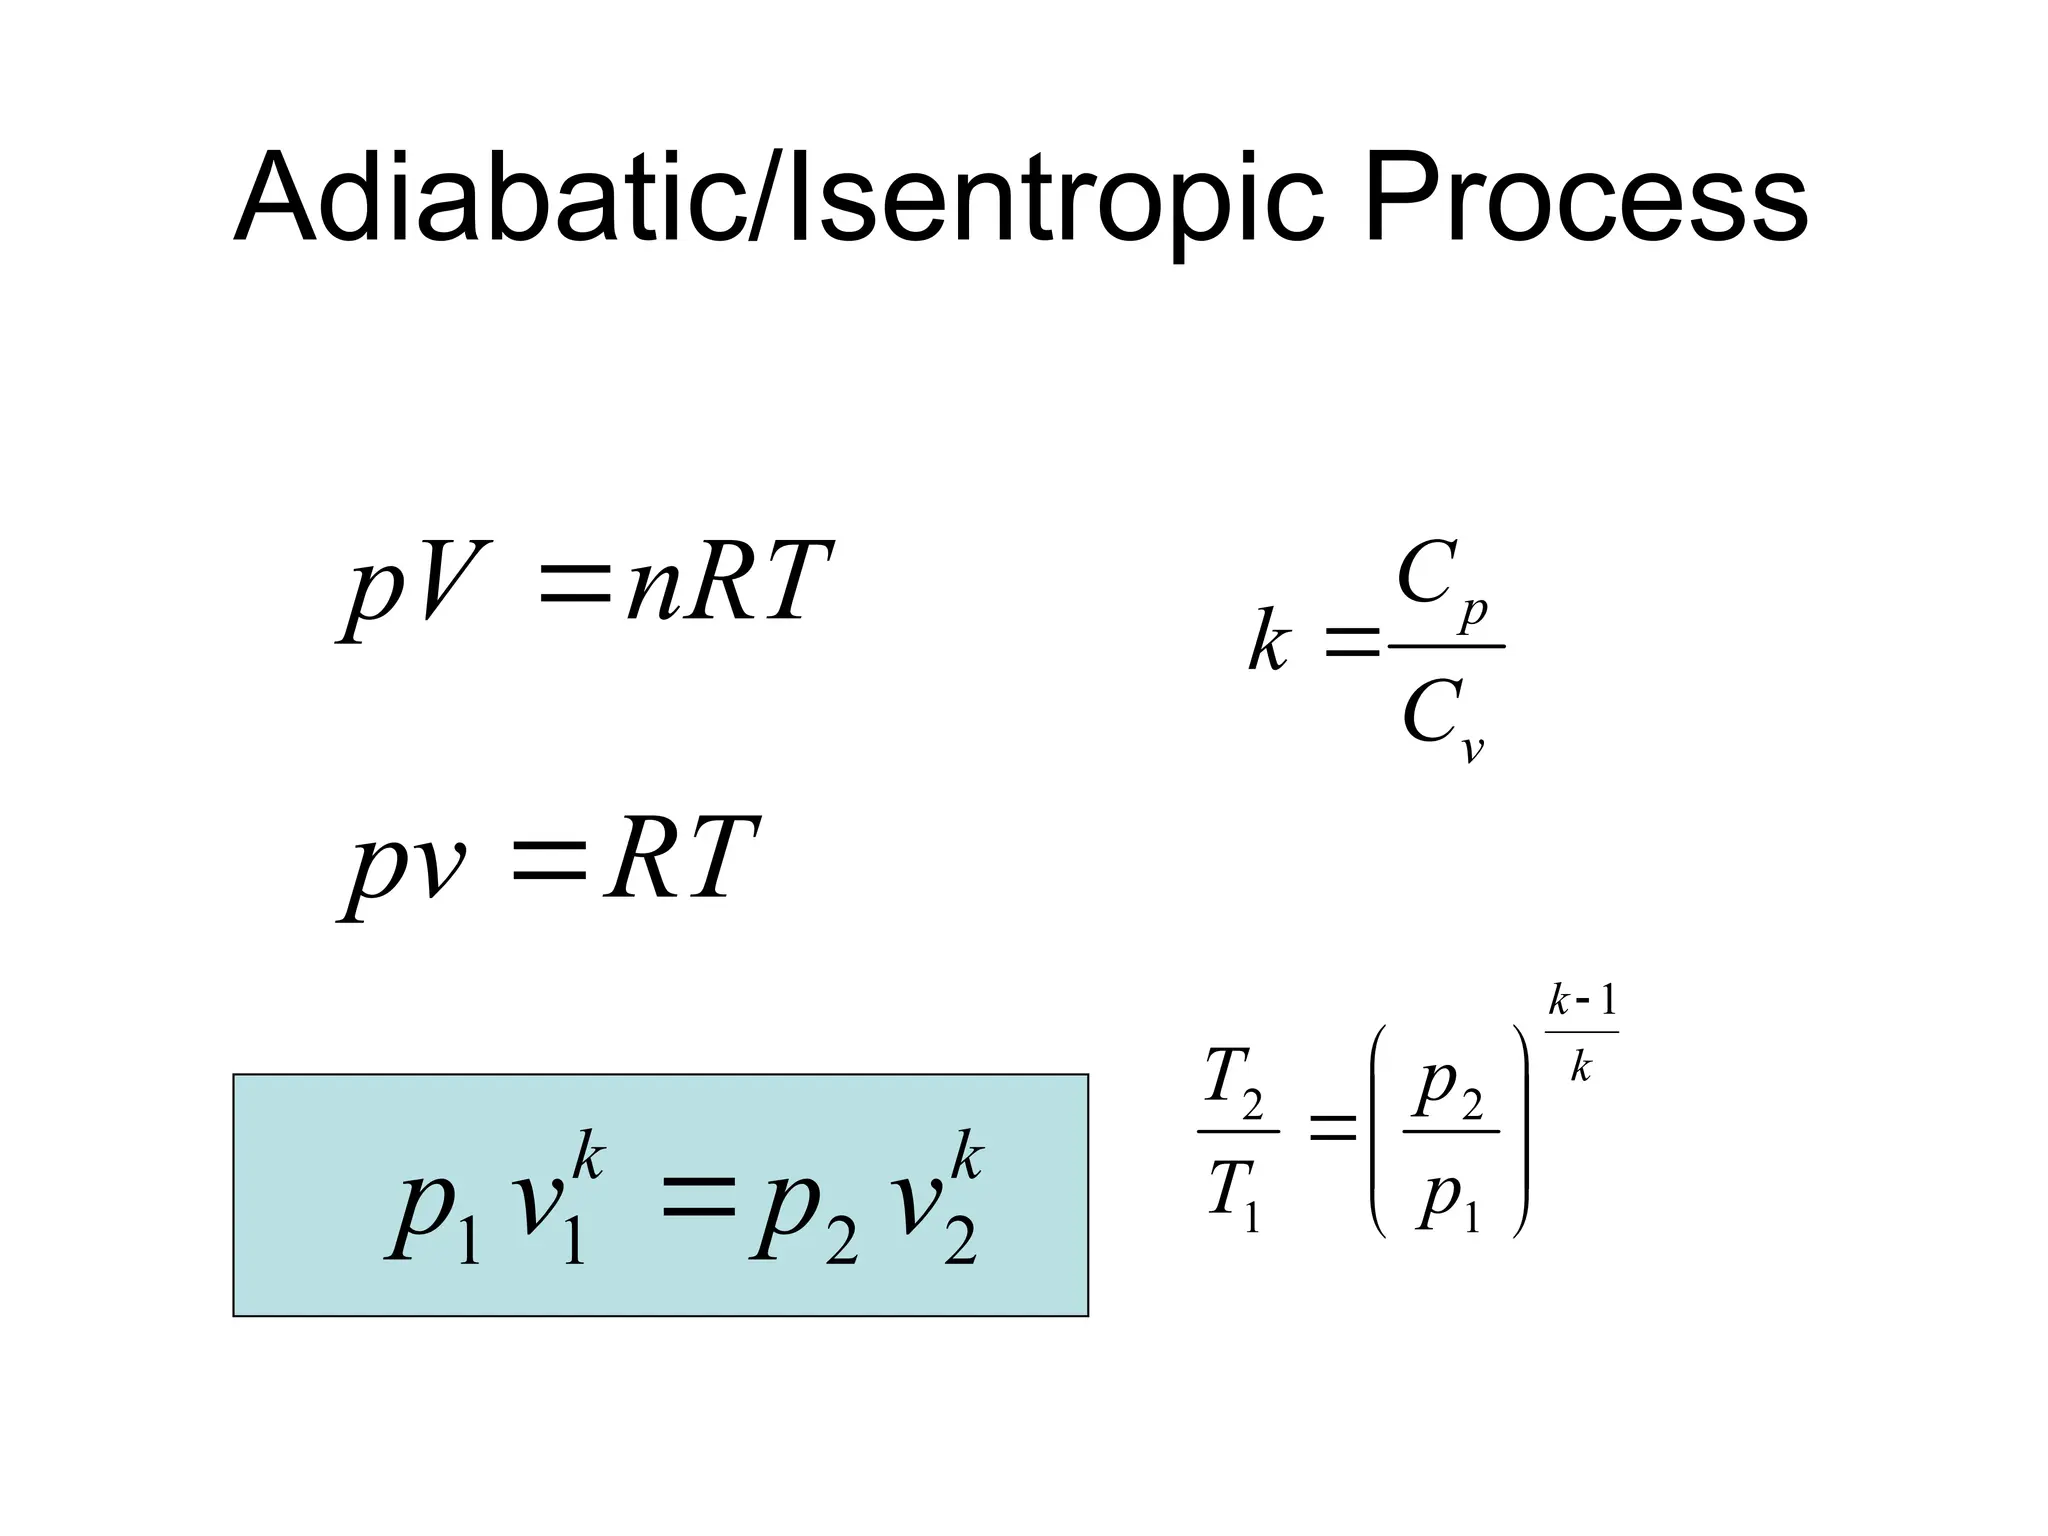
v [m3/mol], p [Pa=N/m2], W [Nm/mol=J/mol] = Specific work
pv=RT, Wm/M [J/mol kg/s mol/kg=J/s=W] = Power
nRT
pV 
RT
pv 
Ideal Gas Compression






























1
1
1
1
2
1
k
k
ideal
p
p
k
k
RT
M
m
P
m (kg/s) 70
M (kg/kmol) 20,43
R (J/kmolK) 8314,34
T innløp C 30
k (Cp/Cv) 1,26
p innløp bara 80
p utløp bara 160
P (MW) 6,44
T utløp C 77
Surge and Stone Wall
A: Surge line, B: Stonewall line
Surge Control
Compression in Two Stages
2
3
1
2
p
p
p
p

3
1
2 p
p
p 
Above pressures give
minimum power
Compression in Two Stages
Hedne (2013)
Summary
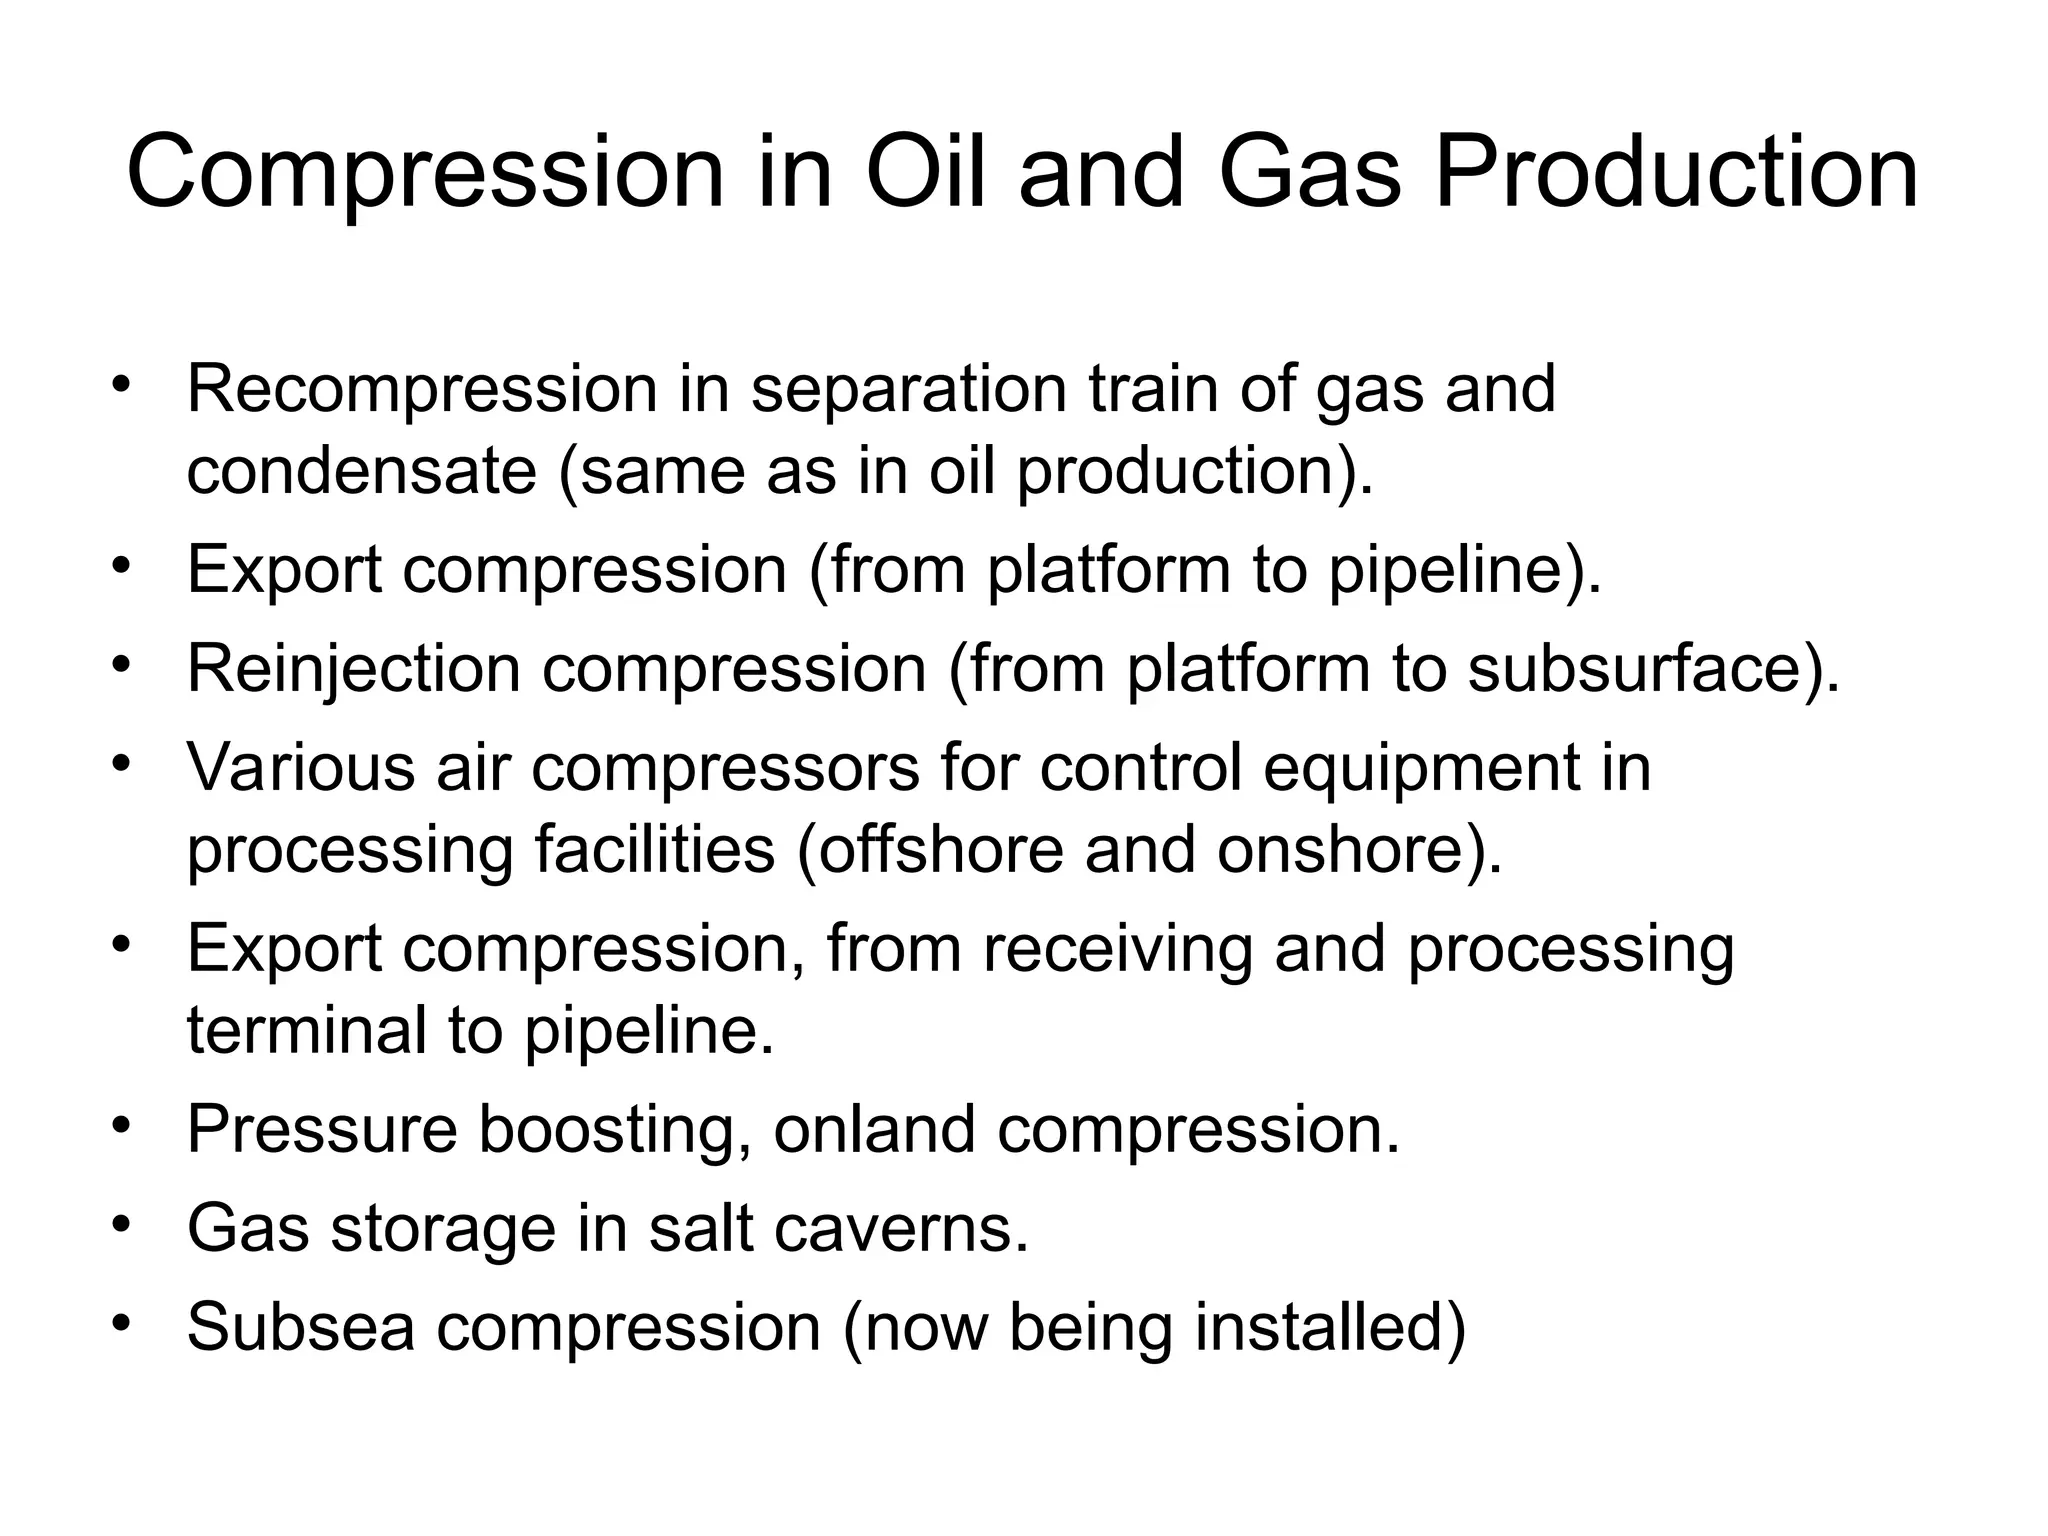
– Compression in oil and gas industry
– Offshore compression/compressors
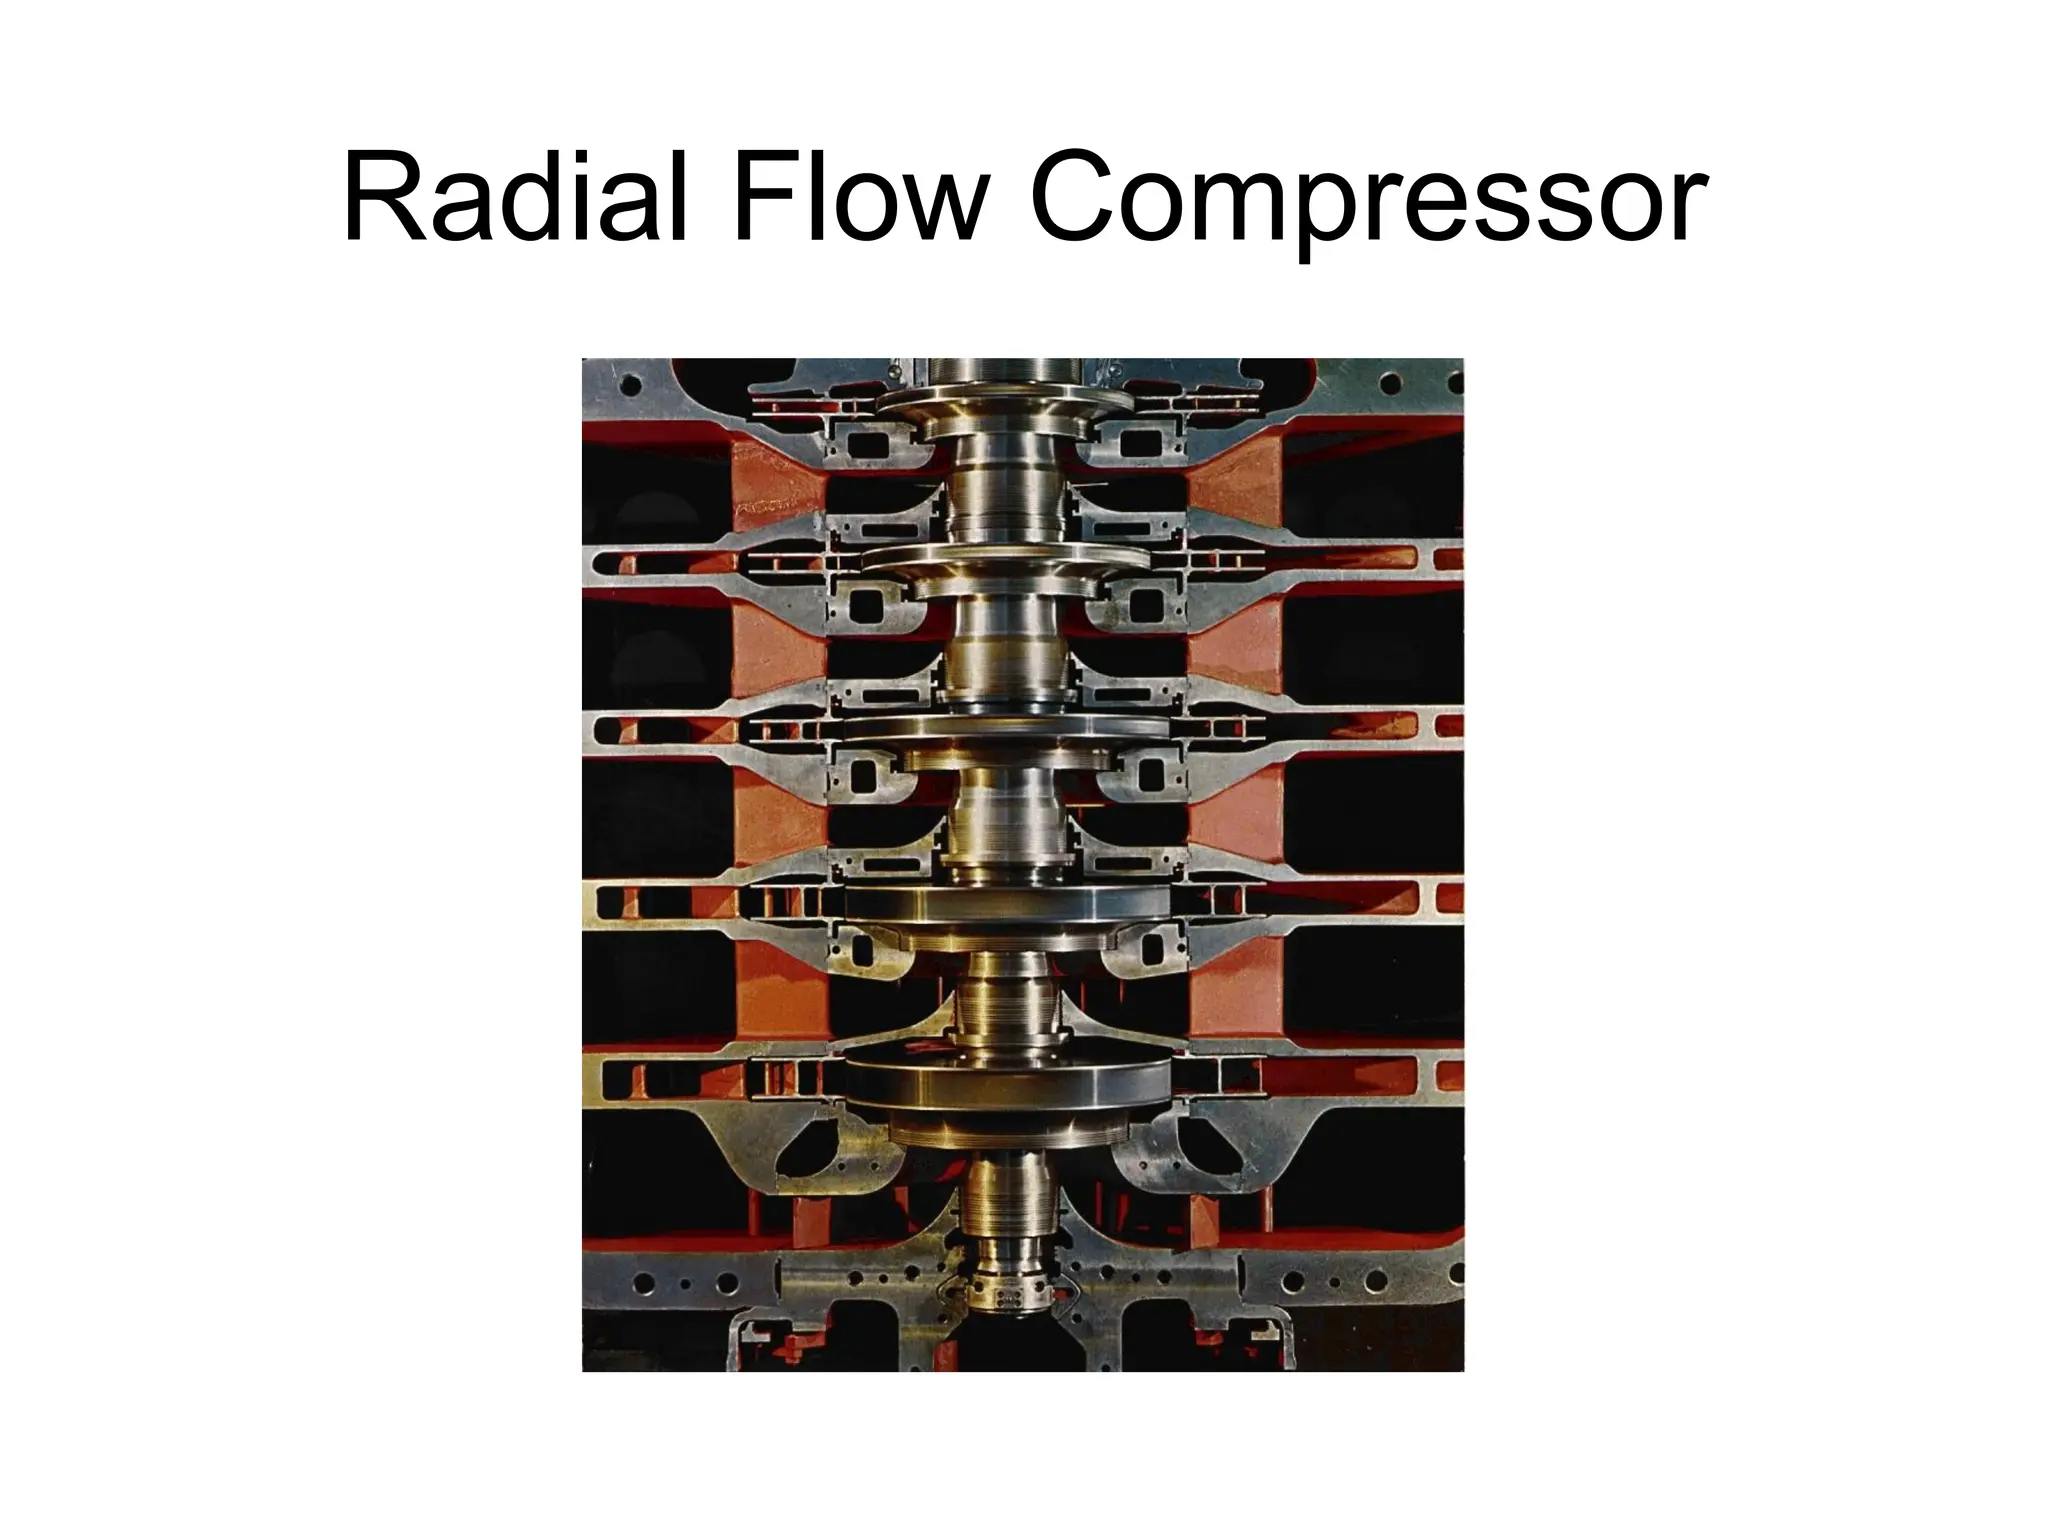
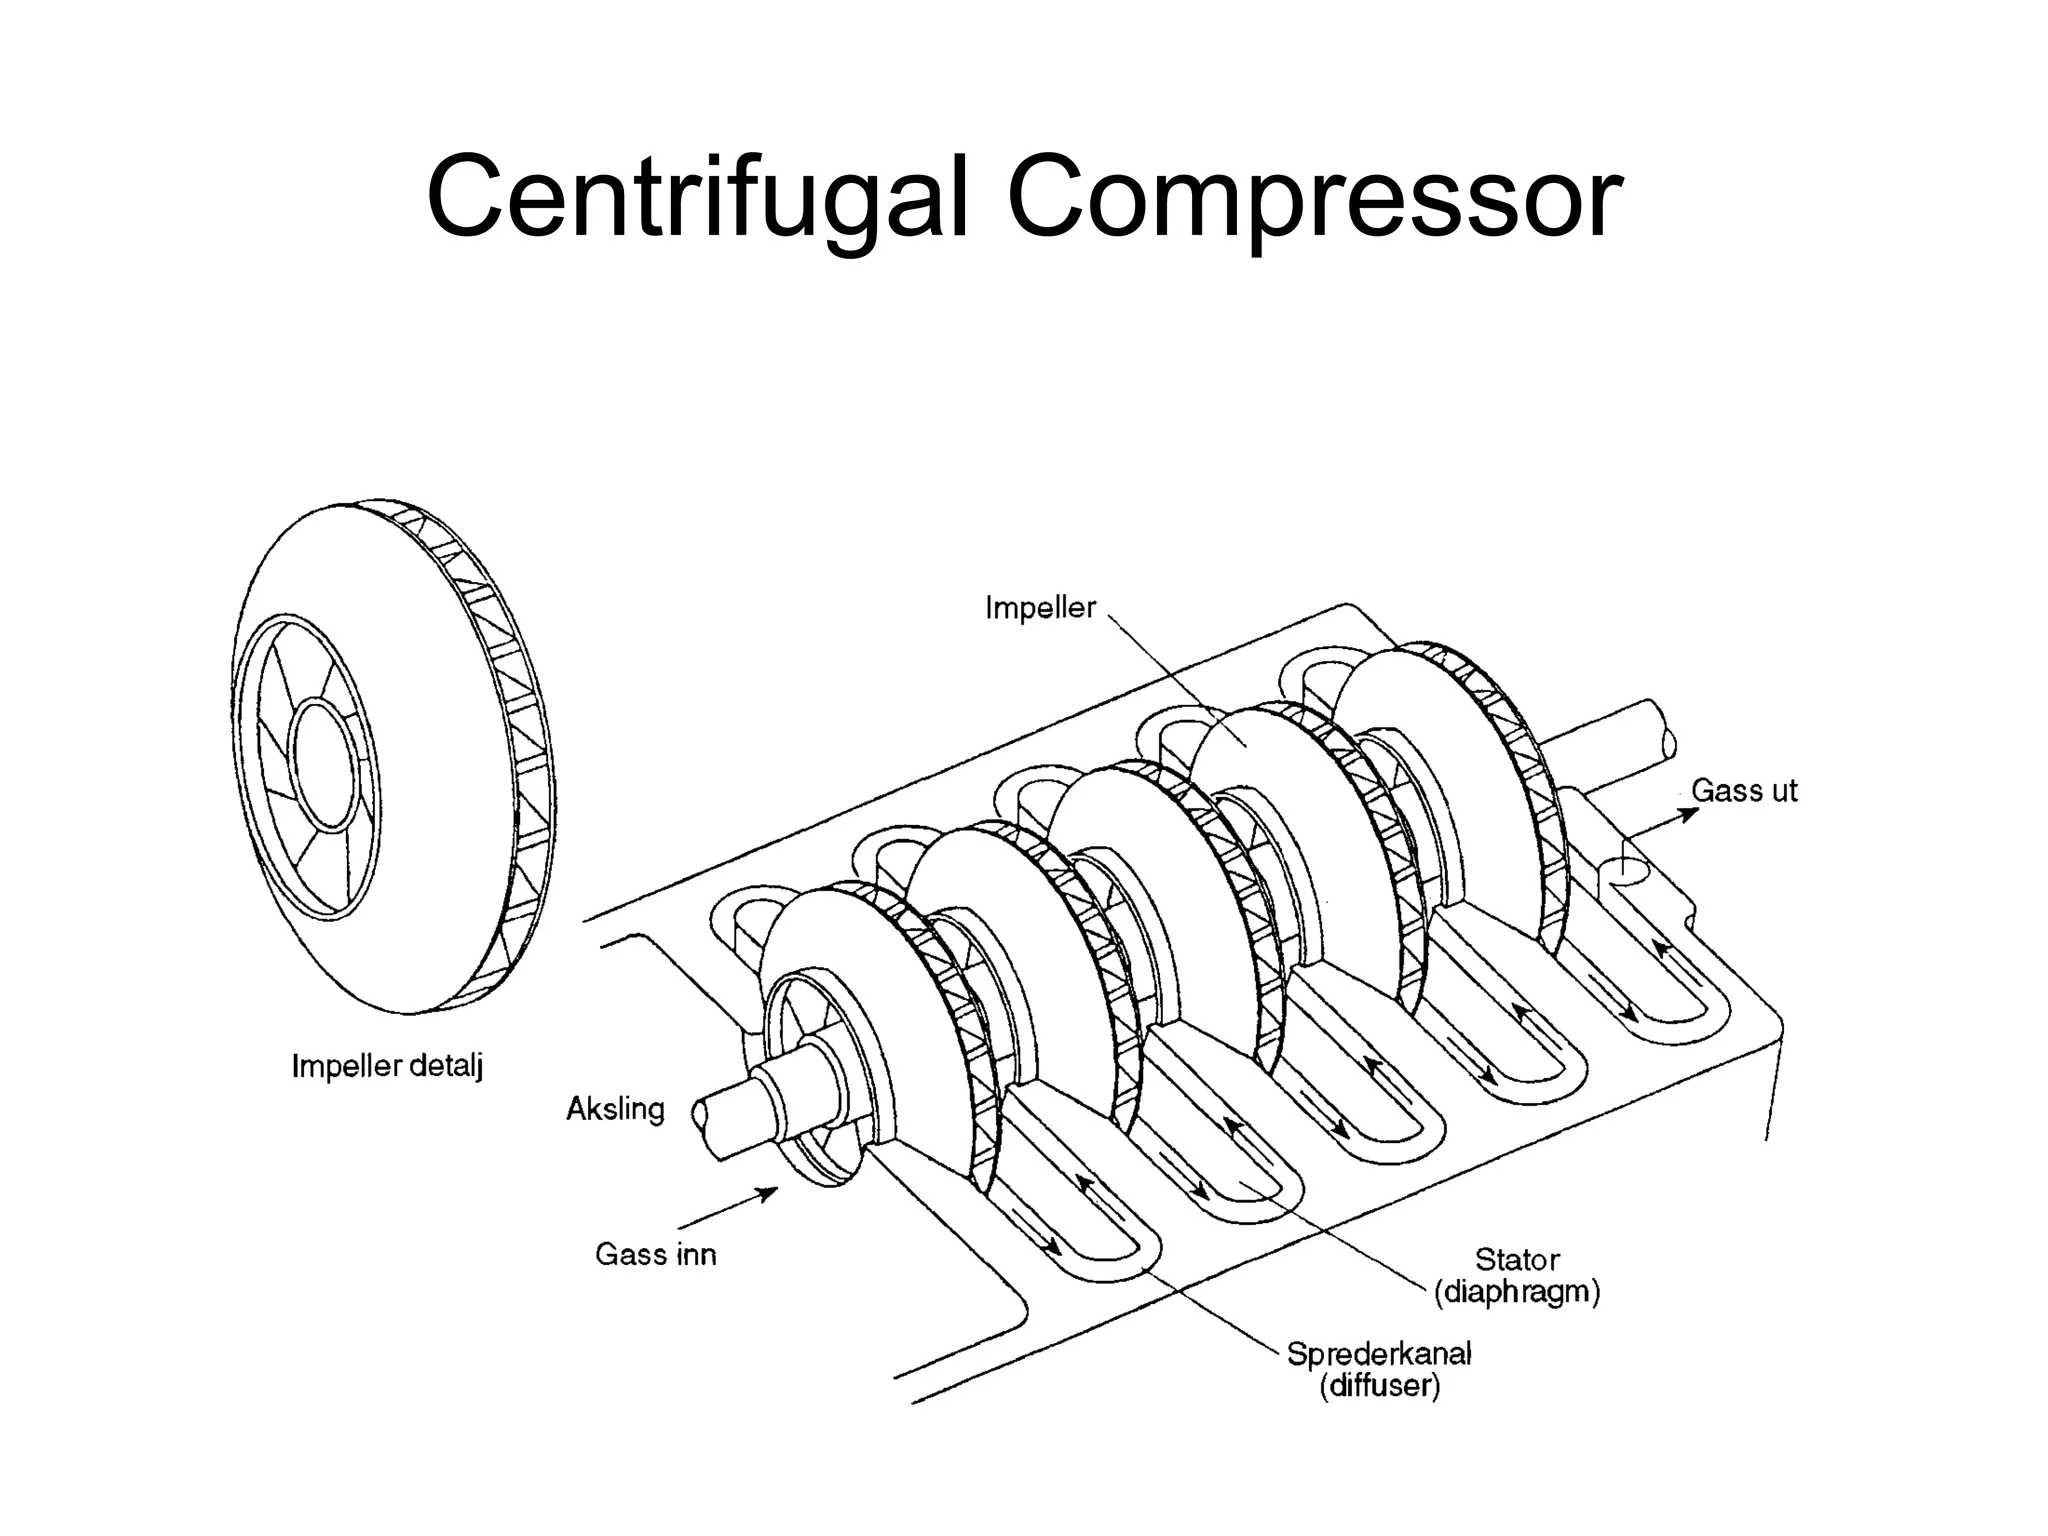
– Types of compressors
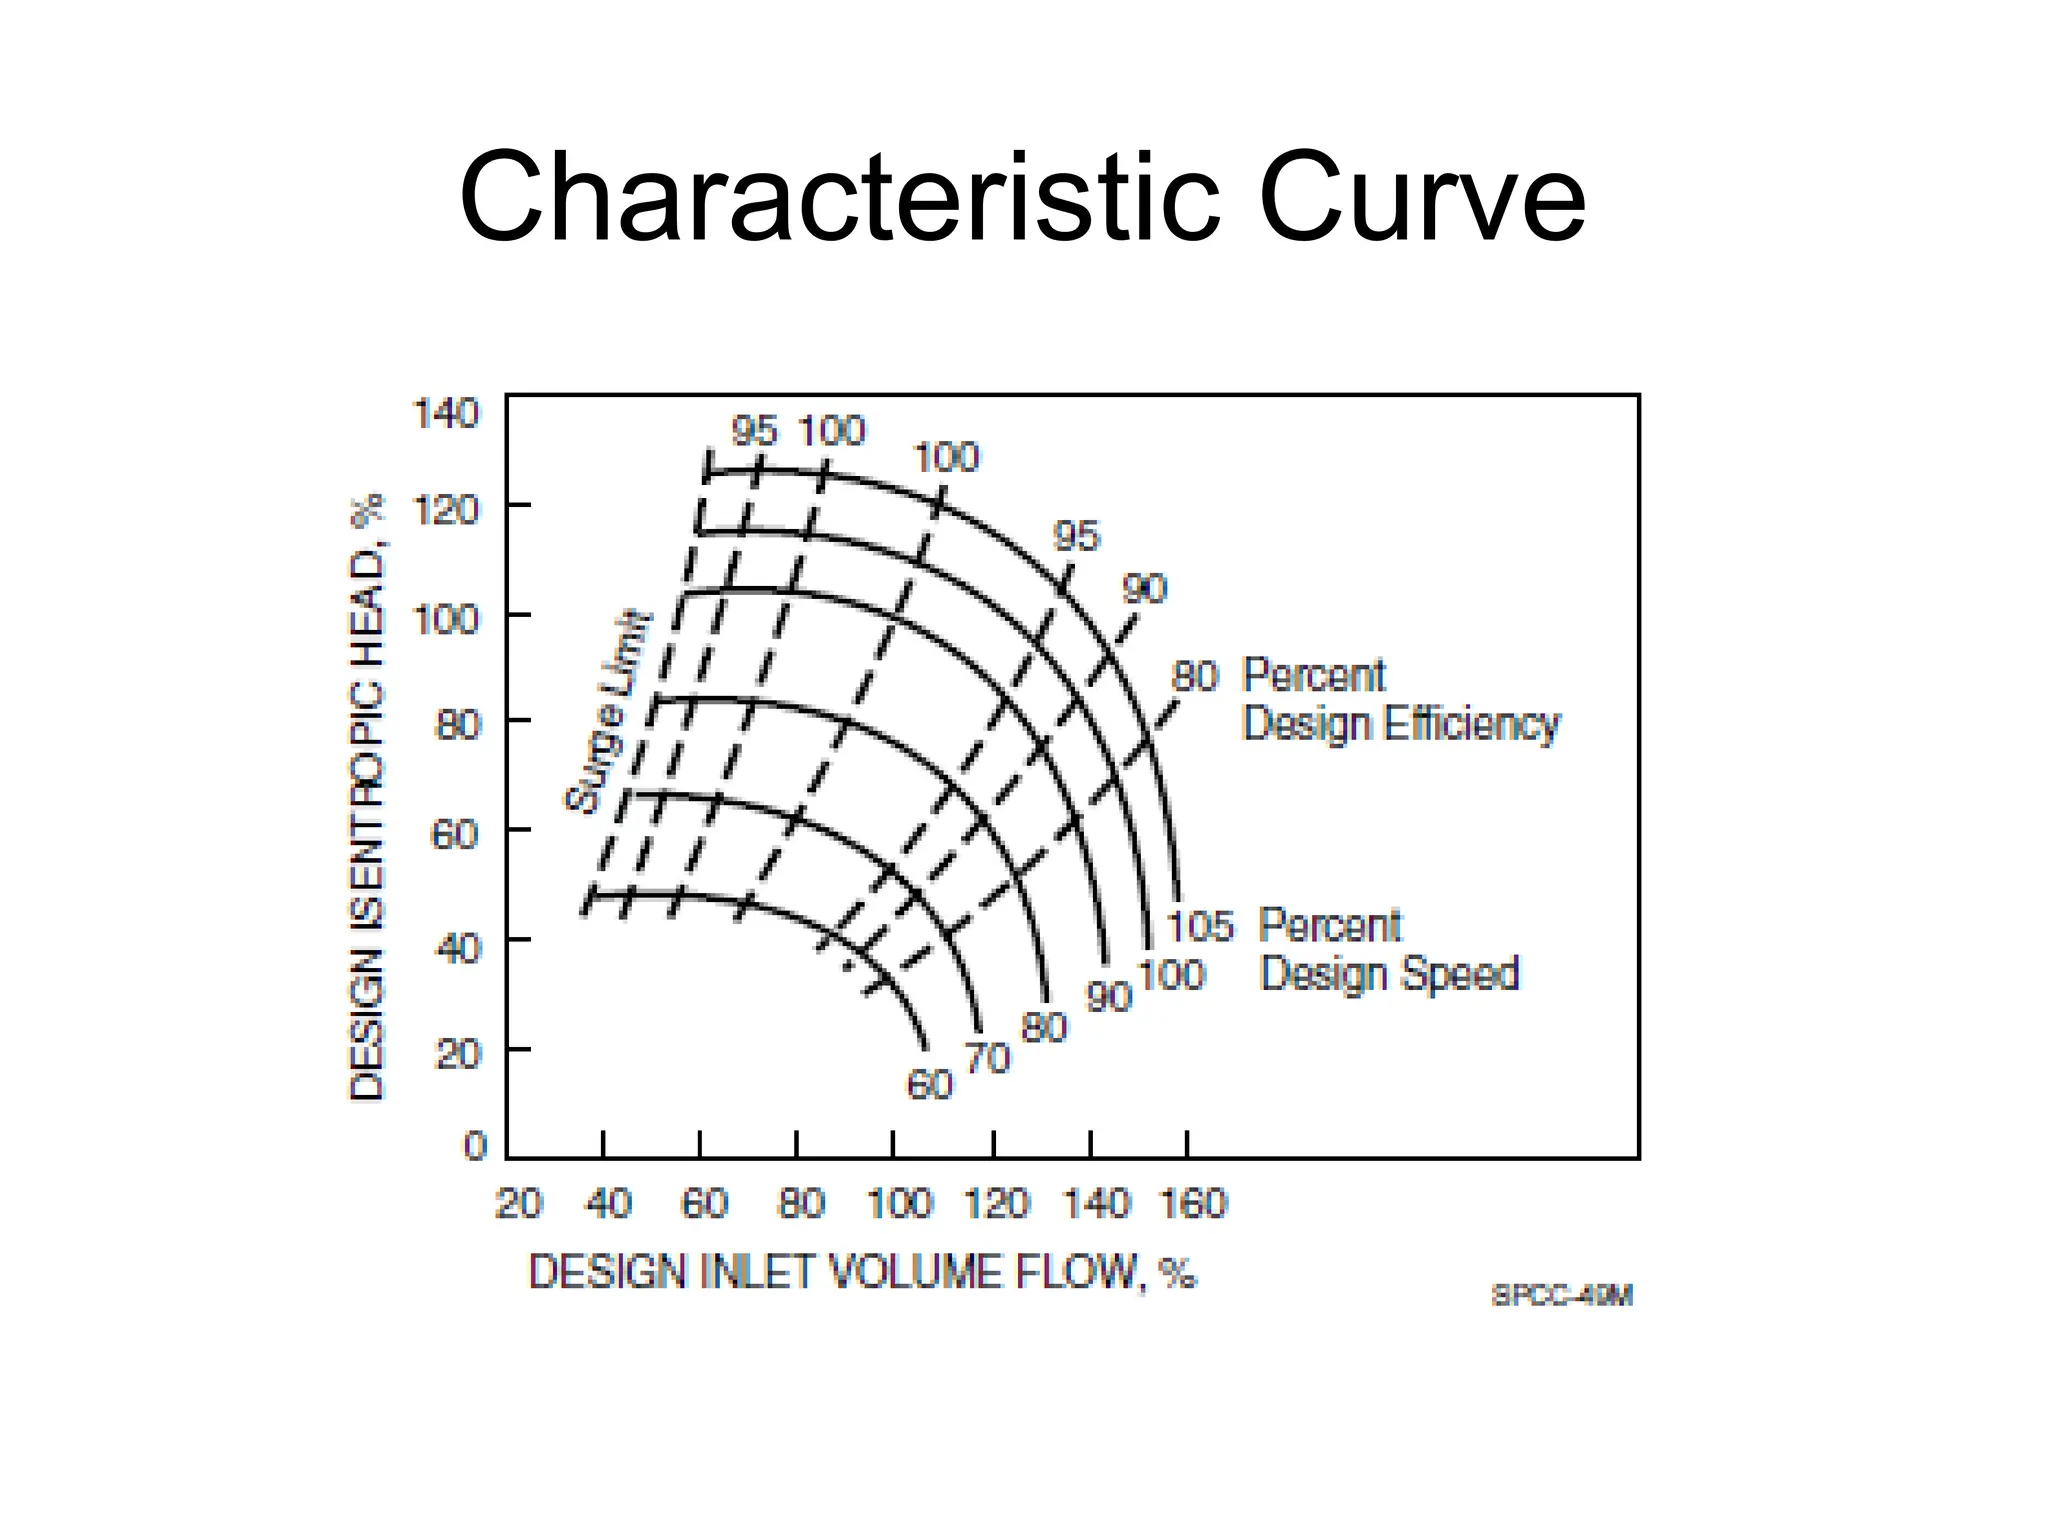
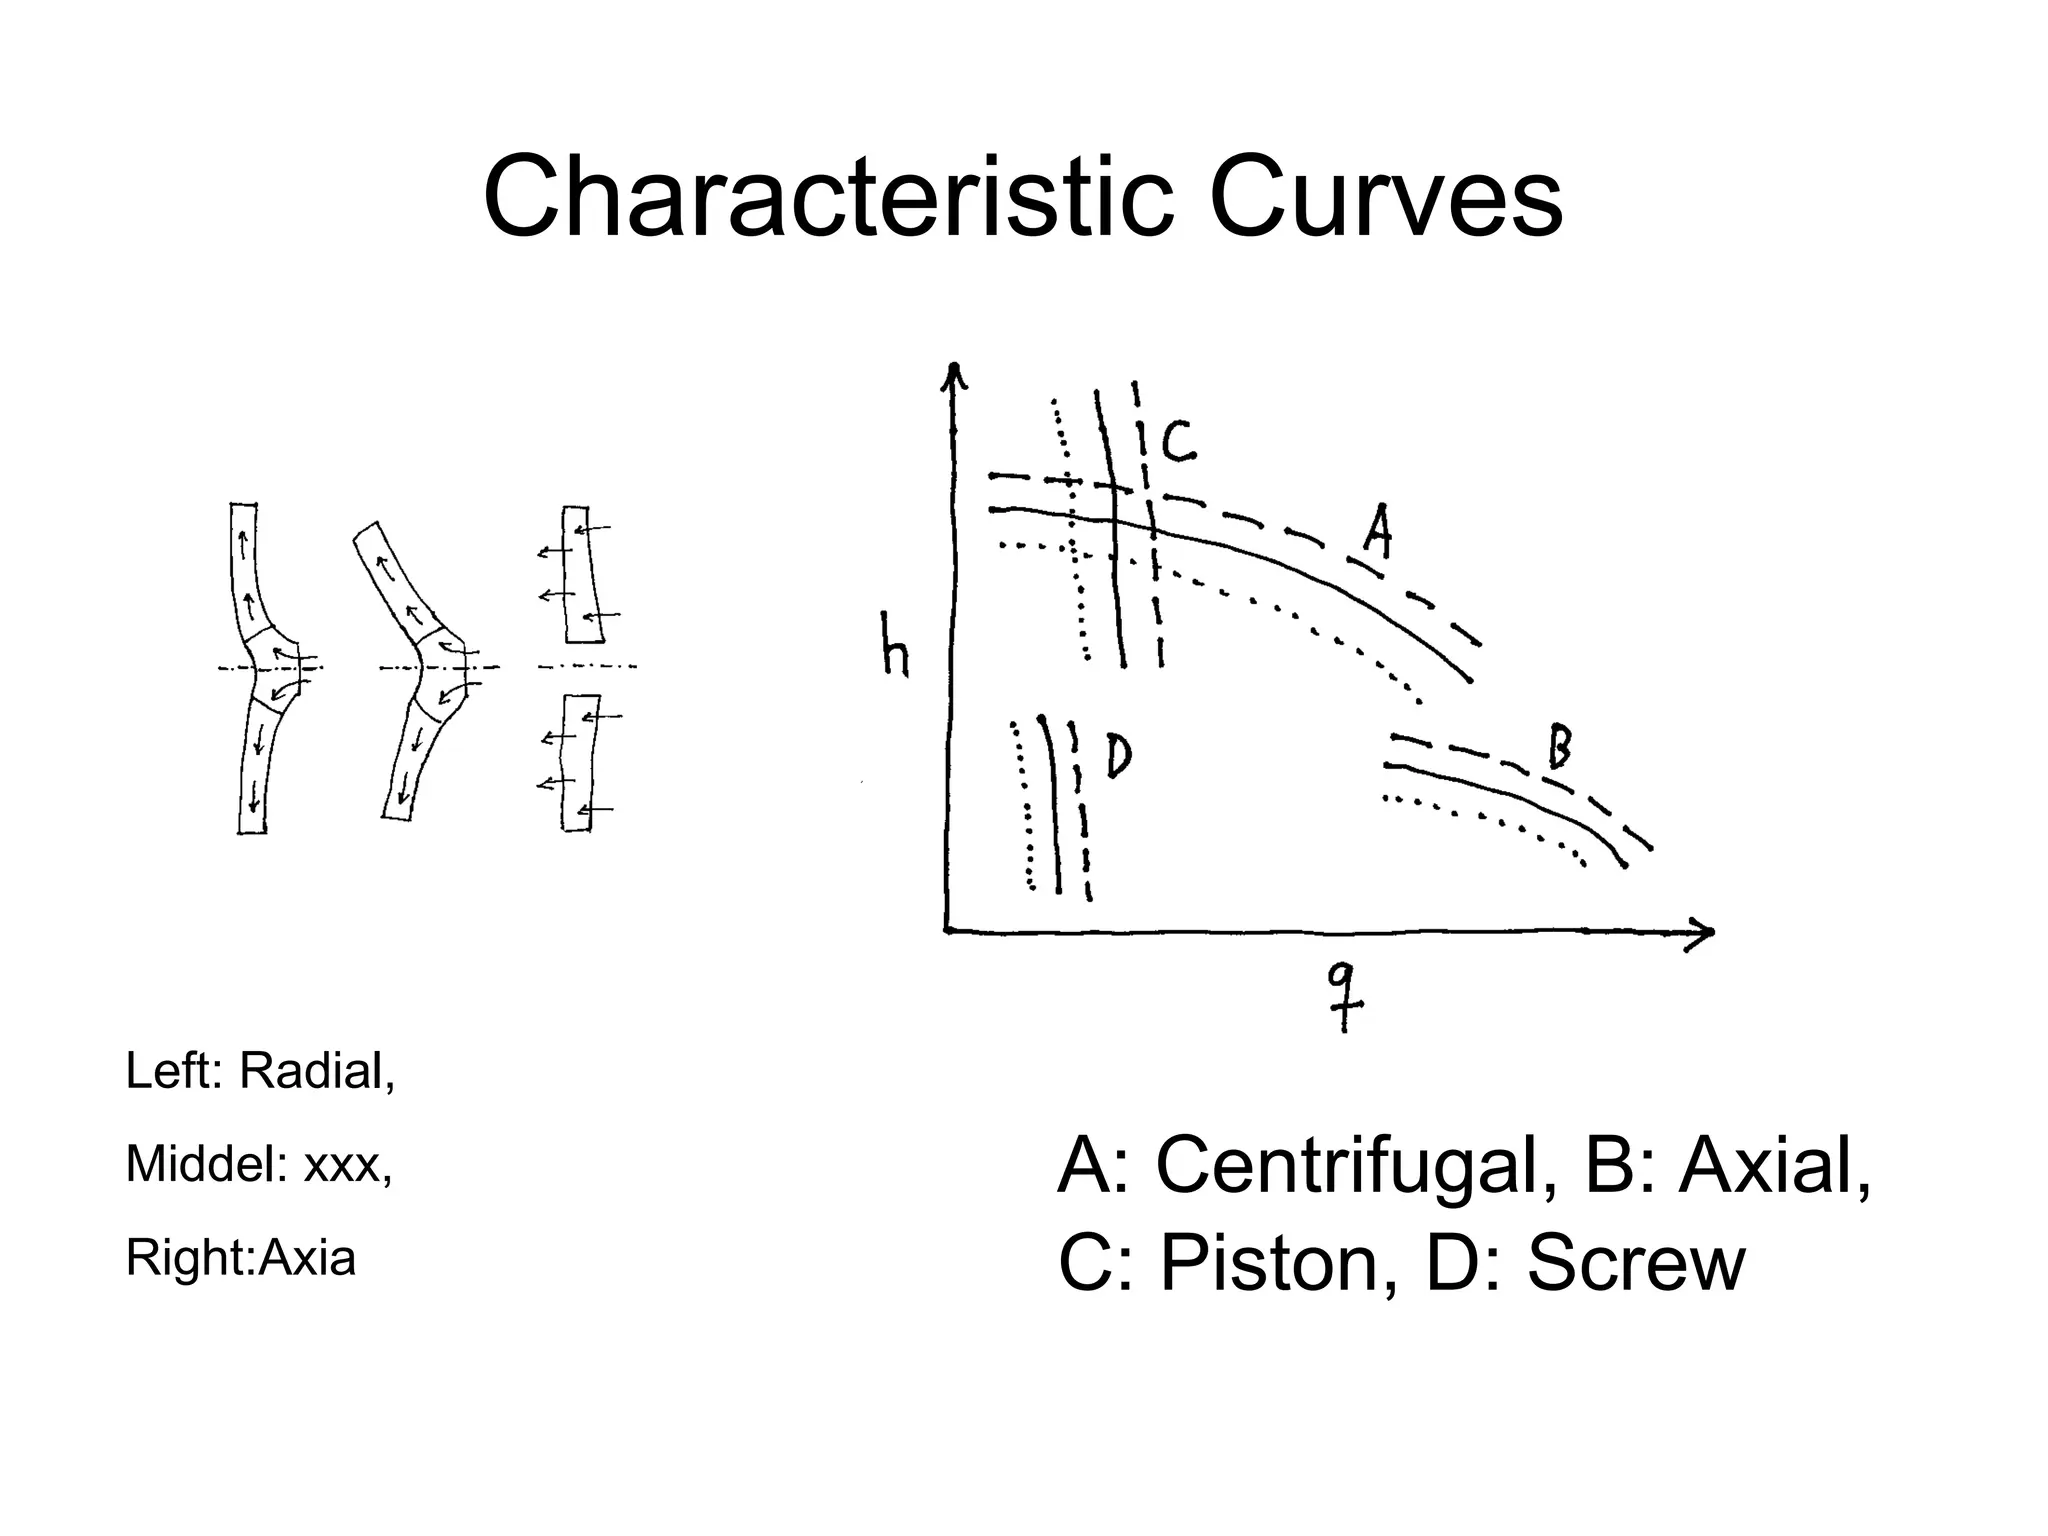
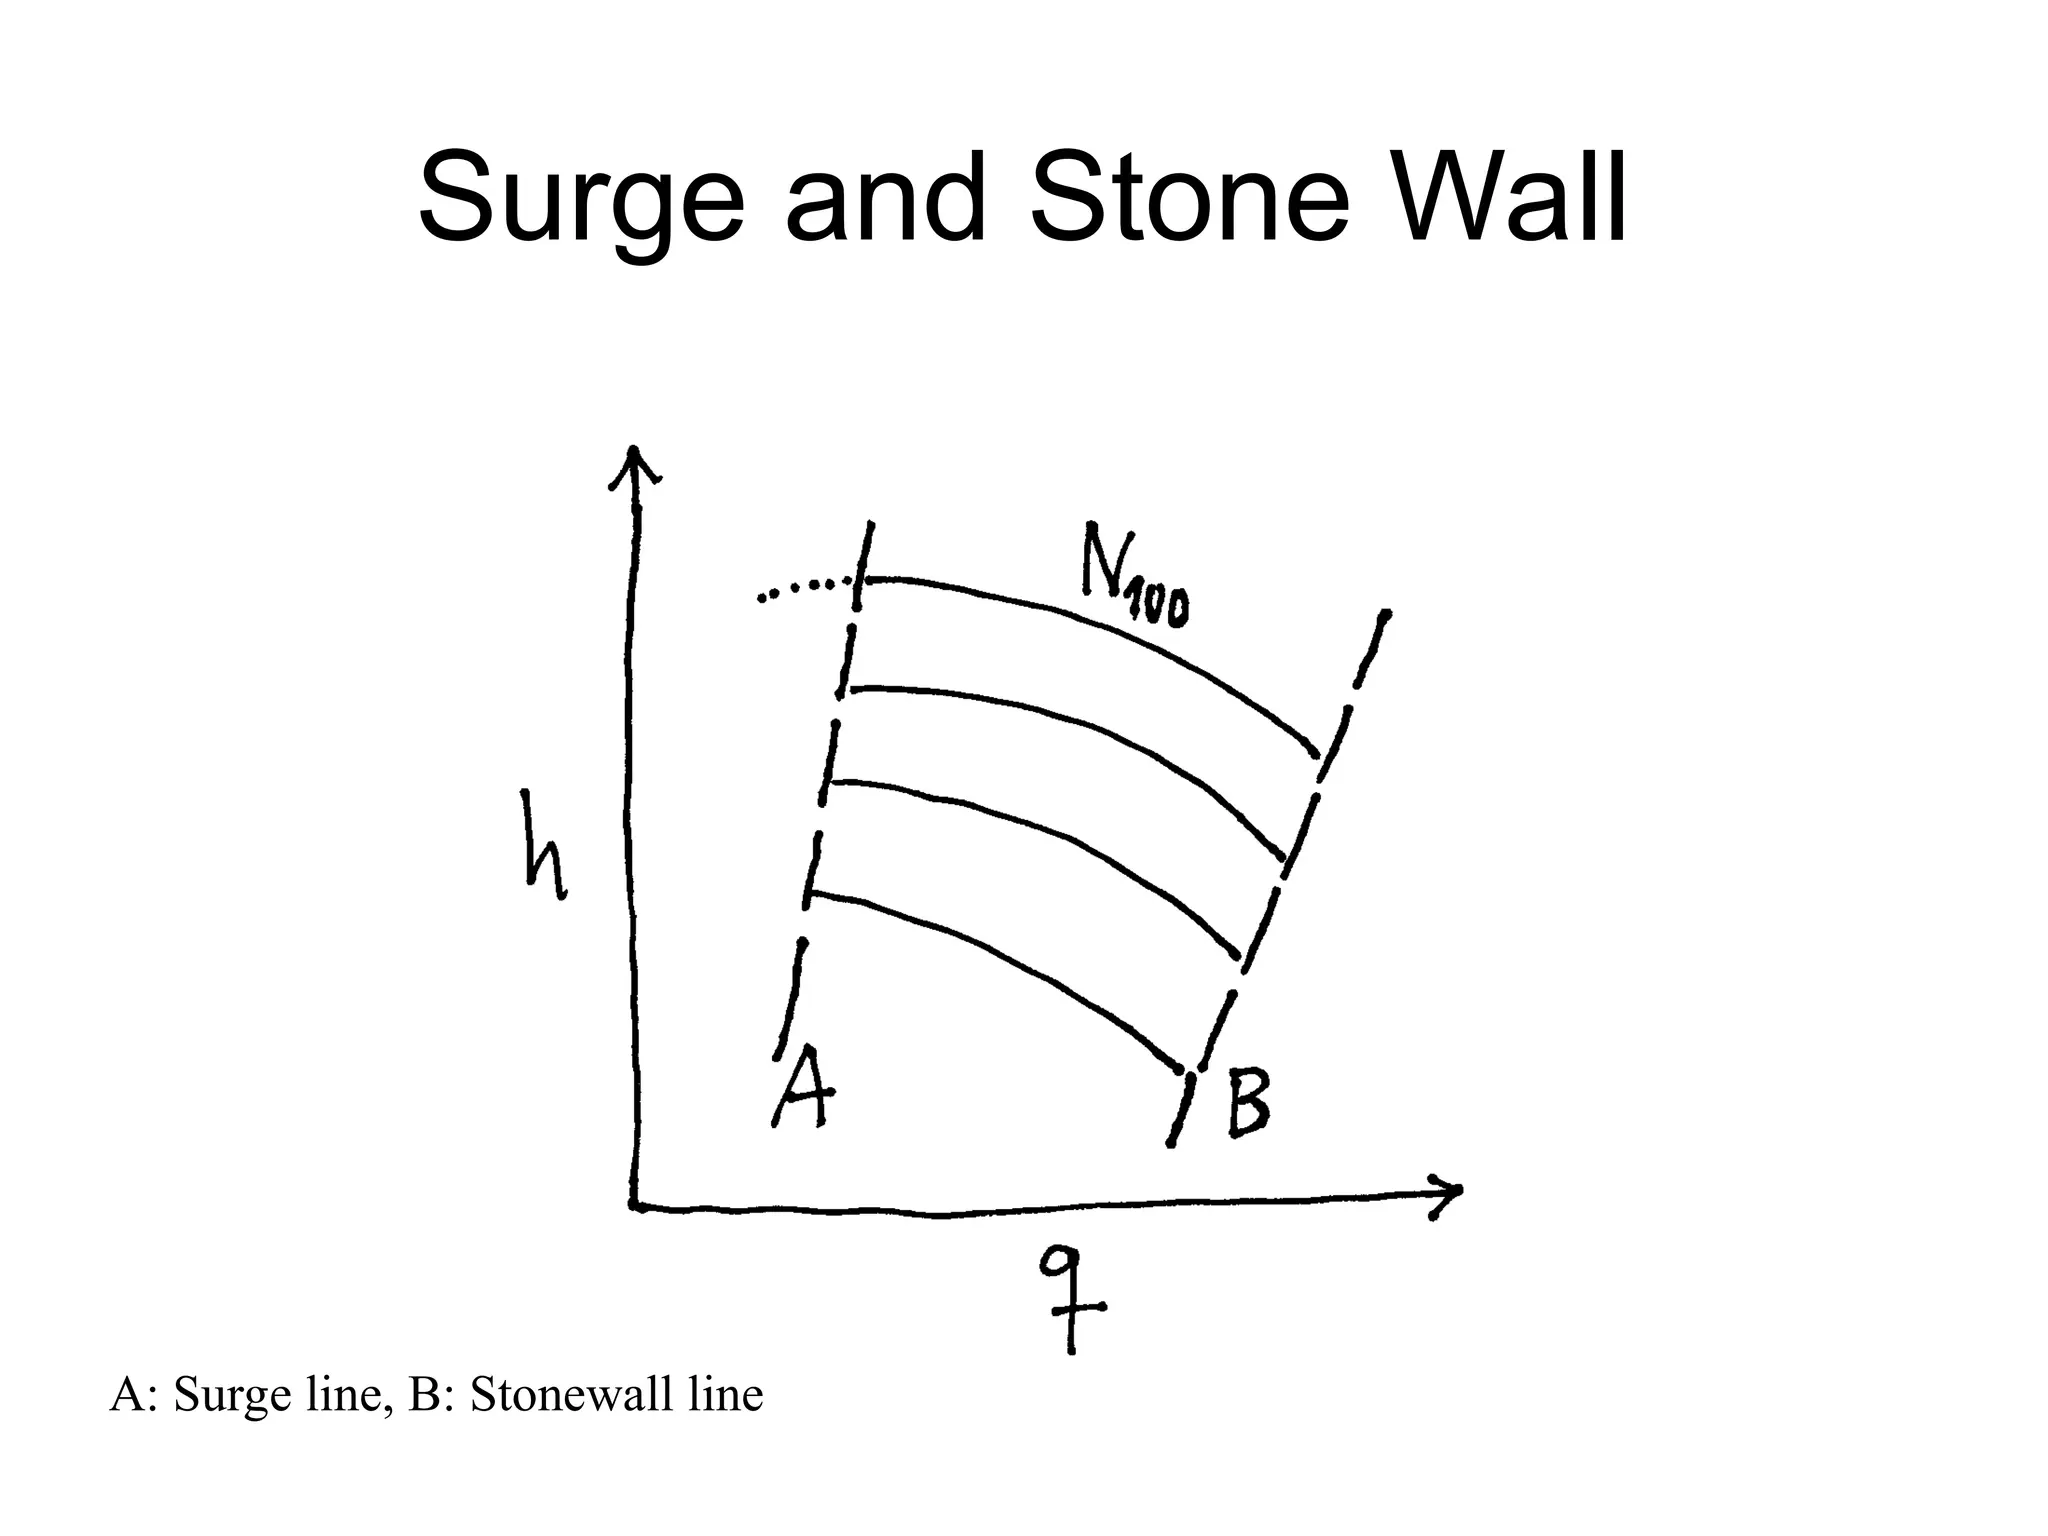
– Characteristic curves P [W] or h [J/kg] vs. q [m3/h]
– Calculation of compression power (isentropic)
– Surge and surge control
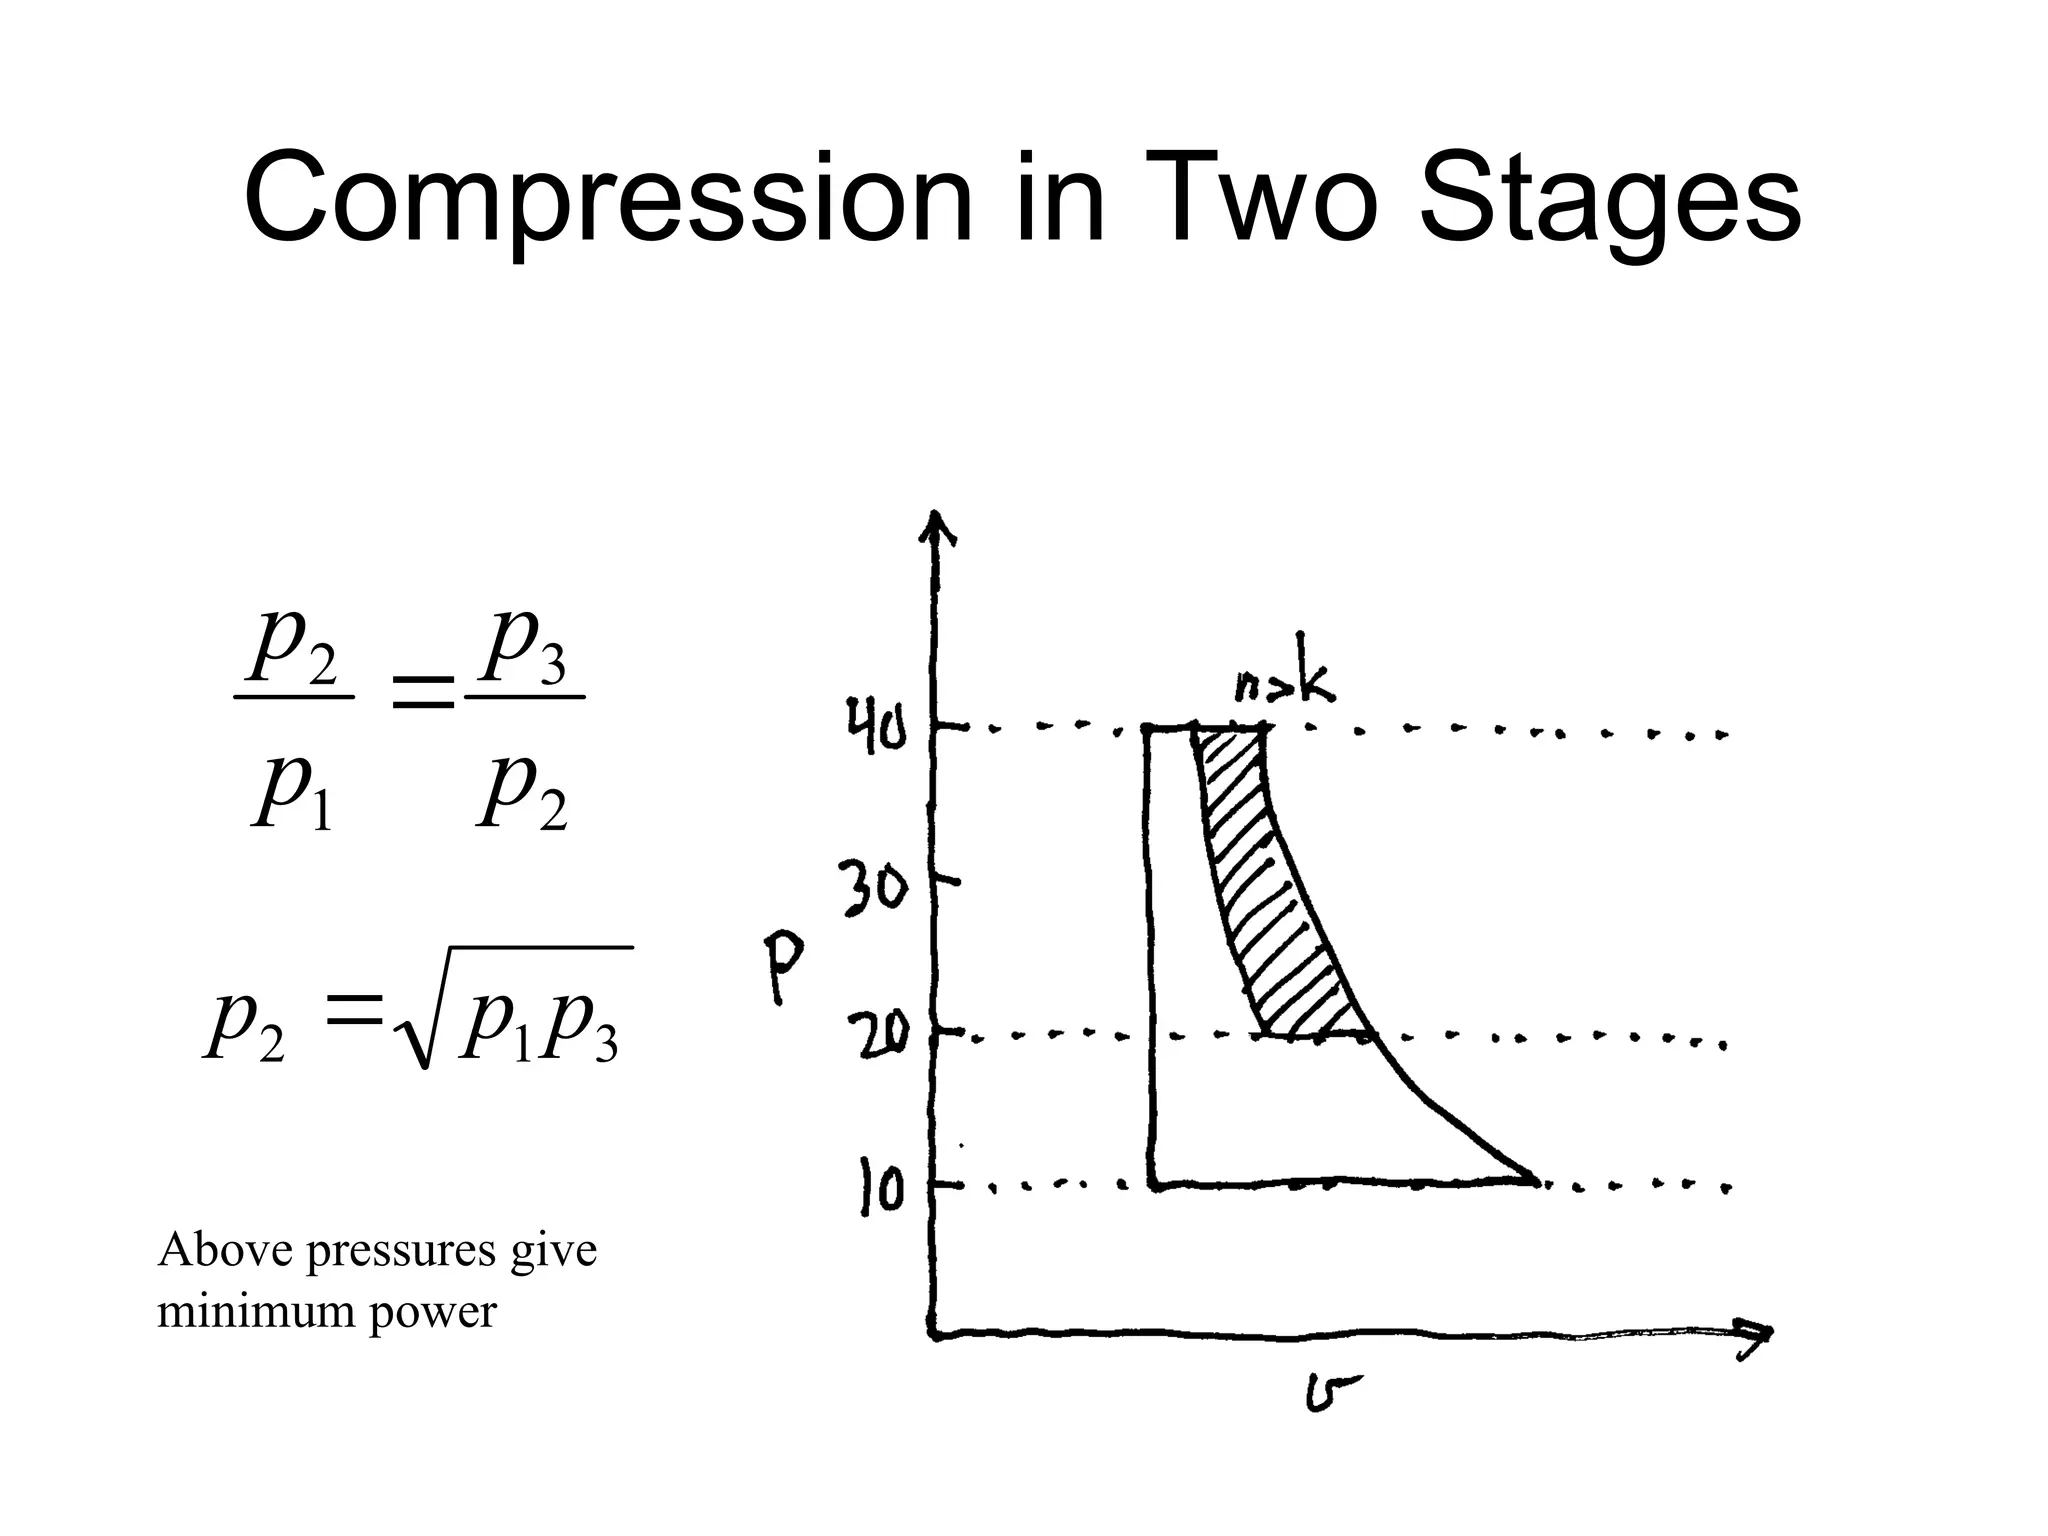
– Compression in stages with intercooling (minimum
power when equal power)
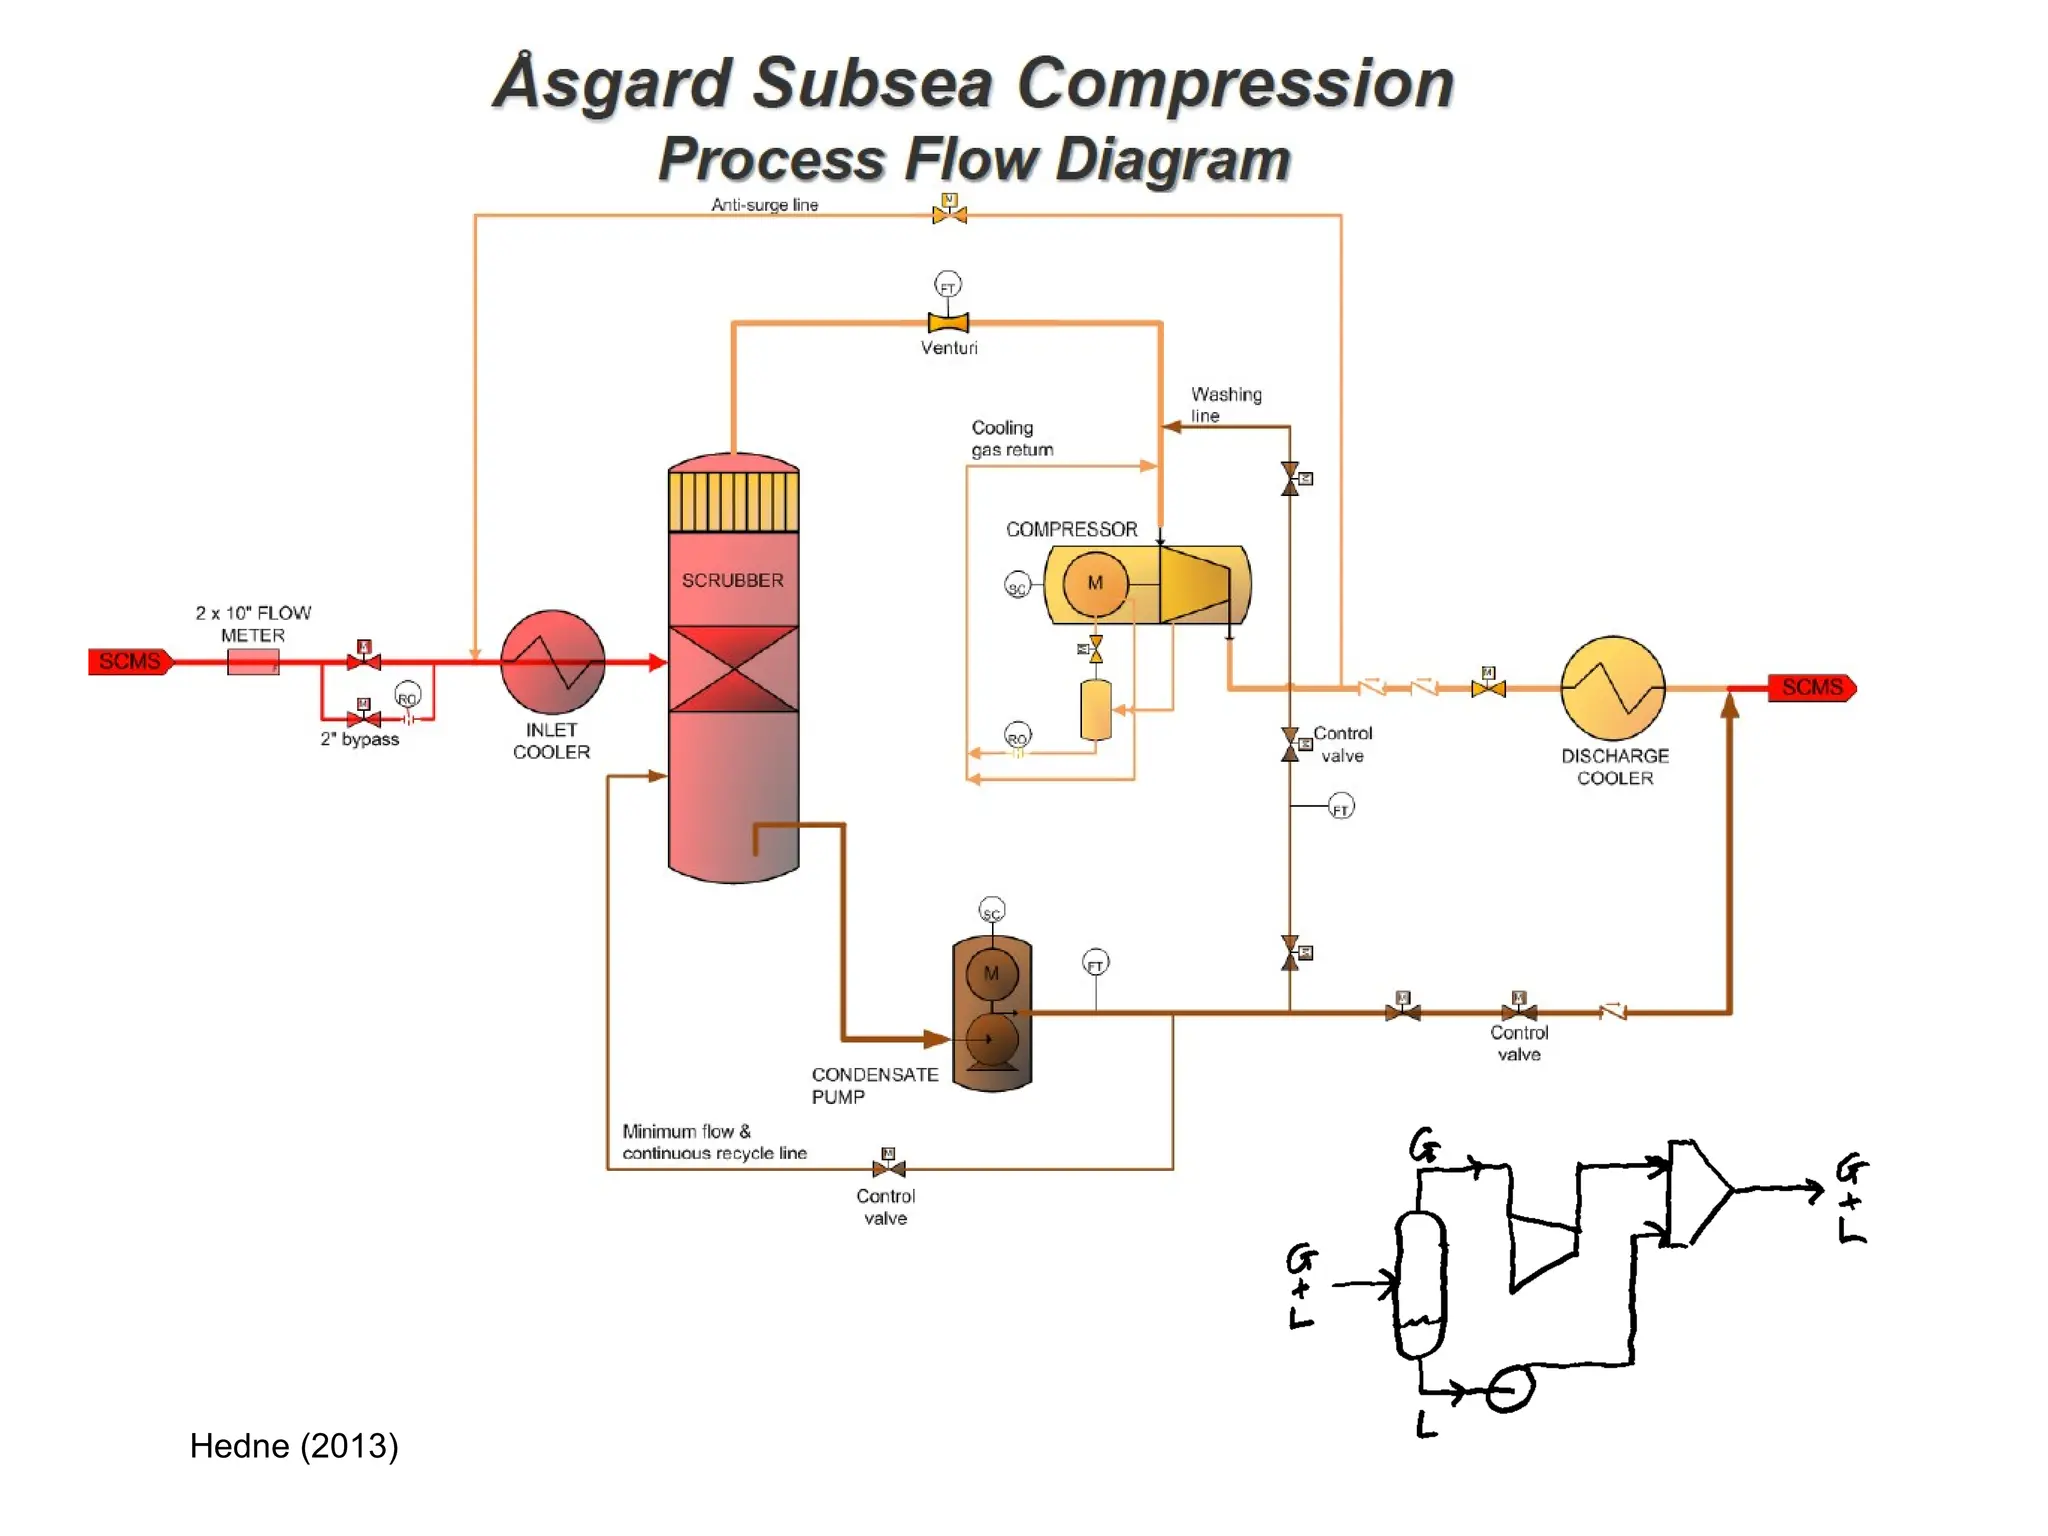
– Subsea compression

process of petroleum compression...1.ppt