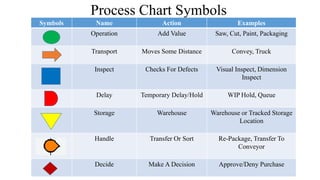
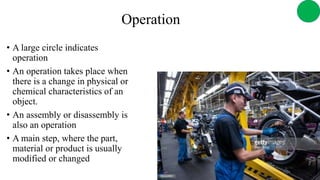
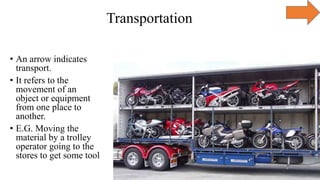
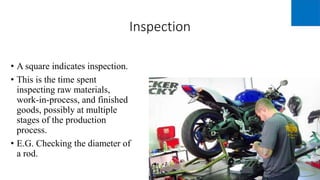
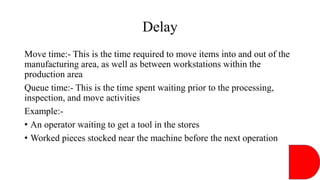
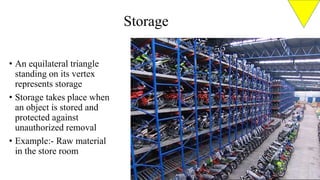
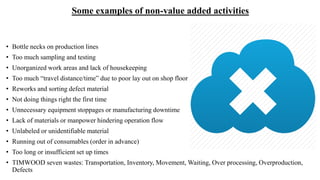
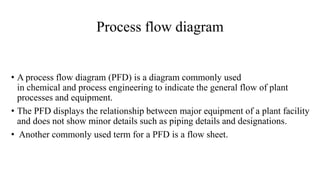
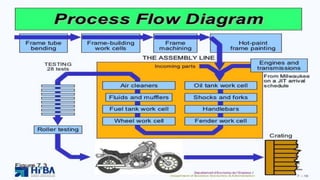
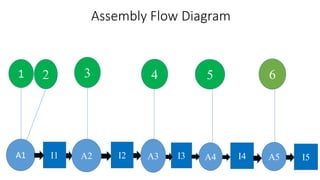
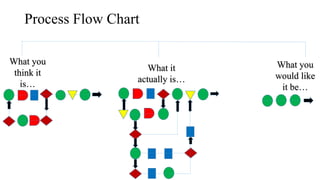
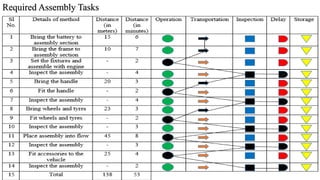
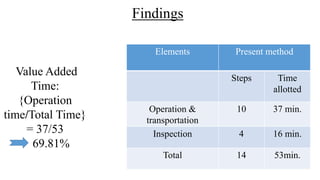
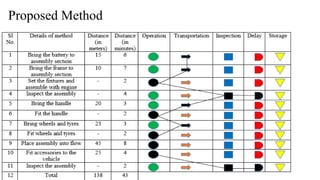
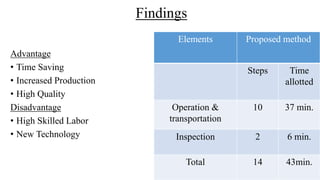
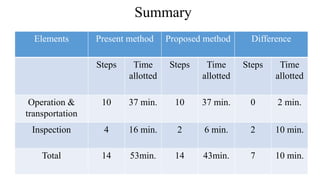
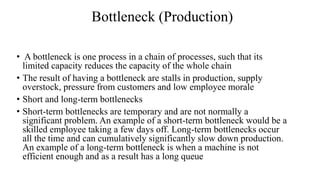
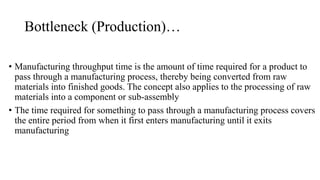
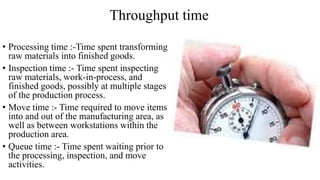
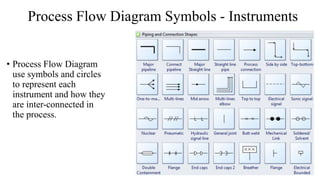
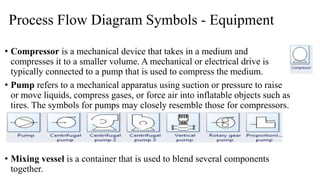
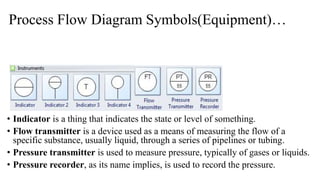
Made by:-
Parvesh Mittal
Process chart
• Graphical representation of the sequence of steps or tasks (workflow)
constituting a process, from raw materials through to the finished
product
• It serves as a tool for examining the process in detail to identify areas
of possible improvements
• Also known as process map
Process Chart Symbols
Symbols Name Action Examples
Operation Add Value Saw, Cut, Paint, Packaging
Transport Moves Some Distance Convey, Truck
Inspect Checks For Defects Visual Inspect, Dimension
Inspect
Delay Temporary Delay/Hold WIP Hold, Queue
Storage Warehouse Warehouse or Tracked Storage
Location
Handle Transfer Or Sort Re-Package, Transfer To
Conveyor
Decide Make A Decision Approve/Deny Purchase
Operation
• A large circle indicates
operation
• An operation takes place when
there is a change in physical or
chemical characteristics of an
object.
• An assembly or disassembly is
also an operation
• A main step, where the part,
material or product is usually
modified or changed
Transportation
• An arrow indicates
transport.
• It refers to the
movement of an
object or equipment
from one place to
another.
• E.G. Moving the
material by a trolley
operator going to the
stores to get some tool
Inspection
• A square indicates inspection.
• This is the time spent
inspecting raw materials,
work-in-process, and finished
goods, possibly at multiple
stages of the production
process.
• E.G. Checking the diameter of
a rod.
Delay
Move time:- This is the time required to move items into and out of the
manufacturing area, as well as between workstations within the
production area
Queue time:- This is the time spent waiting prior to the processing,
inspection, and move activities
Example:-
• An operator waiting to get a tool in the stores
• Worked pieces stocked near the machine before the next operation
Storage
• An equilateral triangle
standing on its vertex
represents storage
• Storage takes place when
an object is stored and
protected against
unauthorized removal
• Example:- Raw material
in the store room
VAA & NVA
• Value added activity
Providing worth or merit to an activity as defined by the customer. Activities
must be performed to meet customers CTQ’s. Actions are value added if the
customer cares, if something is physically changing for the best and you do the
step right the first time. Value added activities essentially change the product or
service and the customer is willing to pay for them.
• Non value added activity
No merit or worth to an activity as defined by the customer. The activity does
not need to be done to generate output. It does not add value to the service or
product. In essence it is something the customer is not willing to pay for. Non
value added activities forces us to be inefficient while generating output.
Some examples of non-value added activities
• Bottle necks on production lines
• Too much sampling and testing
• Unorganized work areas and lack of housekeeping
• Too much “travel distance/time” due to poor lay out on shop floor
• Reworks and sorting defect material
• Not doing things right the first time
• Unnecessary equipment stoppages or manufacturing downtime
• Lack of materials or manpower hindering operation flow
• Unlabeled or unidentifiable material
• Running out of consumables (order in advance)
• Too long or insufficient set up times
• TIMWOOD seven wastes: Transportation, Inventory, Movement, Waiting, Over processing, Overproduction,
Defects
Process flow diagram
• A process flow diagram (PFD) is a diagram commonly used
in chemical and process engineering to indicate the general flow of plant
processes and equipment.
• The PFD displays the relationship between major equipment of a plant facility
and does not show minor details such as piping details and designations.
• Another commonly used term for a PFD is a flow sheet.
Assembly Flow Diagram
1 3
A1 A5
5
A4
62 4
I1 I4 I5I3A3A2 I2
When to use it
• It is used when observing a physical process, to record actions as they happen
and thus get an accurate description of the process.
• It is used when analyzing the steps in a process, to help identify and
eliminate waste - thus, it is a phenomenal tool when it comes to efficiency
planning.
• It is used when the process is mostly sequential, containing few decisions.
Process Flow Chart
What you
think it
is…
What it
actually is…
What you
would like
it be…
Required Assembly Tasks
Findings
Elements Present method
Steps Time
allotted
Operation &
transportation
10 37 min.
Inspection 4 16 min.
Total 14 53min.
Value Added
Time:
{Operation
time/Total Time}
= 37/53
69.81%
Inbound Logistics
• We are using vertical integration of supply chain.
• We have merged with our suppliers and fixed a quality standard for
our product.
• We are in contract with our suppliers that if the product delivered is
not of the quality which we have selected whole consignment will be
refused.
• We have got our raw material insured so that if they are damaged/ lost
in transit we will have protection against the loss.
Inbound Logistics…
• We have integrated automatic ordering and order fulfillment systems
in our assembly lines so that delay times can be reduced so our
production line continues to operate with any not haul.
• We are using our own fleet to bring raw materials from suppliers.
• We stocking our raw materials in our store so that in case of more
demand of them we can procure from there.
Outbound Logistics
• We have divide North, south, Central, east, west Side. As North Zone,
South Zone, Central Zone, East Zone, West Zone.
• We have our offices/ storage facilities in all the 5 zones, and our
branch office in the main cities of all the states.
• We use air, road transport for outbound logistics.
Proposed Method
Findings
Elements Proposed method
Steps Time
allotted
Operation &
transportation
10 37 min.
Inspection 2 6 min.
Total 14 43min.
Advantage
• Time Saving
• Increased Production
• High Quality
Disadvantage
• High Skilled Labor
• New Technology
Summary
Elements Present method Proposed method Difference
Steps Time
allotted
Steps Time
allotted
Steps Time
allotted
Operation &
transportation
10 37 min. 10 37 min. 0 2 min.
Inspection 4 16 min. 2 6 min. 2 10 min.
Total 14 53min. 14 43min. 7 10 min.
Bottleneck (Production)
• A bottleneck is one process in a chain of processes, such that its
limited capacity reduces the capacity of the whole chain
• The result of having a bottleneck are stalls in production, supply
overstock, pressure from customers and low employee morale
• Short and long-term bottlenecks
• Short-term bottlenecks are temporary and are not normally a
significant problem. An example of a short-term bottleneck would be a
skilled employee taking a few days off. Long-term bottlenecks occur
all the time and can cumulatively significantly slow down production.
An example of a long-term bottleneck is when a machine is not
efficient enough and as a result has a long queue
Bottleneck (Production)…
• Manufacturing throughput time is the amount of time required for a product to
pass through a manufacturing process, thereby being converted from raw
materials into finished goods. The concept also applies to the processing of raw
materials into a component or sub-assembly
• The time required for something to pass through a manufacturing process covers
the entire period from when it first enters manufacturing until it exits
manufacturing
Throughput time
• Processing time :-Time spent transforming
raw materials into finished goods.
• Inspection time :- Time spent inspecting
raw materials, work-in-process, and
finished goods, possibly at multiple stages
of the production process.
• Move time :- Time required to move items
into and out of the manufacturing area, as
well as between workstations within the
production area.
• Queue time :- Time spent waiting prior to
the processing, inspection, and move
activities.
Process Flow Diagram Symbols - Instruments
• Process Flow Diagram
use symbols and circles
to represent each
instrument and how they
are inter-connected in
the process.
Process Flow Diagram Symbols - Equipment
• Compressor is a mechanical device that takes in a medium and
compresses it to a smaller volume. A mechanical or electrical drive is
typically connected to a pump that is used to compress the medium.
• Pump refers to a mechanical apparatus using suction or pressure to raise
or move liquids, compress gases, or force air into inflatable objects such as
tires. The symbols for pumps may closely resemble those for compressors.
• Mixing vessel is a container that is used to blend several components
together.
• Indicator is a thing that indicates the state or level of something.
• Flow transmitter is a device used as a means of measuring the flow of a
specific substance, usually liquid, through a series of pipelines or tubing.
• Pressure transmitter is used to measure pressure, typically of gases or liquids.
• Pressure recorder, as its name implies, is used to record the pressure.
Process Flow Diagram Symbols(Equipment)…

Process flow and process chart

  • 1.
  • 2.
    Process chart • Graphicalrepresentation of the sequence of steps or tasks (workflow) constituting a process, from raw materials through to the finished product • It serves as a tool for examining the process in detail to identify areas of possible improvements • Also known as process map
  • 3.
    Process Chart Symbols SymbolsName Action Examples Operation Add Value Saw, Cut, Paint, Packaging Transport Moves Some Distance Convey, Truck Inspect Checks For Defects Visual Inspect, Dimension Inspect Delay Temporary Delay/Hold WIP Hold, Queue Storage Warehouse Warehouse or Tracked Storage Location Handle Transfer Or Sort Re-Package, Transfer To Conveyor Decide Make A Decision Approve/Deny Purchase
  • 4.
    Operation • A largecircle indicates operation • An operation takes place when there is a change in physical or chemical characteristics of an object. • An assembly or disassembly is also an operation • A main step, where the part, material or product is usually modified or changed
  • 5.
    Transportation • An arrowindicates transport. • It refers to the movement of an object or equipment from one place to another. • E.G. Moving the material by a trolley operator going to the stores to get some tool
  • 6.
    Inspection • A squareindicates inspection. • This is the time spent inspecting raw materials, work-in-process, and finished goods, possibly at multiple stages of the production process. • E.G. Checking the diameter of a rod.
  • 7.
    Delay Move time:- Thisis the time required to move items into and out of the manufacturing area, as well as between workstations within the production area Queue time:- This is the time spent waiting prior to the processing, inspection, and move activities Example:- • An operator waiting to get a tool in the stores • Worked pieces stocked near the machine before the next operation
  • 8.
    Storage • An equilateraltriangle standing on its vertex represents storage • Storage takes place when an object is stored and protected against unauthorized removal • Example:- Raw material in the store room
  • 9.
    VAA & NVA •Value added activity Providing worth or merit to an activity as defined by the customer. Activities must be performed to meet customers CTQ’s. Actions are value added if the customer cares, if something is physically changing for the best and you do the step right the first time. Value added activities essentially change the product or service and the customer is willing to pay for them. • Non value added activity No merit or worth to an activity as defined by the customer. The activity does not need to be done to generate output. It does not add value to the service or product. In essence it is something the customer is not willing to pay for. Non value added activities forces us to be inefficient while generating output.
  • 10.
    Some examples ofnon-value added activities • Bottle necks on production lines • Too much sampling and testing • Unorganized work areas and lack of housekeeping • Too much “travel distance/time” due to poor lay out on shop floor • Reworks and sorting defect material • Not doing things right the first time • Unnecessary equipment stoppages or manufacturing downtime • Lack of materials or manpower hindering operation flow • Unlabeled or unidentifiable material • Running out of consumables (order in advance) • Too long or insufficient set up times • TIMWOOD seven wastes: Transportation, Inventory, Movement, Waiting, Over processing, Overproduction, Defects
  • 11.
    Process flow diagram •A process flow diagram (PFD) is a diagram commonly used in chemical and process engineering to indicate the general flow of plant processes and equipment. • The PFD displays the relationship between major equipment of a plant facility and does not show minor details such as piping details and designations. • Another commonly used term for a PFD is a flow sheet.
  • 13.
    Assembly Flow Diagram 13 A1 A5 5 A4 62 4 I1 I4 I5I3A3A2 I2
  • 14.
    When to useit • It is used when observing a physical process, to record actions as they happen and thus get an accurate description of the process. • It is used when analyzing the steps in a process, to help identify and eliminate waste - thus, it is a phenomenal tool when it comes to efficiency planning. • It is used when the process is mostly sequential, containing few decisions.
  • 15.
    Process Flow Chart Whatyou think it is… What it actually is… What you would like it be…
  • 16.
  • 17.
    Findings Elements Present method StepsTime allotted Operation & transportation 10 37 min. Inspection 4 16 min. Total 14 53min. Value Added Time: {Operation time/Total Time} = 37/53 69.81%
  • 18.
    Inbound Logistics • Weare using vertical integration of supply chain. • We have merged with our suppliers and fixed a quality standard for our product. • We are in contract with our suppliers that if the product delivered is not of the quality which we have selected whole consignment will be refused. • We have got our raw material insured so that if they are damaged/ lost in transit we will have protection against the loss.
  • 19.
    Inbound Logistics… • Wehave integrated automatic ordering and order fulfillment systems in our assembly lines so that delay times can be reduced so our production line continues to operate with any not haul. • We are using our own fleet to bring raw materials from suppliers. • We stocking our raw materials in our store so that in case of more demand of them we can procure from there.
  • 20.
    Outbound Logistics • Wehave divide North, south, Central, east, west Side. As North Zone, South Zone, Central Zone, East Zone, West Zone. • We have our offices/ storage facilities in all the 5 zones, and our branch office in the main cities of all the states. • We use air, road transport for outbound logistics.
  • 21.
  • 22.
    Findings Elements Proposed method StepsTime allotted Operation & transportation 10 37 min. Inspection 2 6 min. Total 14 43min. Advantage • Time Saving • Increased Production • High Quality Disadvantage • High Skilled Labor • New Technology
  • 23.
    Summary Elements Present methodProposed method Difference Steps Time allotted Steps Time allotted Steps Time allotted Operation & transportation 10 37 min. 10 37 min. 0 2 min. Inspection 4 16 min. 2 6 min. 2 10 min. Total 14 53min. 14 43min. 7 10 min.
  • 24.
    Bottleneck (Production) • Abottleneck is one process in a chain of processes, such that its limited capacity reduces the capacity of the whole chain • The result of having a bottleneck are stalls in production, supply overstock, pressure from customers and low employee morale • Short and long-term bottlenecks • Short-term bottlenecks are temporary and are not normally a significant problem. An example of a short-term bottleneck would be a skilled employee taking a few days off. Long-term bottlenecks occur all the time and can cumulatively significantly slow down production. An example of a long-term bottleneck is when a machine is not efficient enough and as a result has a long queue
  • 25.
    Bottleneck (Production)… • Manufacturingthroughput time is the amount of time required for a product to pass through a manufacturing process, thereby being converted from raw materials into finished goods. The concept also applies to the processing of raw materials into a component or sub-assembly • The time required for something to pass through a manufacturing process covers the entire period from when it first enters manufacturing until it exits manufacturing
  • 26.
    Throughput time • Processingtime :-Time spent transforming raw materials into finished goods. • Inspection time :- Time spent inspecting raw materials, work-in-process, and finished goods, possibly at multiple stages of the production process. • Move time :- Time required to move items into and out of the manufacturing area, as well as between workstations within the production area. • Queue time :- Time spent waiting prior to the processing, inspection, and move activities.
  • 27.
    Process Flow DiagramSymbols - Instruments • Process Flow Diagram use symbols and circles to represent each instrument and how they are inter-connected in the process.
  • 28.
    Process Flow DiagramSymbols - Equipment • Compressor is a mechanical device that takes in a medium and compresses it to a smaller volume. A mechanical or electrical drive is typically connected to a pump that is used to compress the medium. • Pump refers to a mechanical apparatus using suction or pressure to raise or move liquids, compress gases, or force air into inflatable objects such as tires. The symbols for pumps may closely resemble those for compressors. • Mixing vessel is a container that is used to blend several components together.
  • 29.
    • Indicator isa thing that indicates the state or level of something. • Flow transmitter is a device used as a means of measuring the flow of a specific substance, usually liquid, through a series of pipelines or tubing. • Pressure transmitter is used to measure pressure, typically of gases or liquids. • Pressure recorder, as its name implies, is used to record the pressure. Process Flow Diagram Symbols(Equipment)…