Download as PDF, PPTX

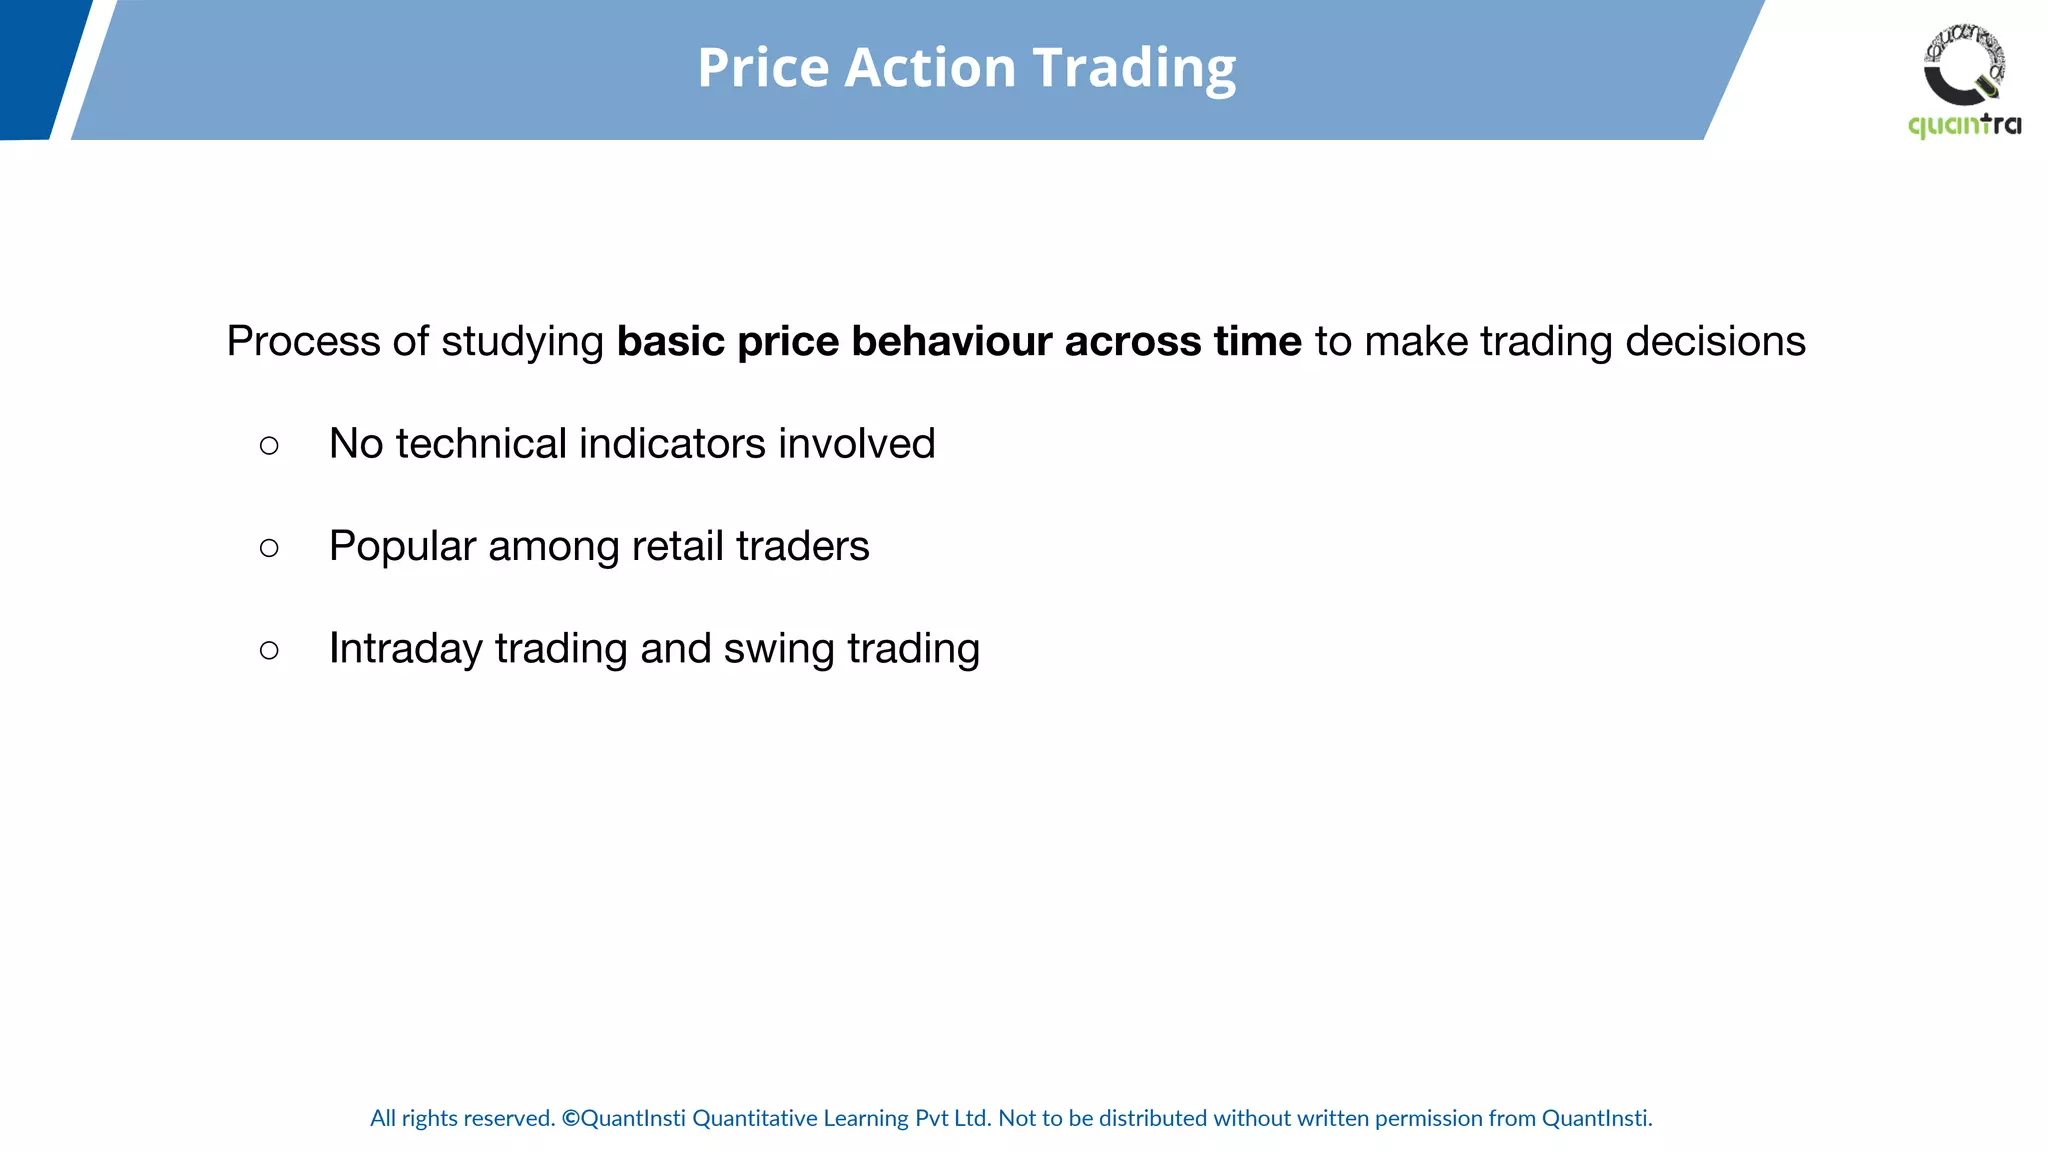

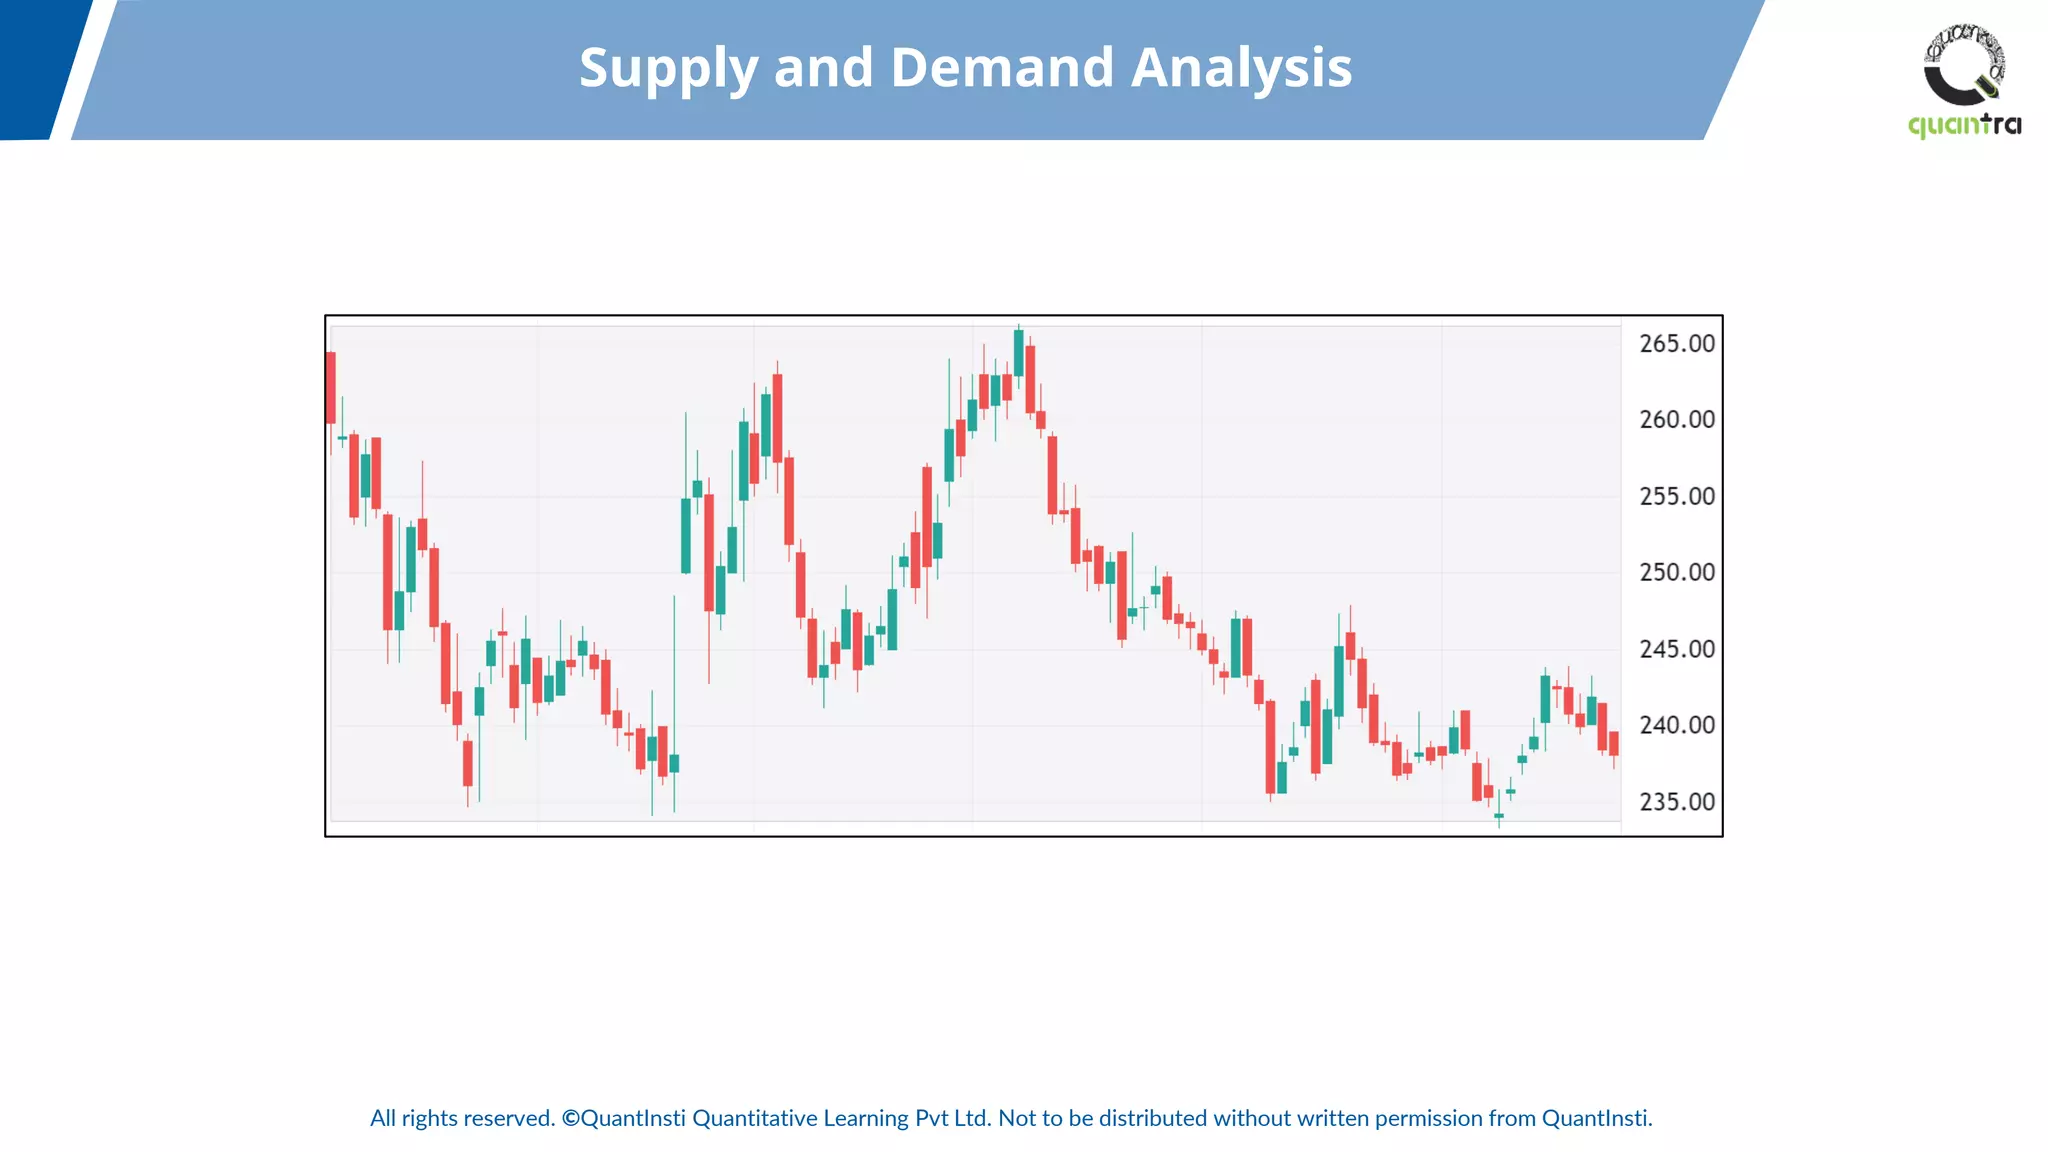
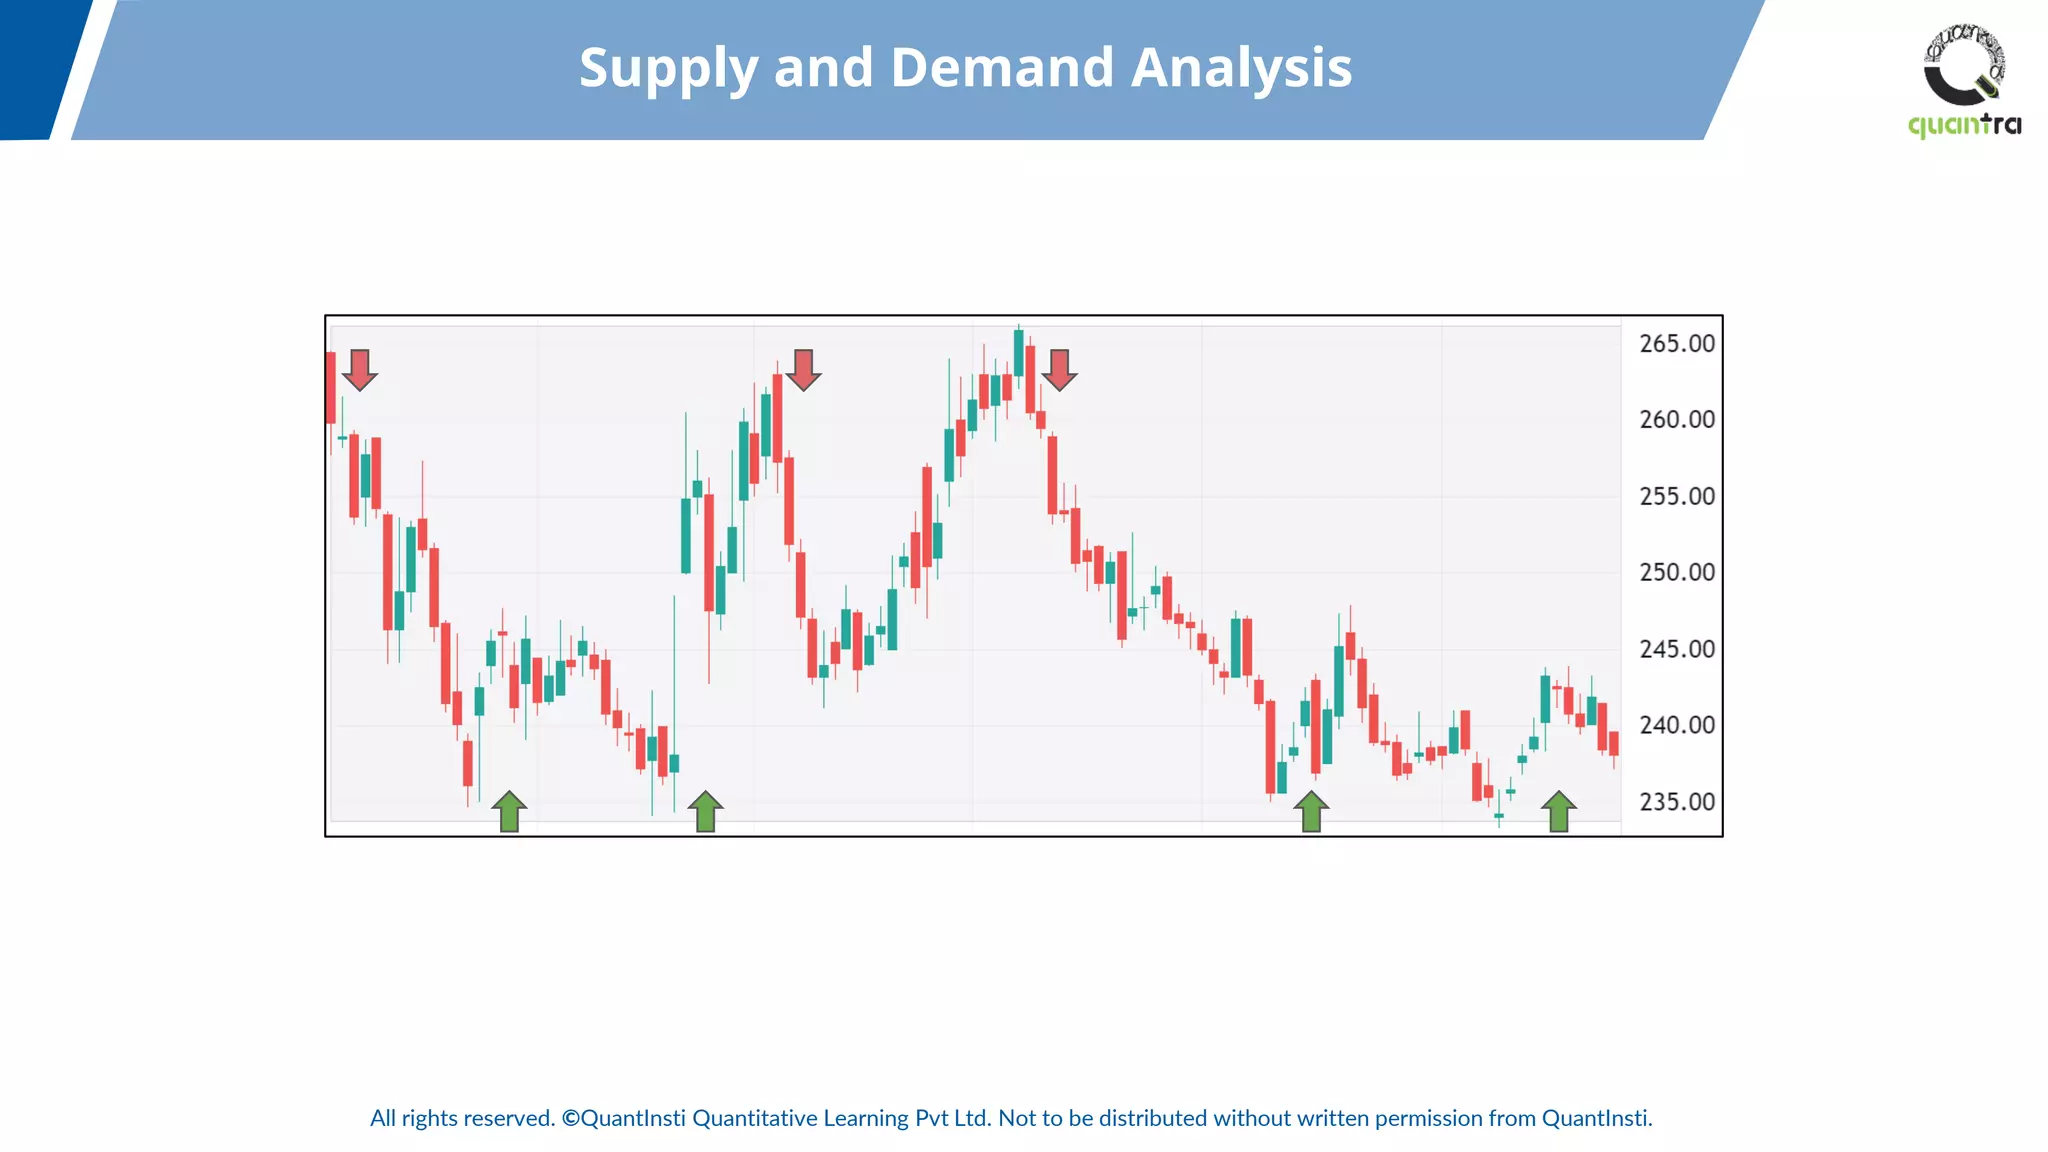
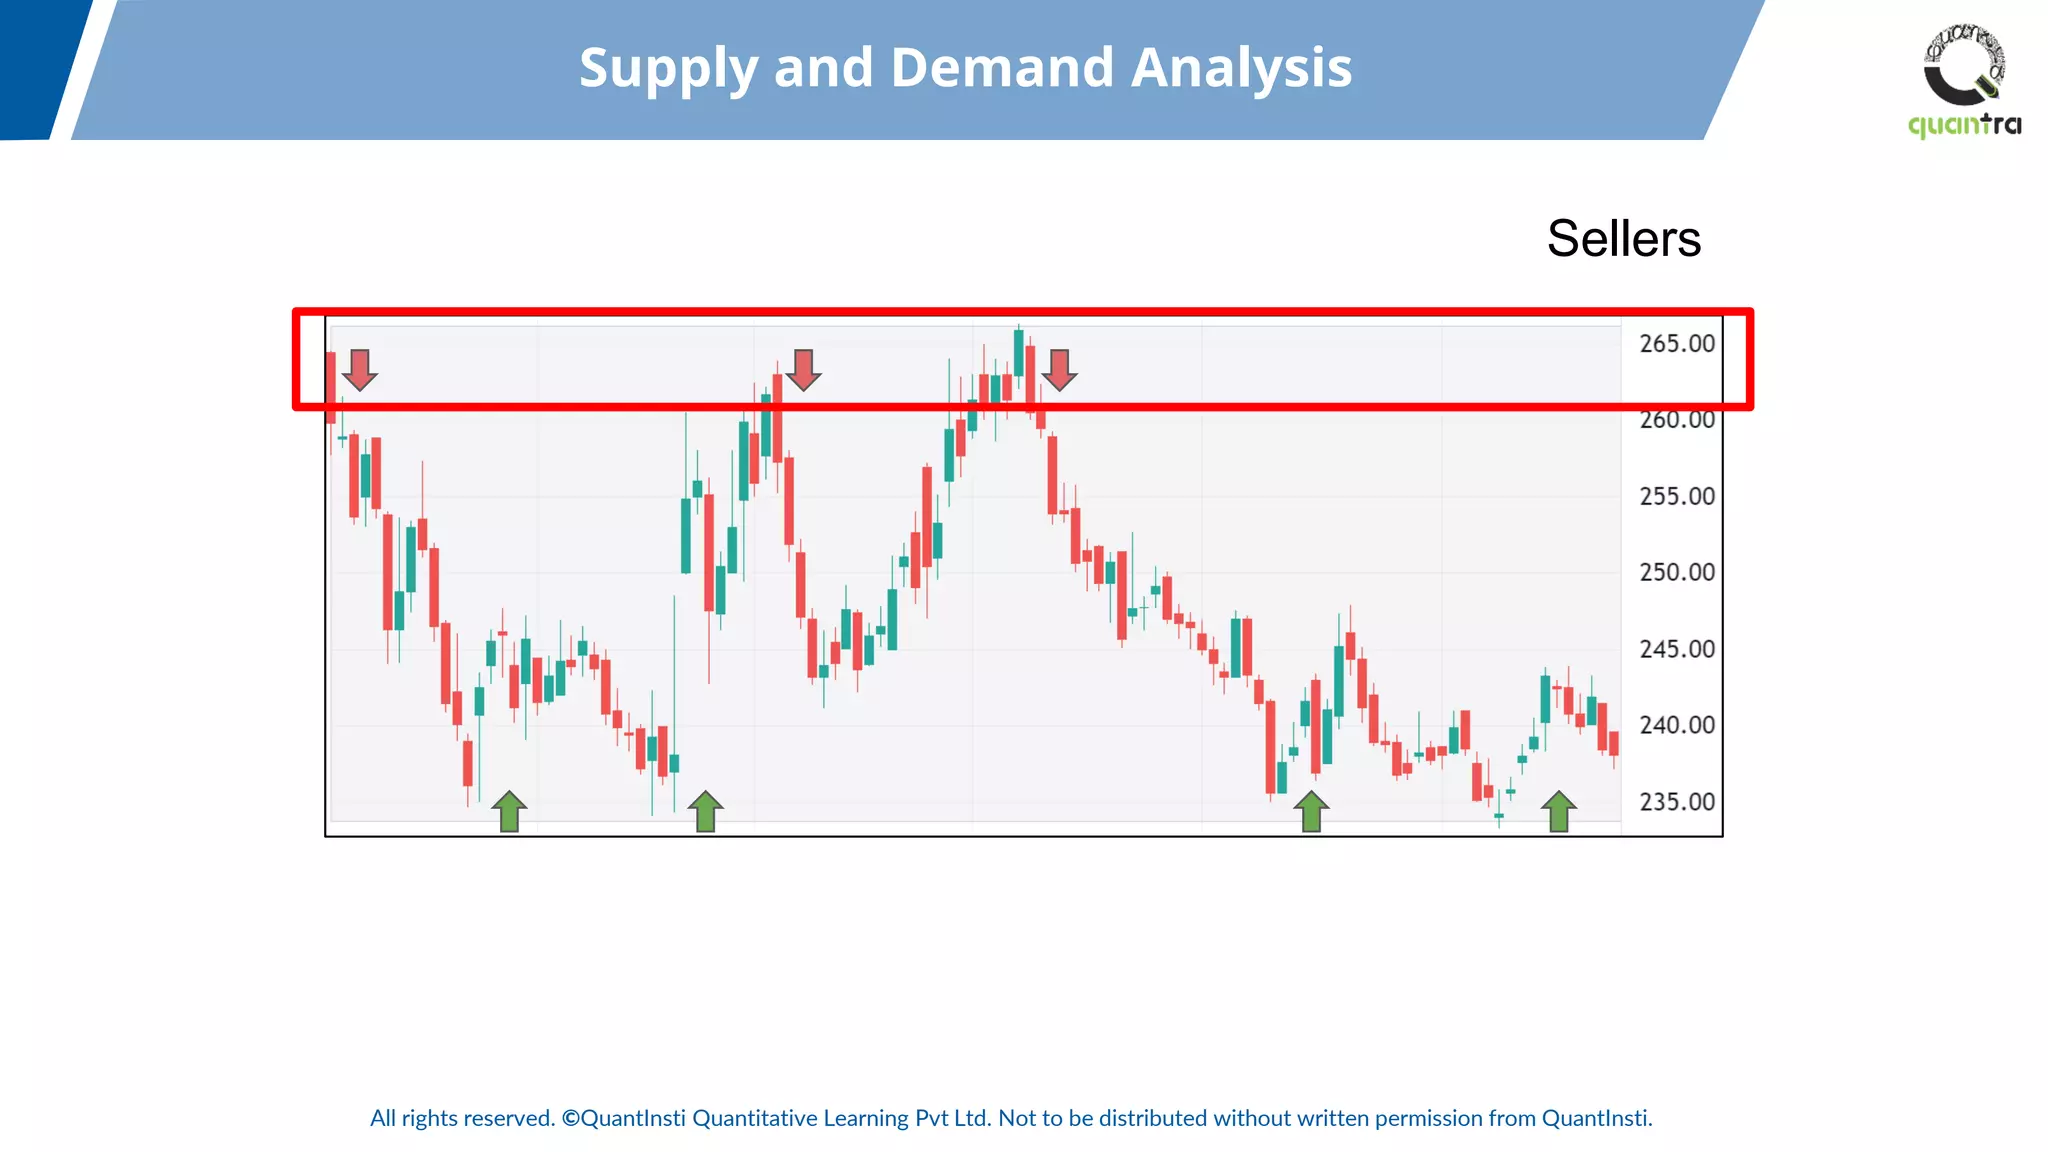
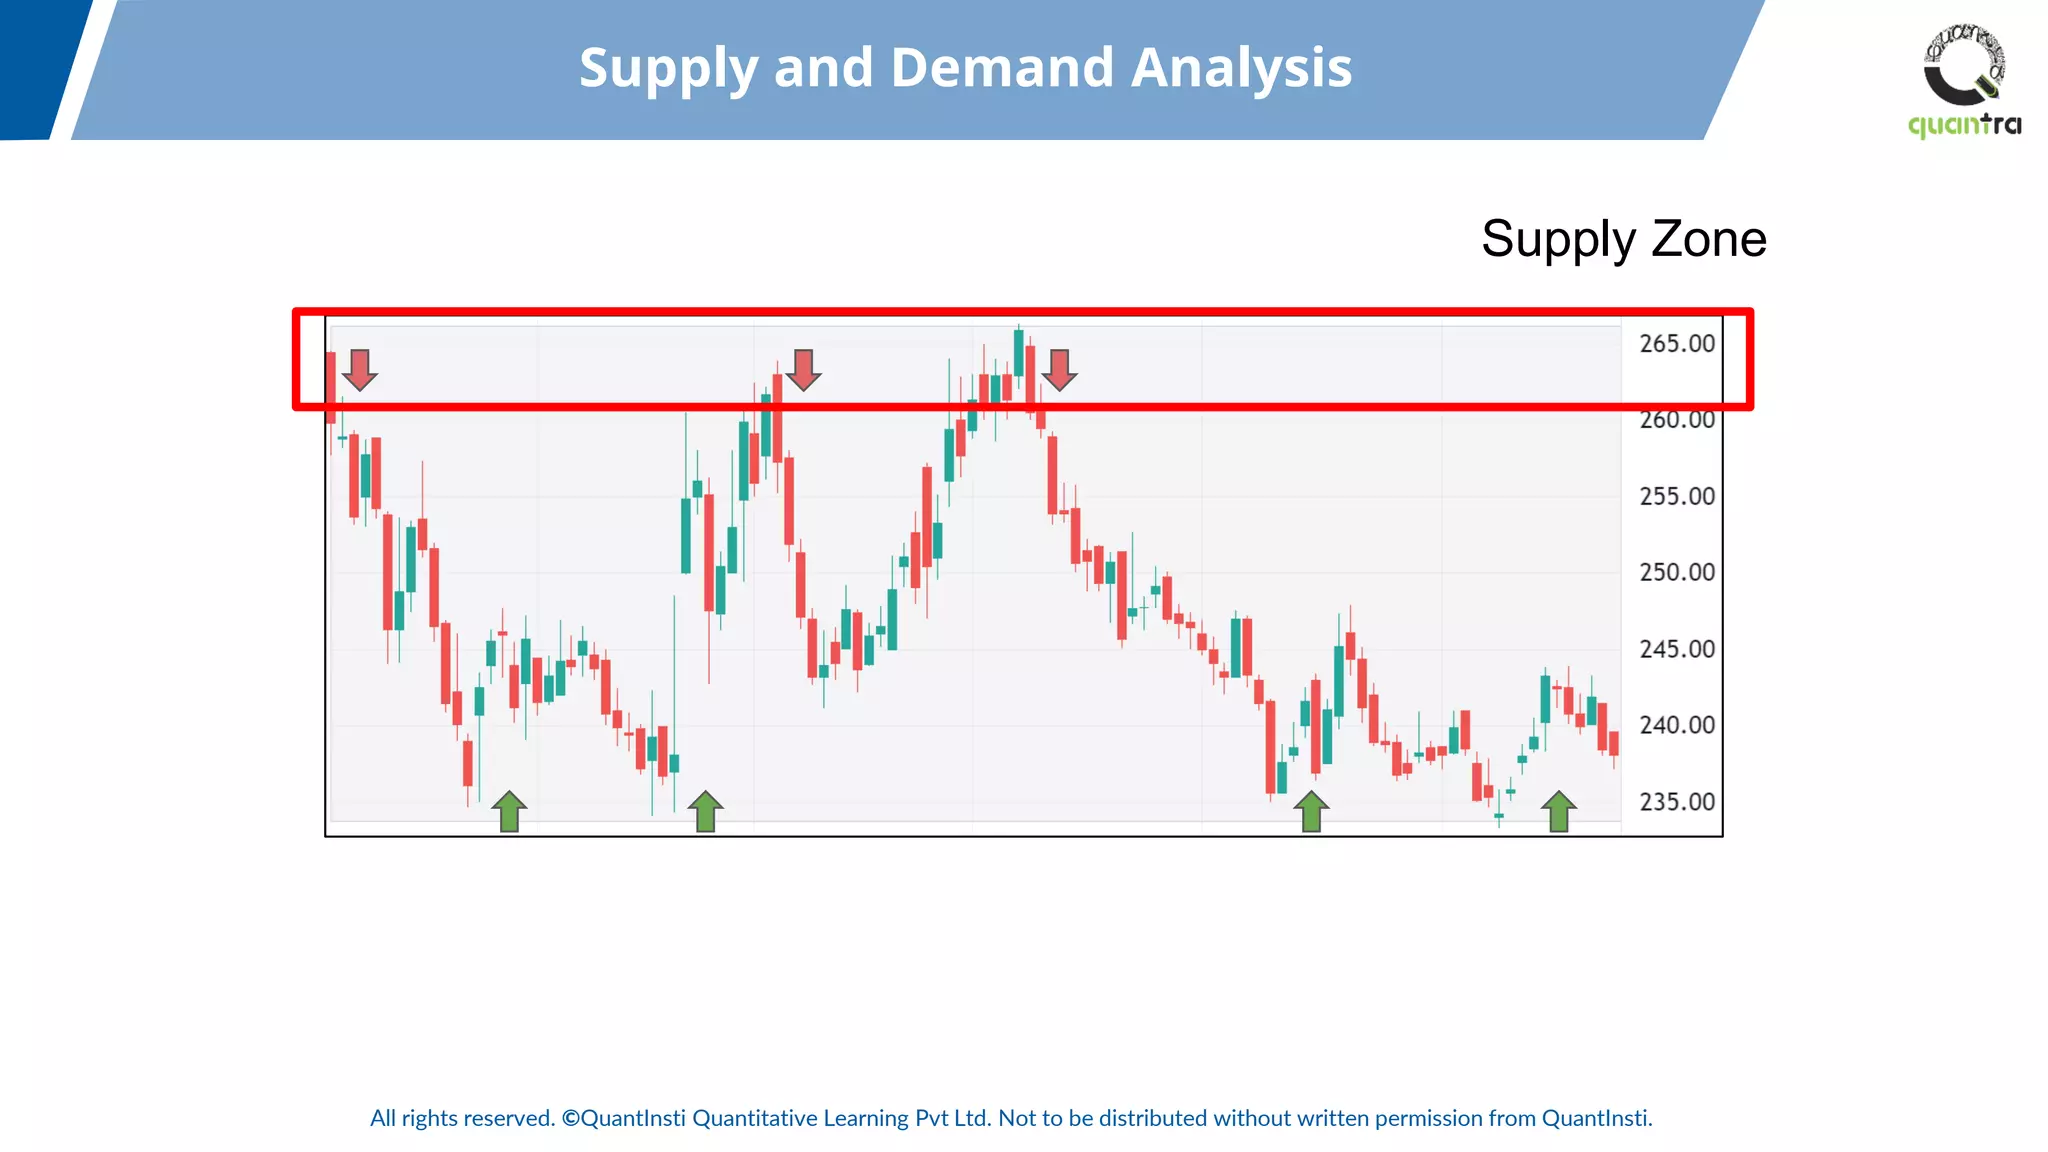
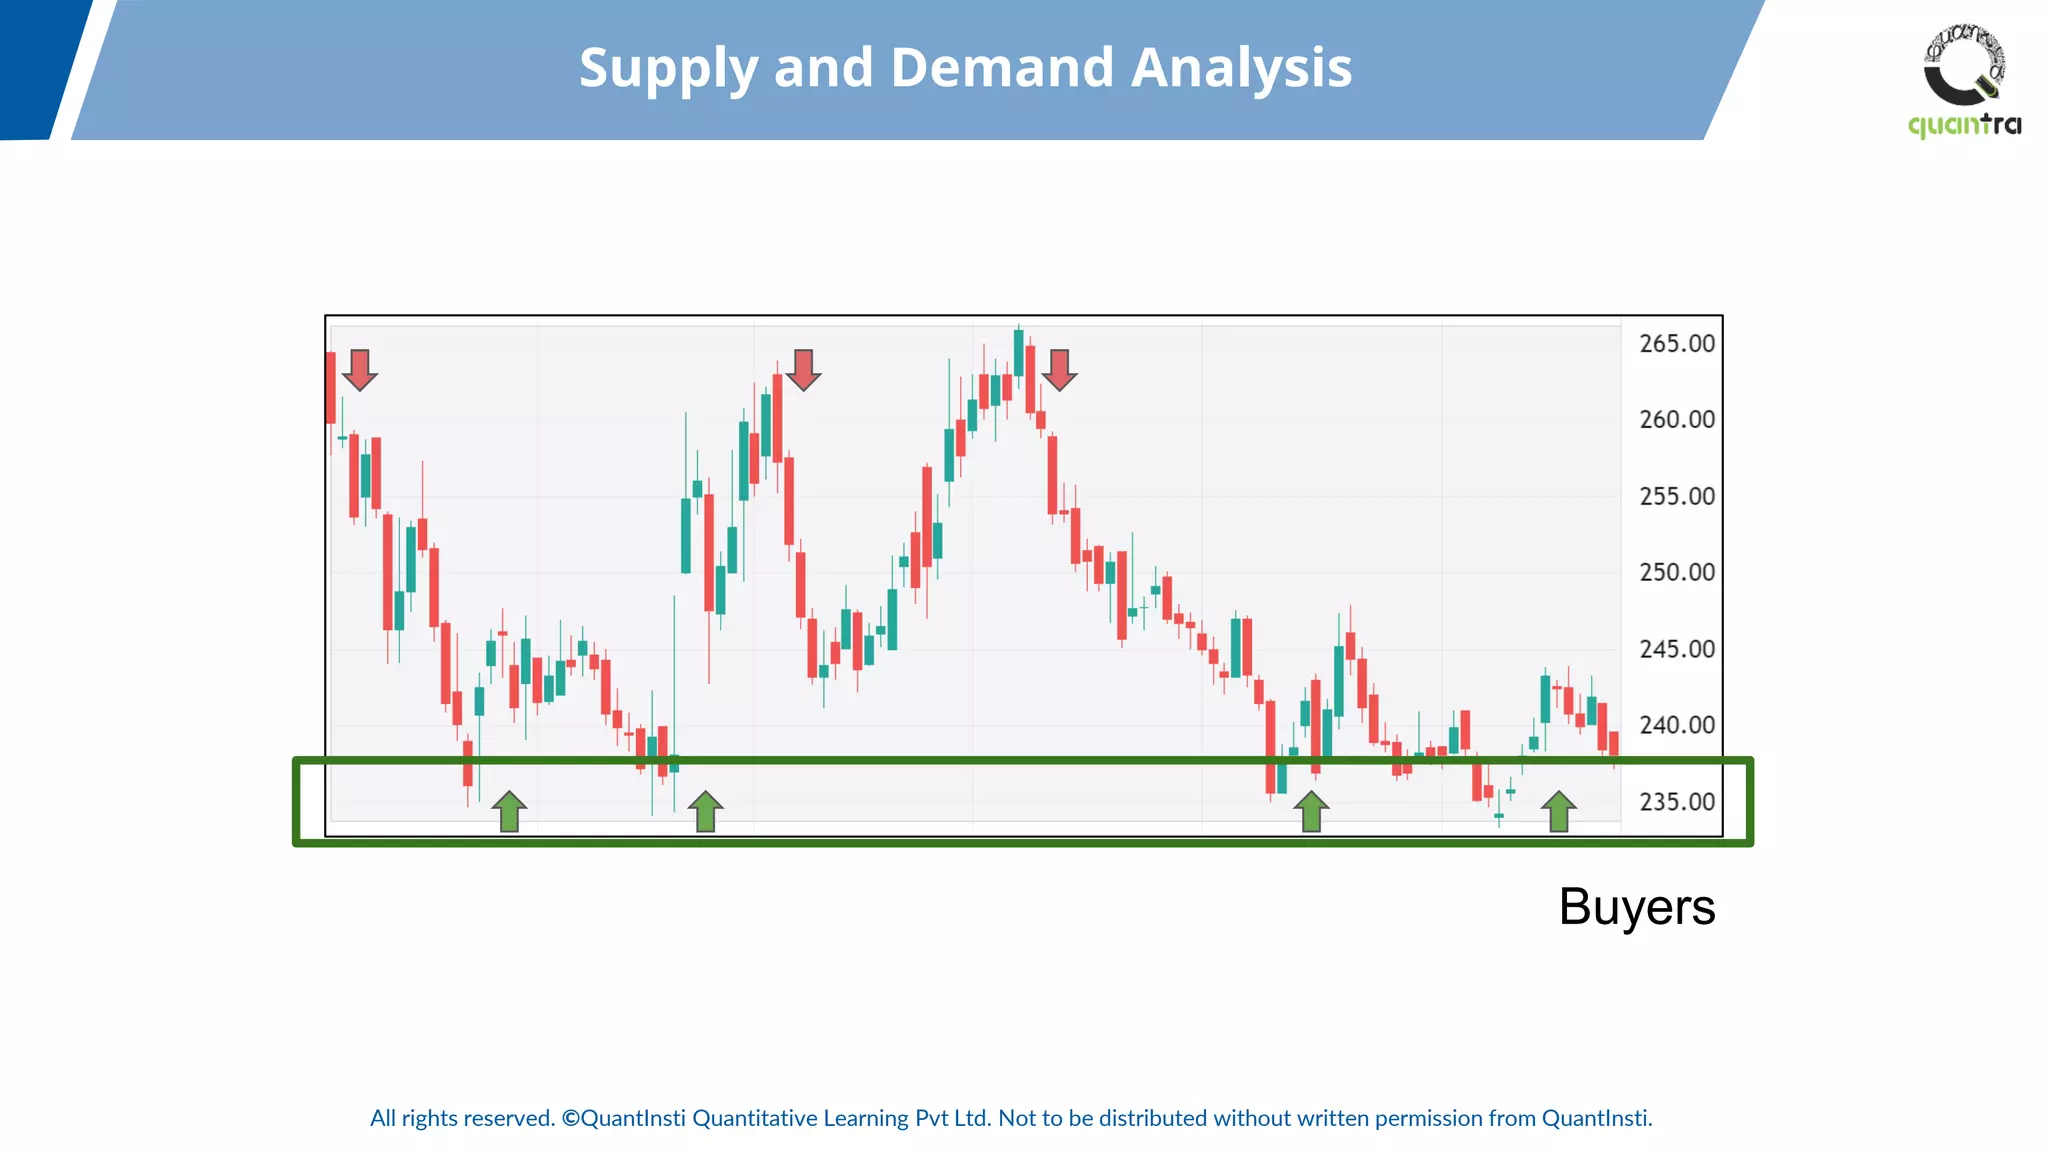
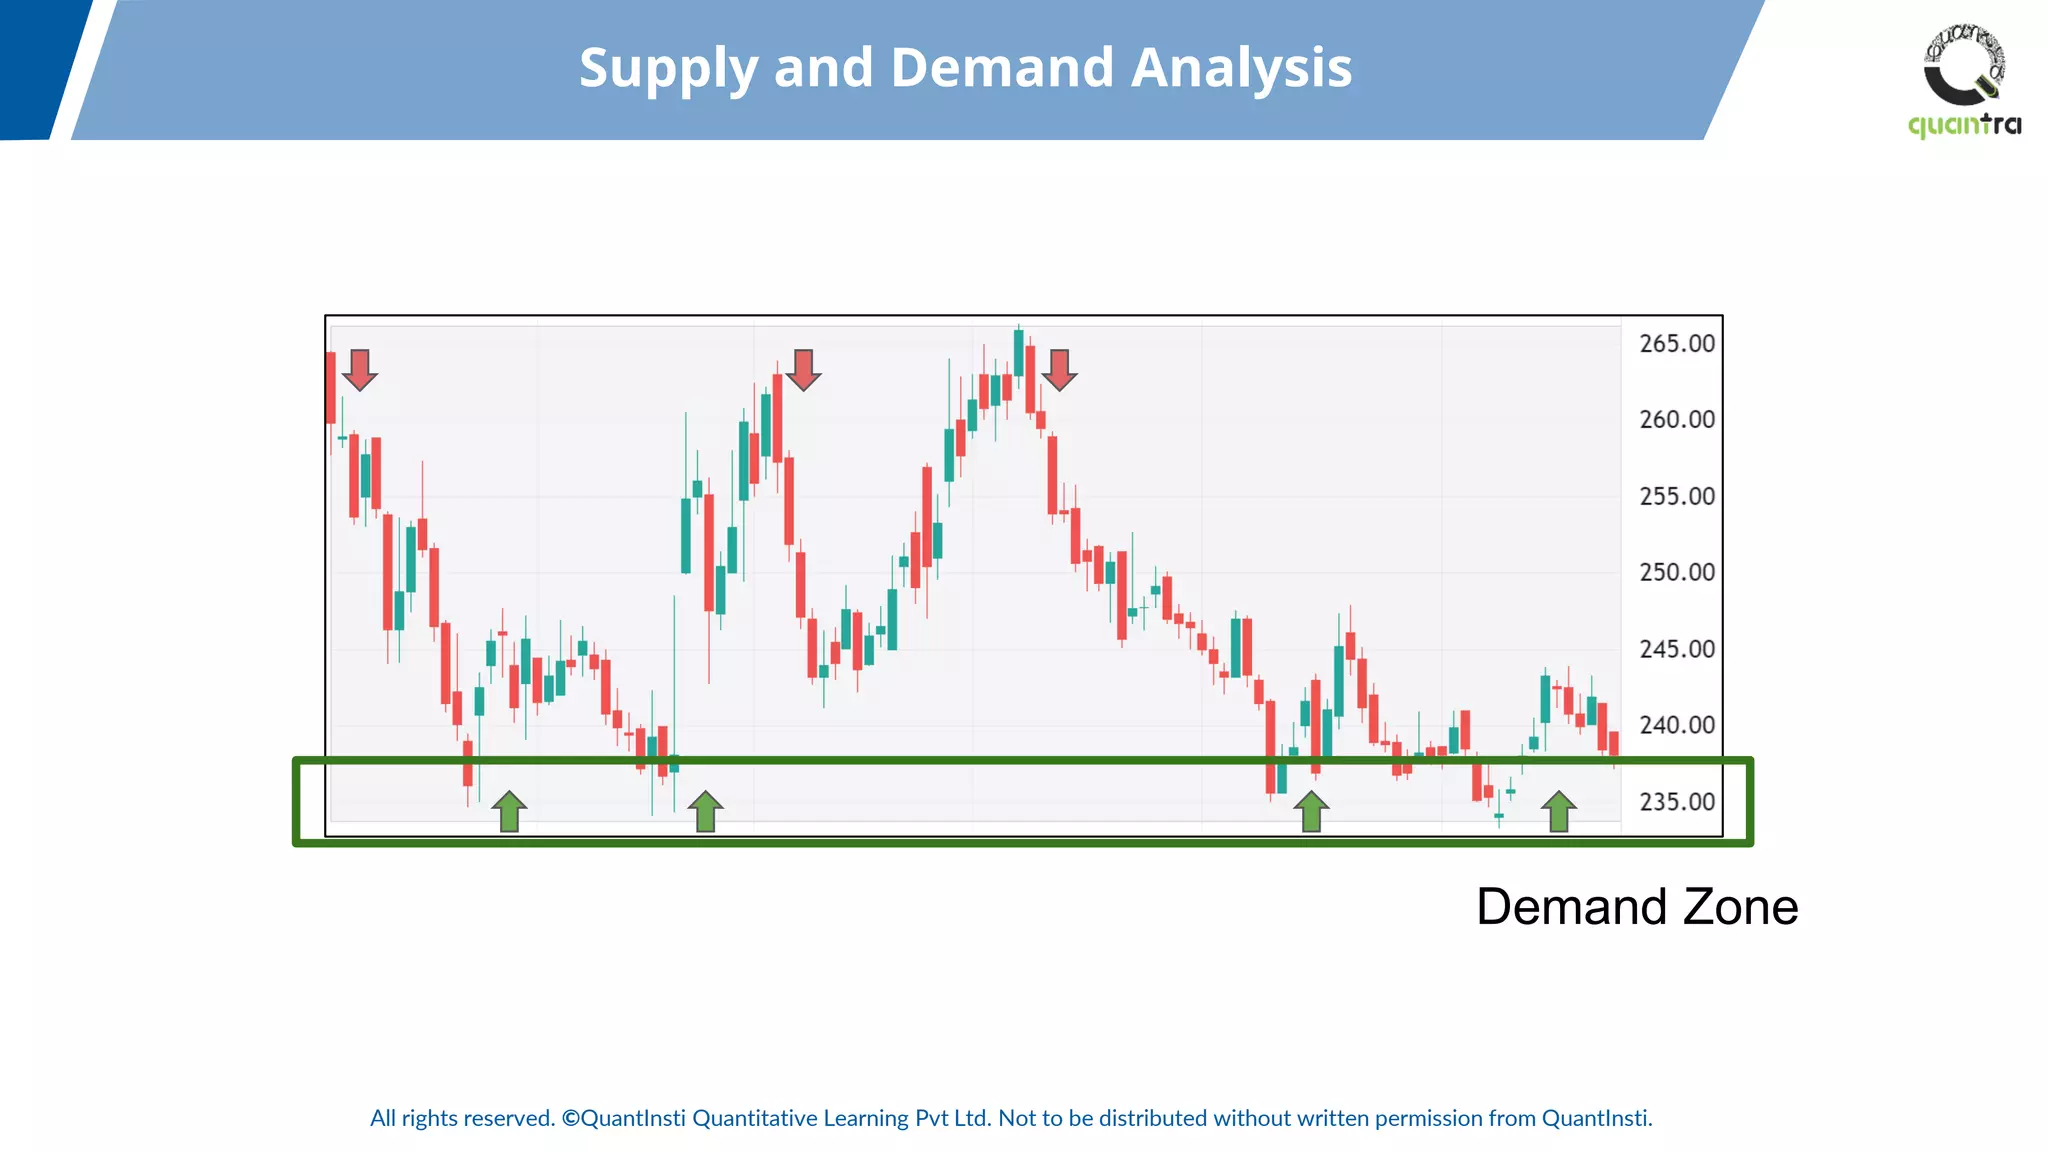
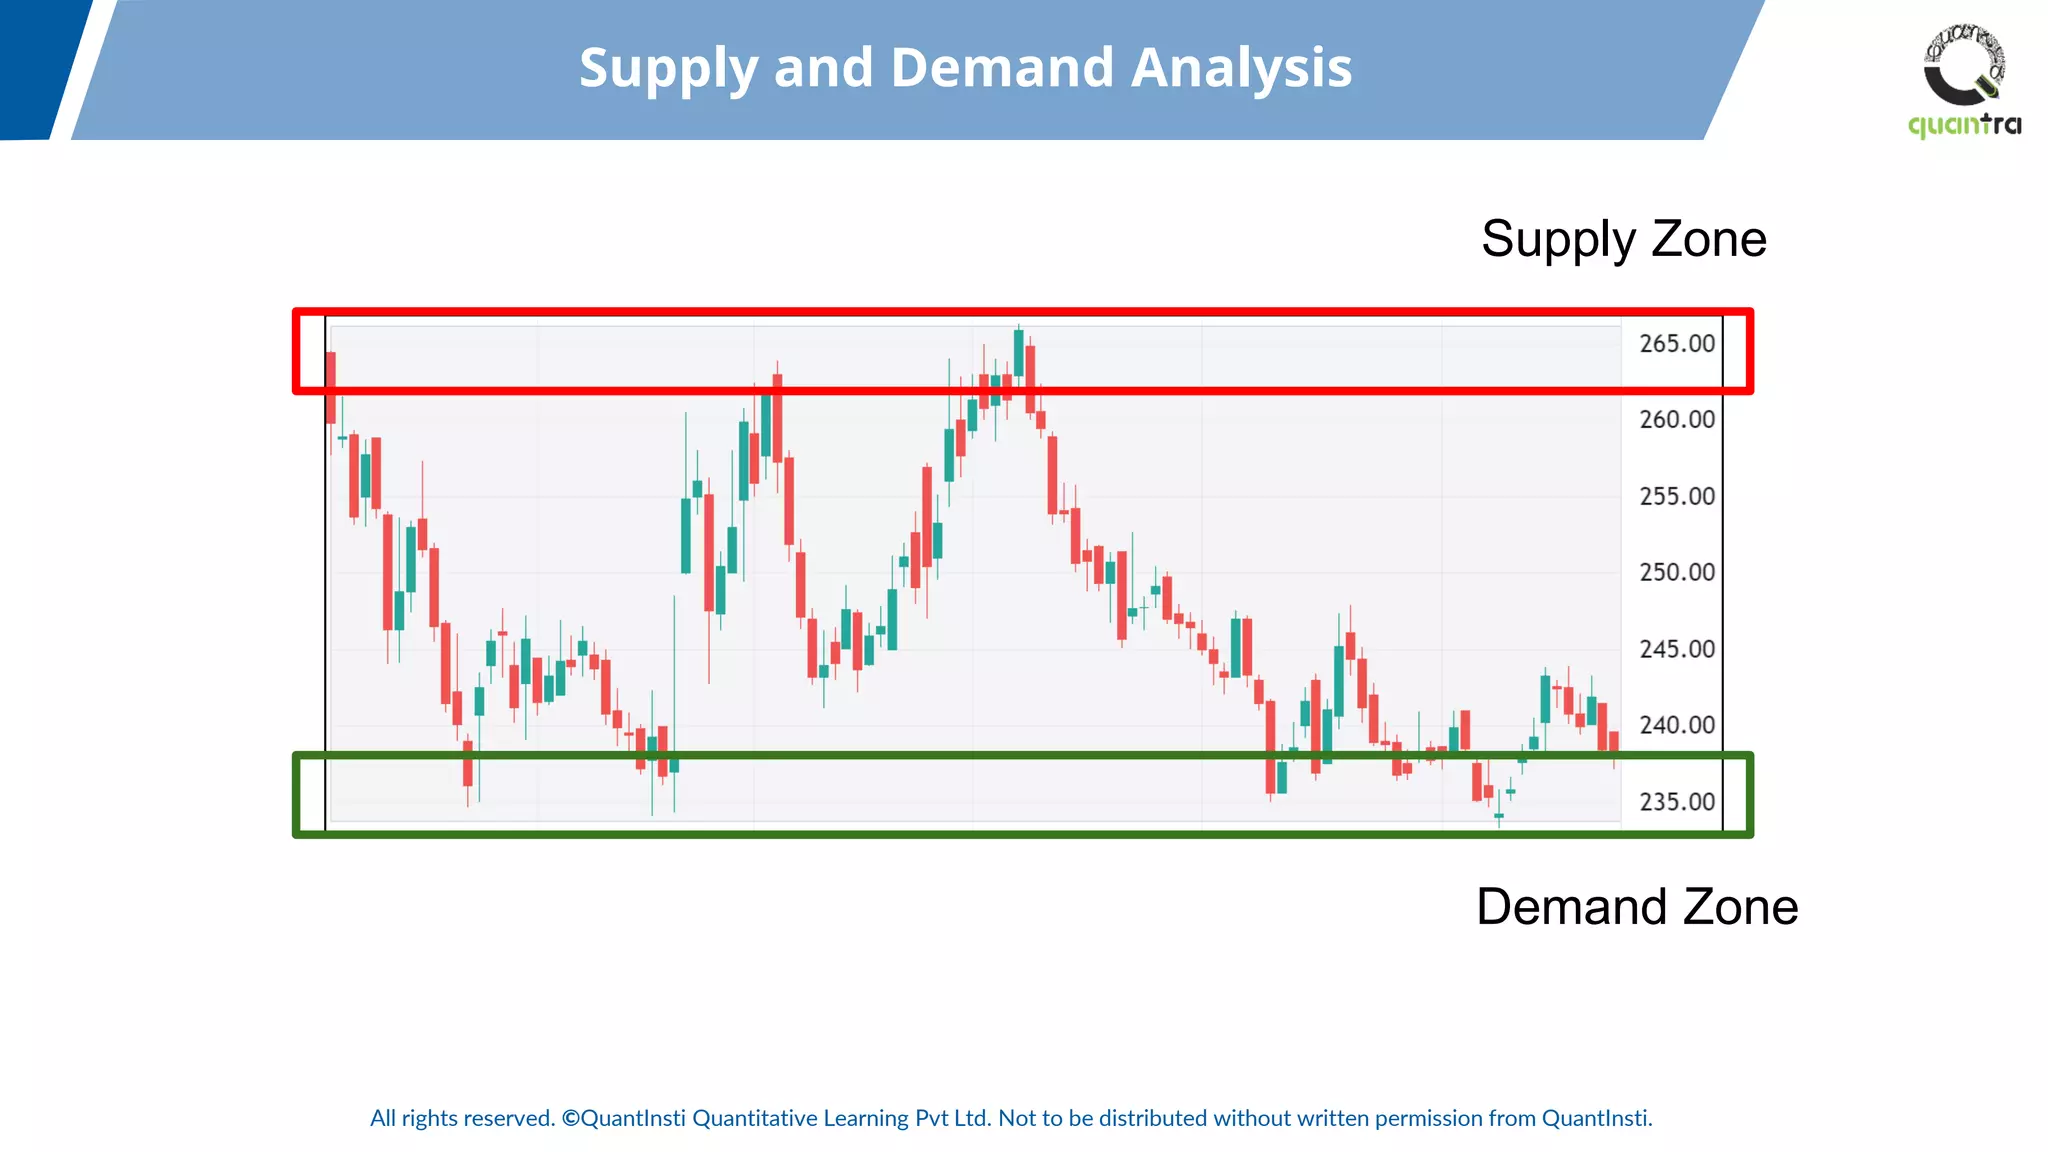
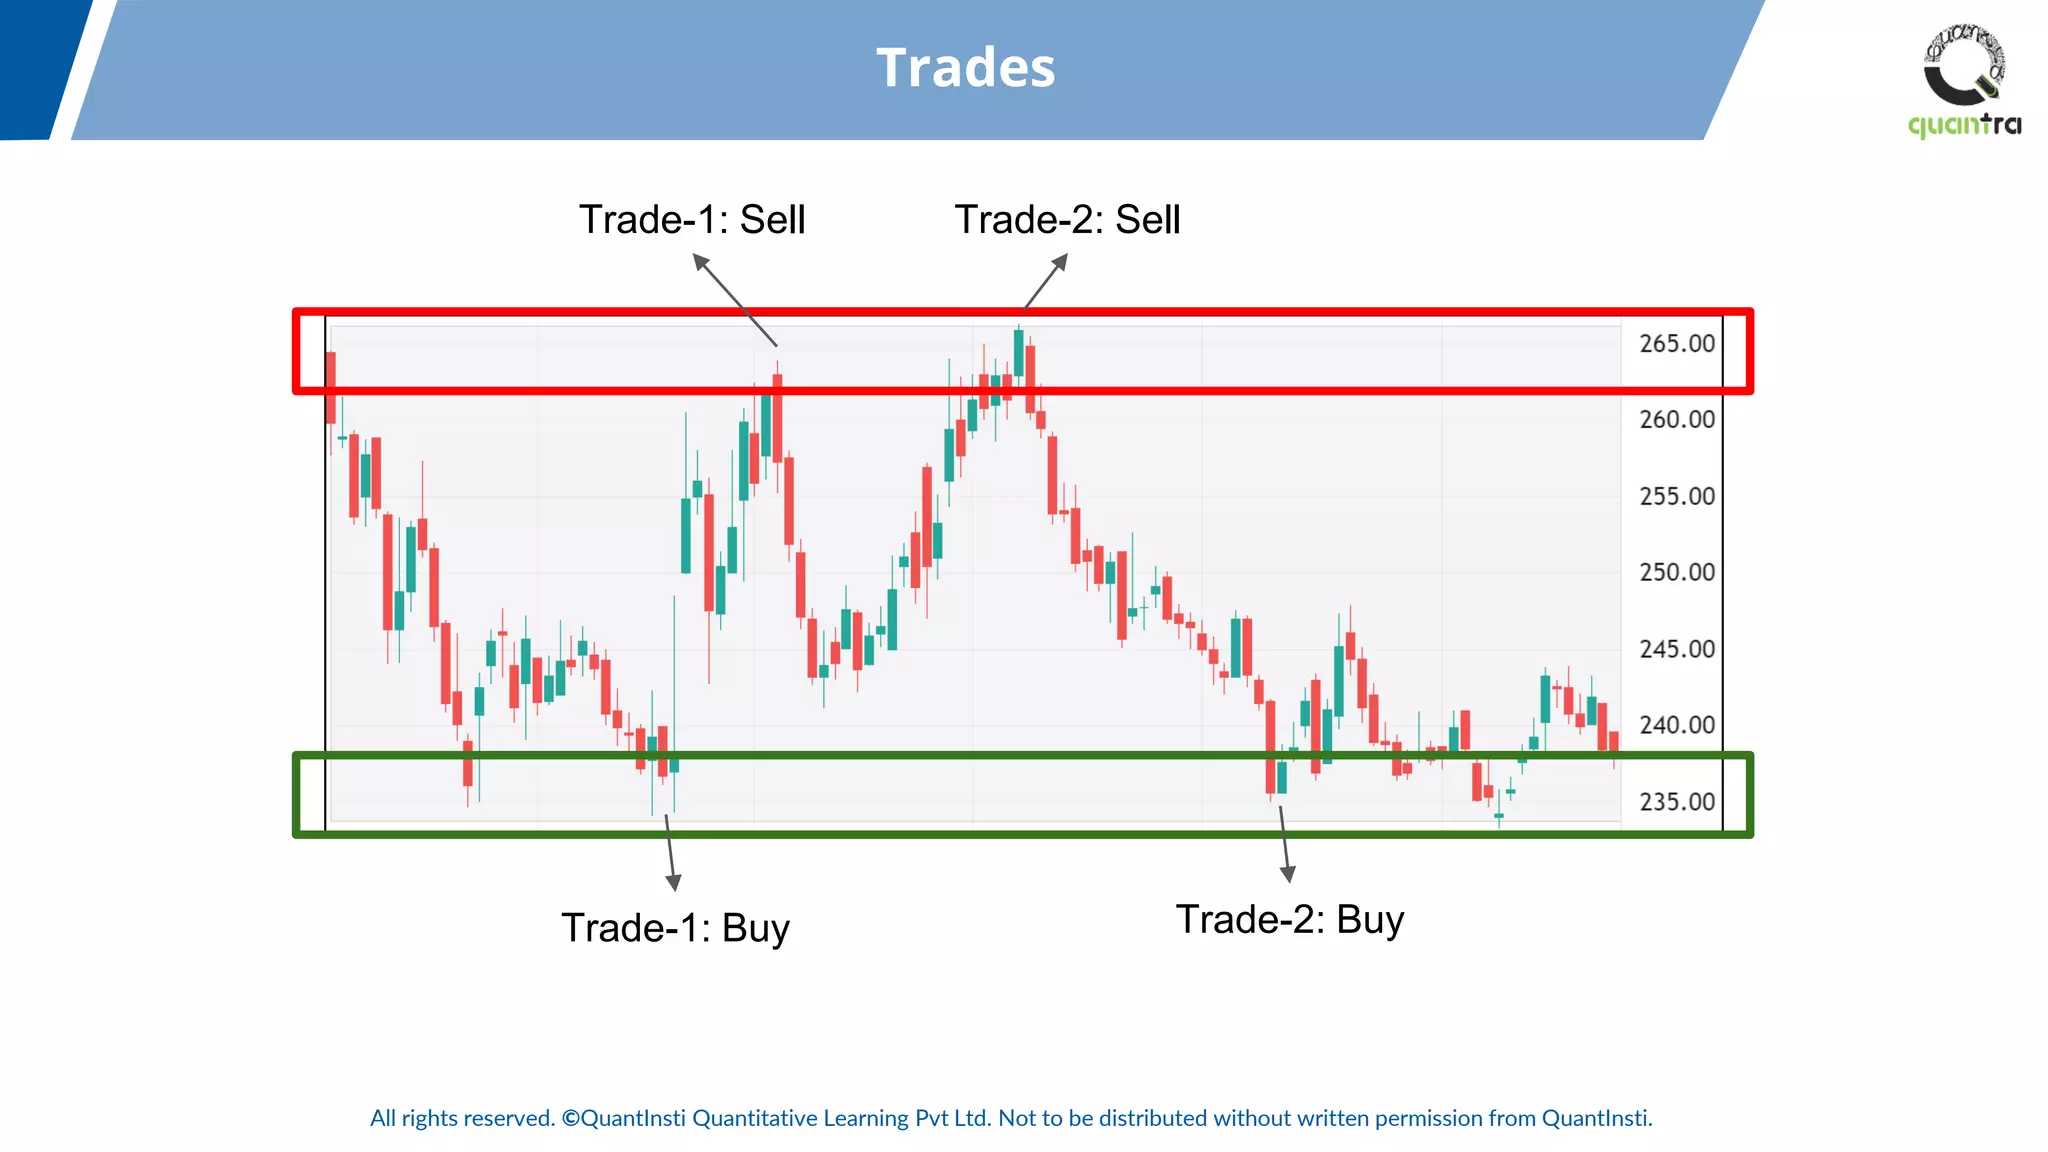

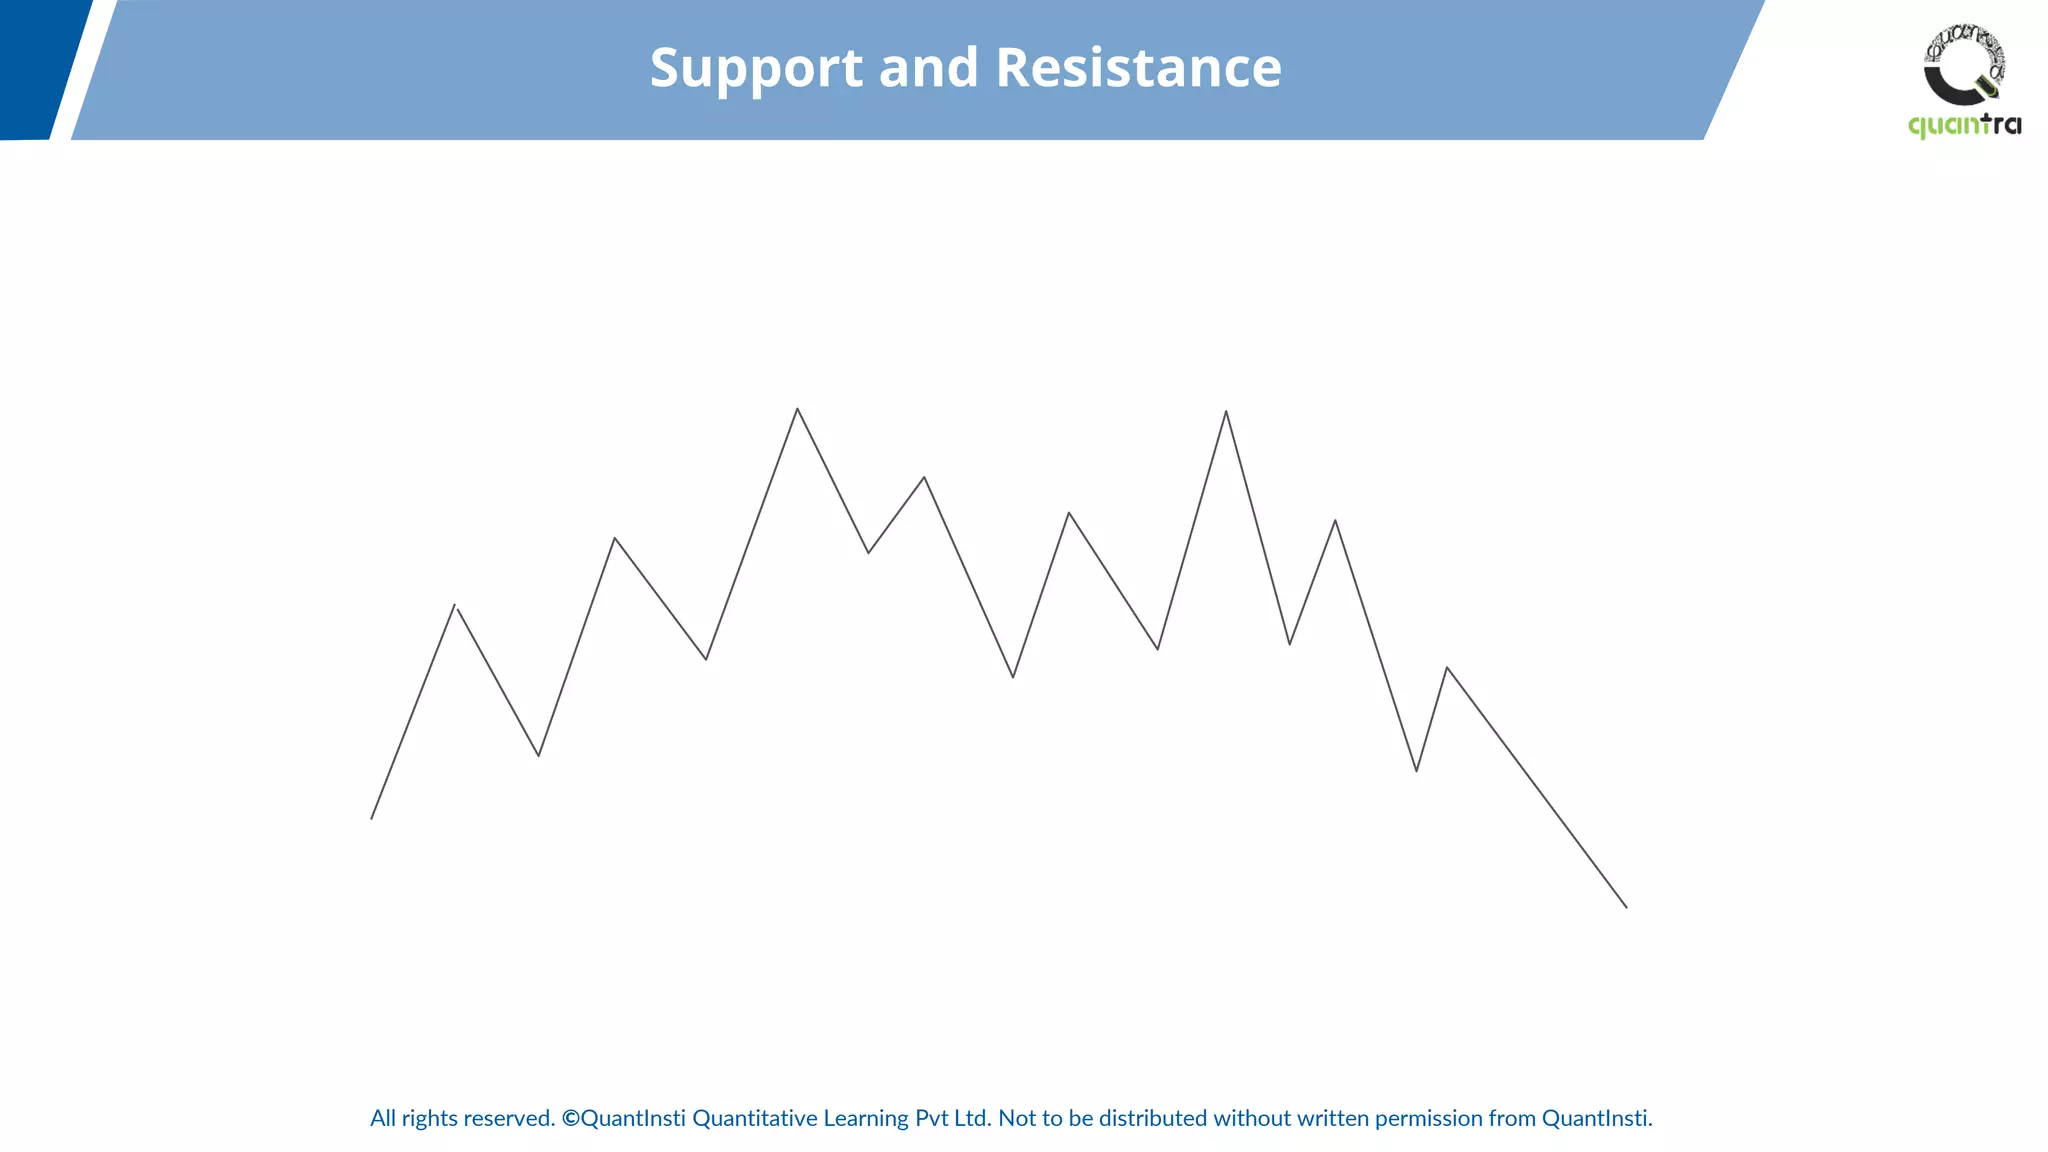
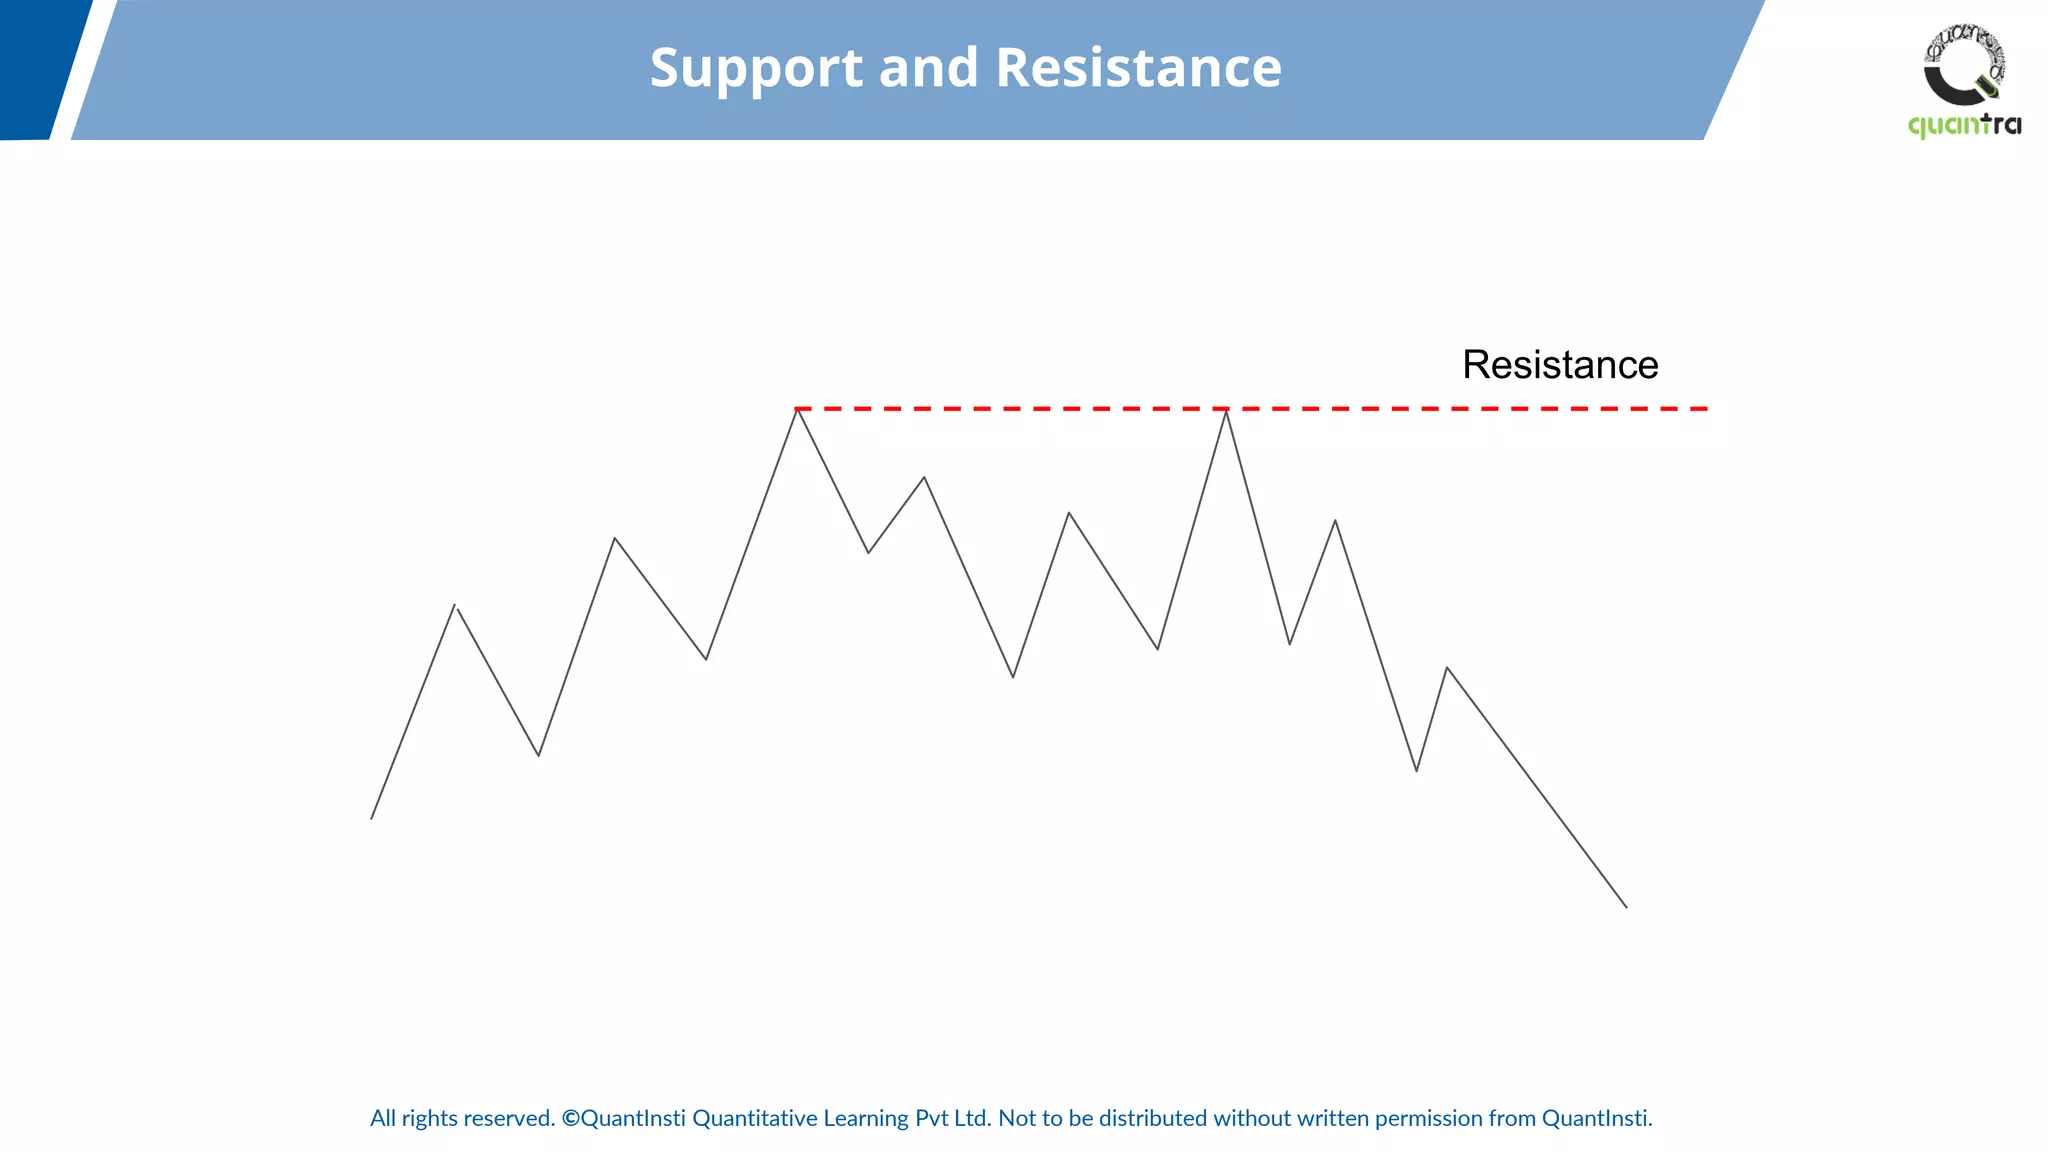
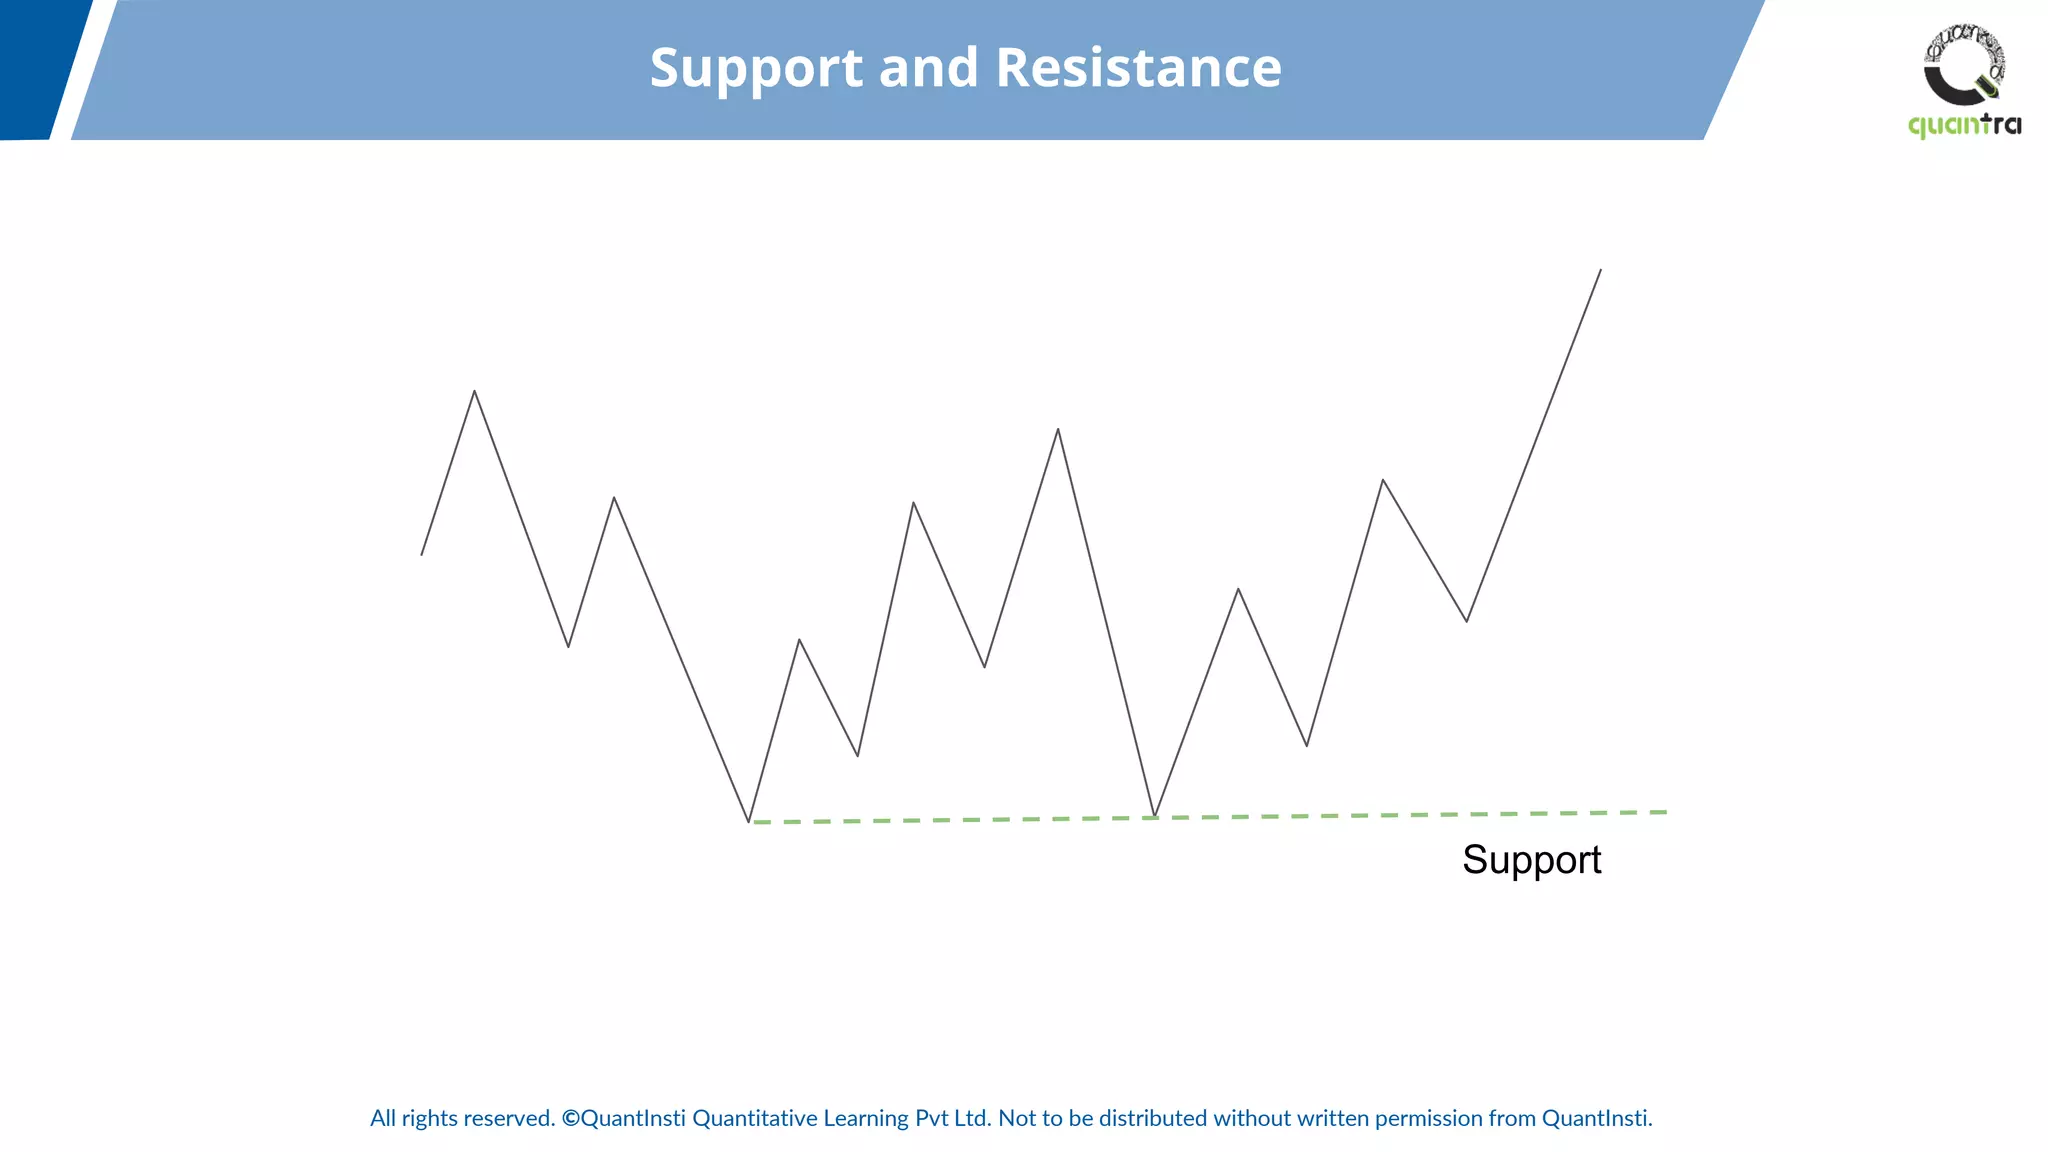

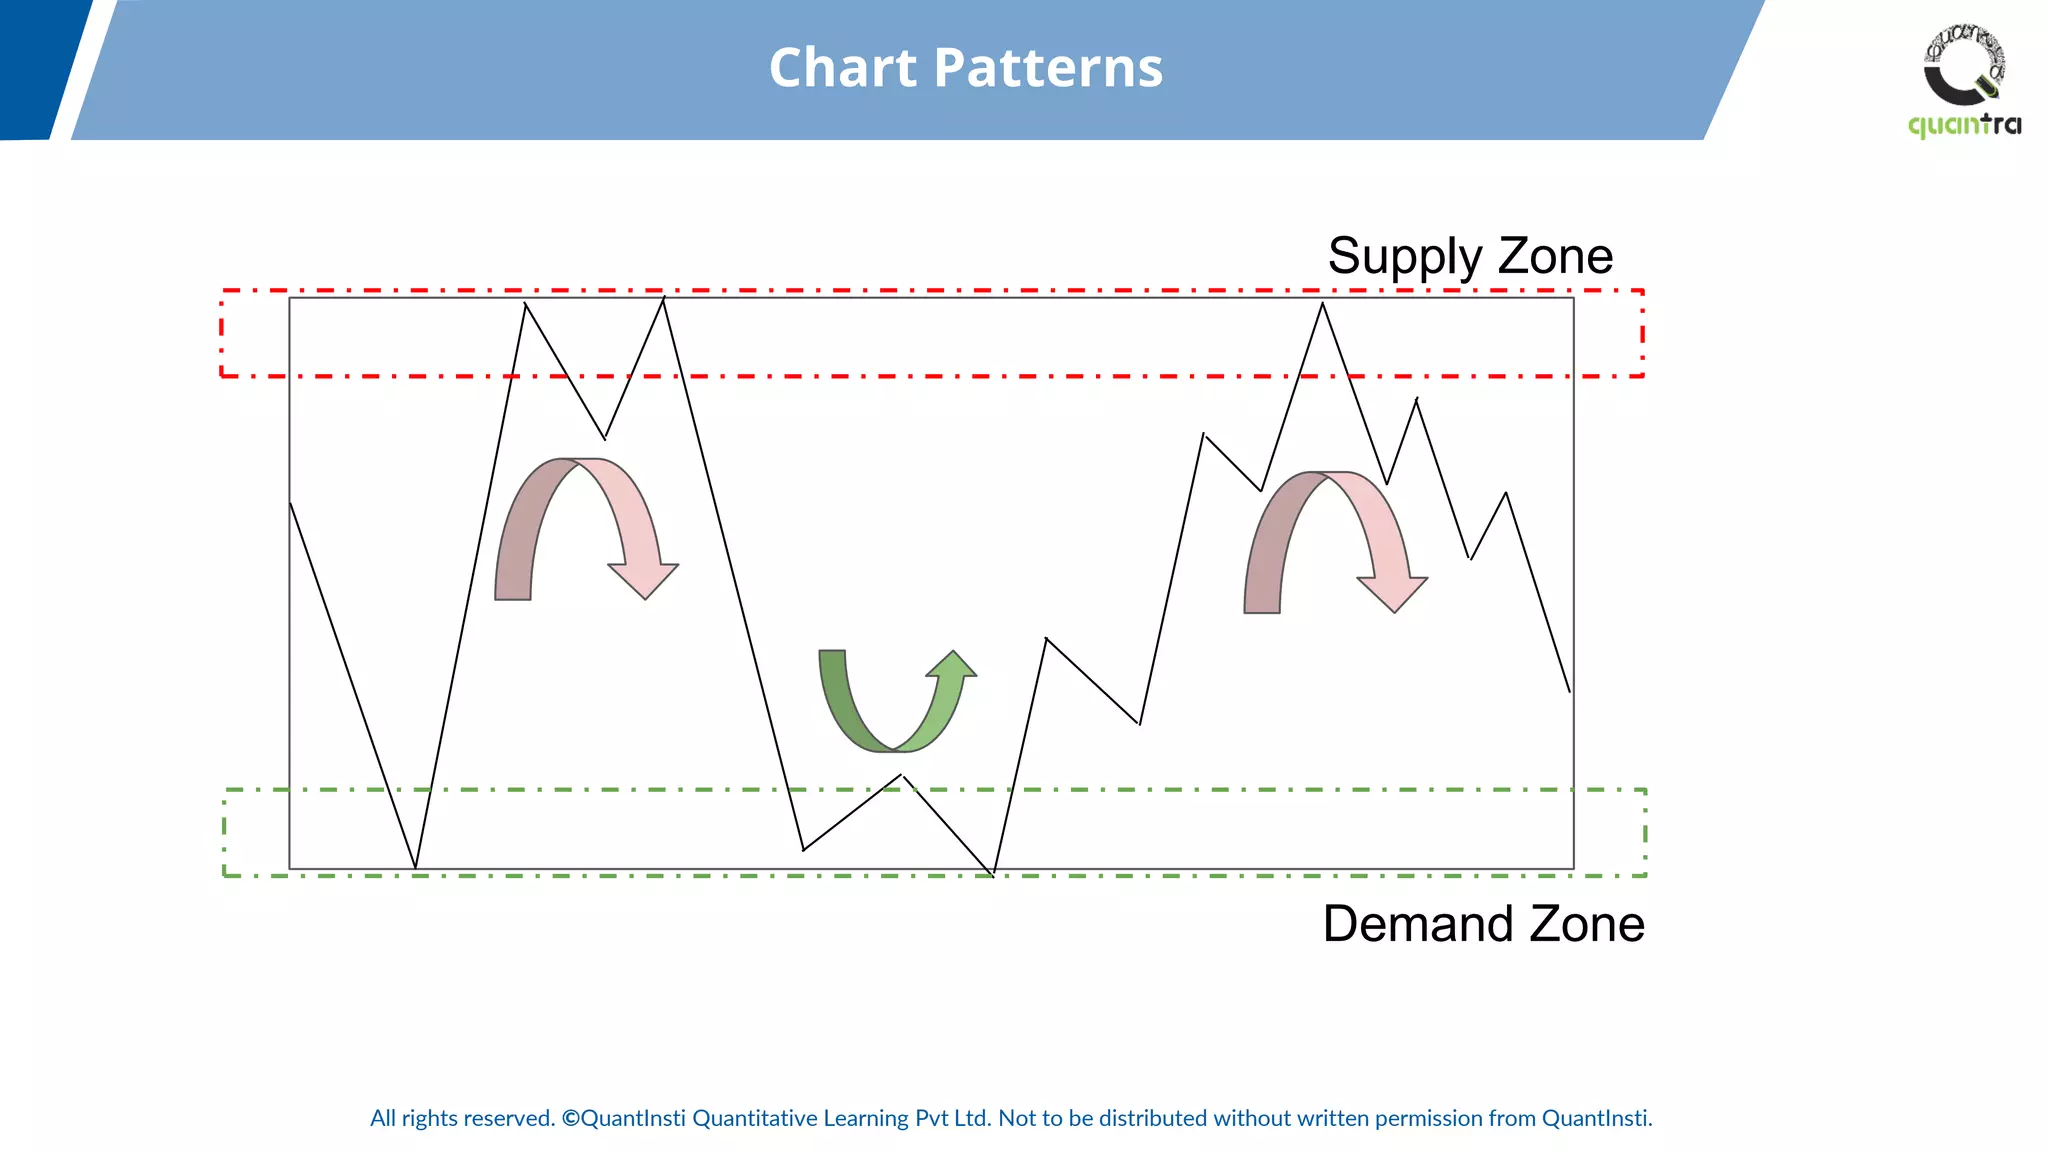
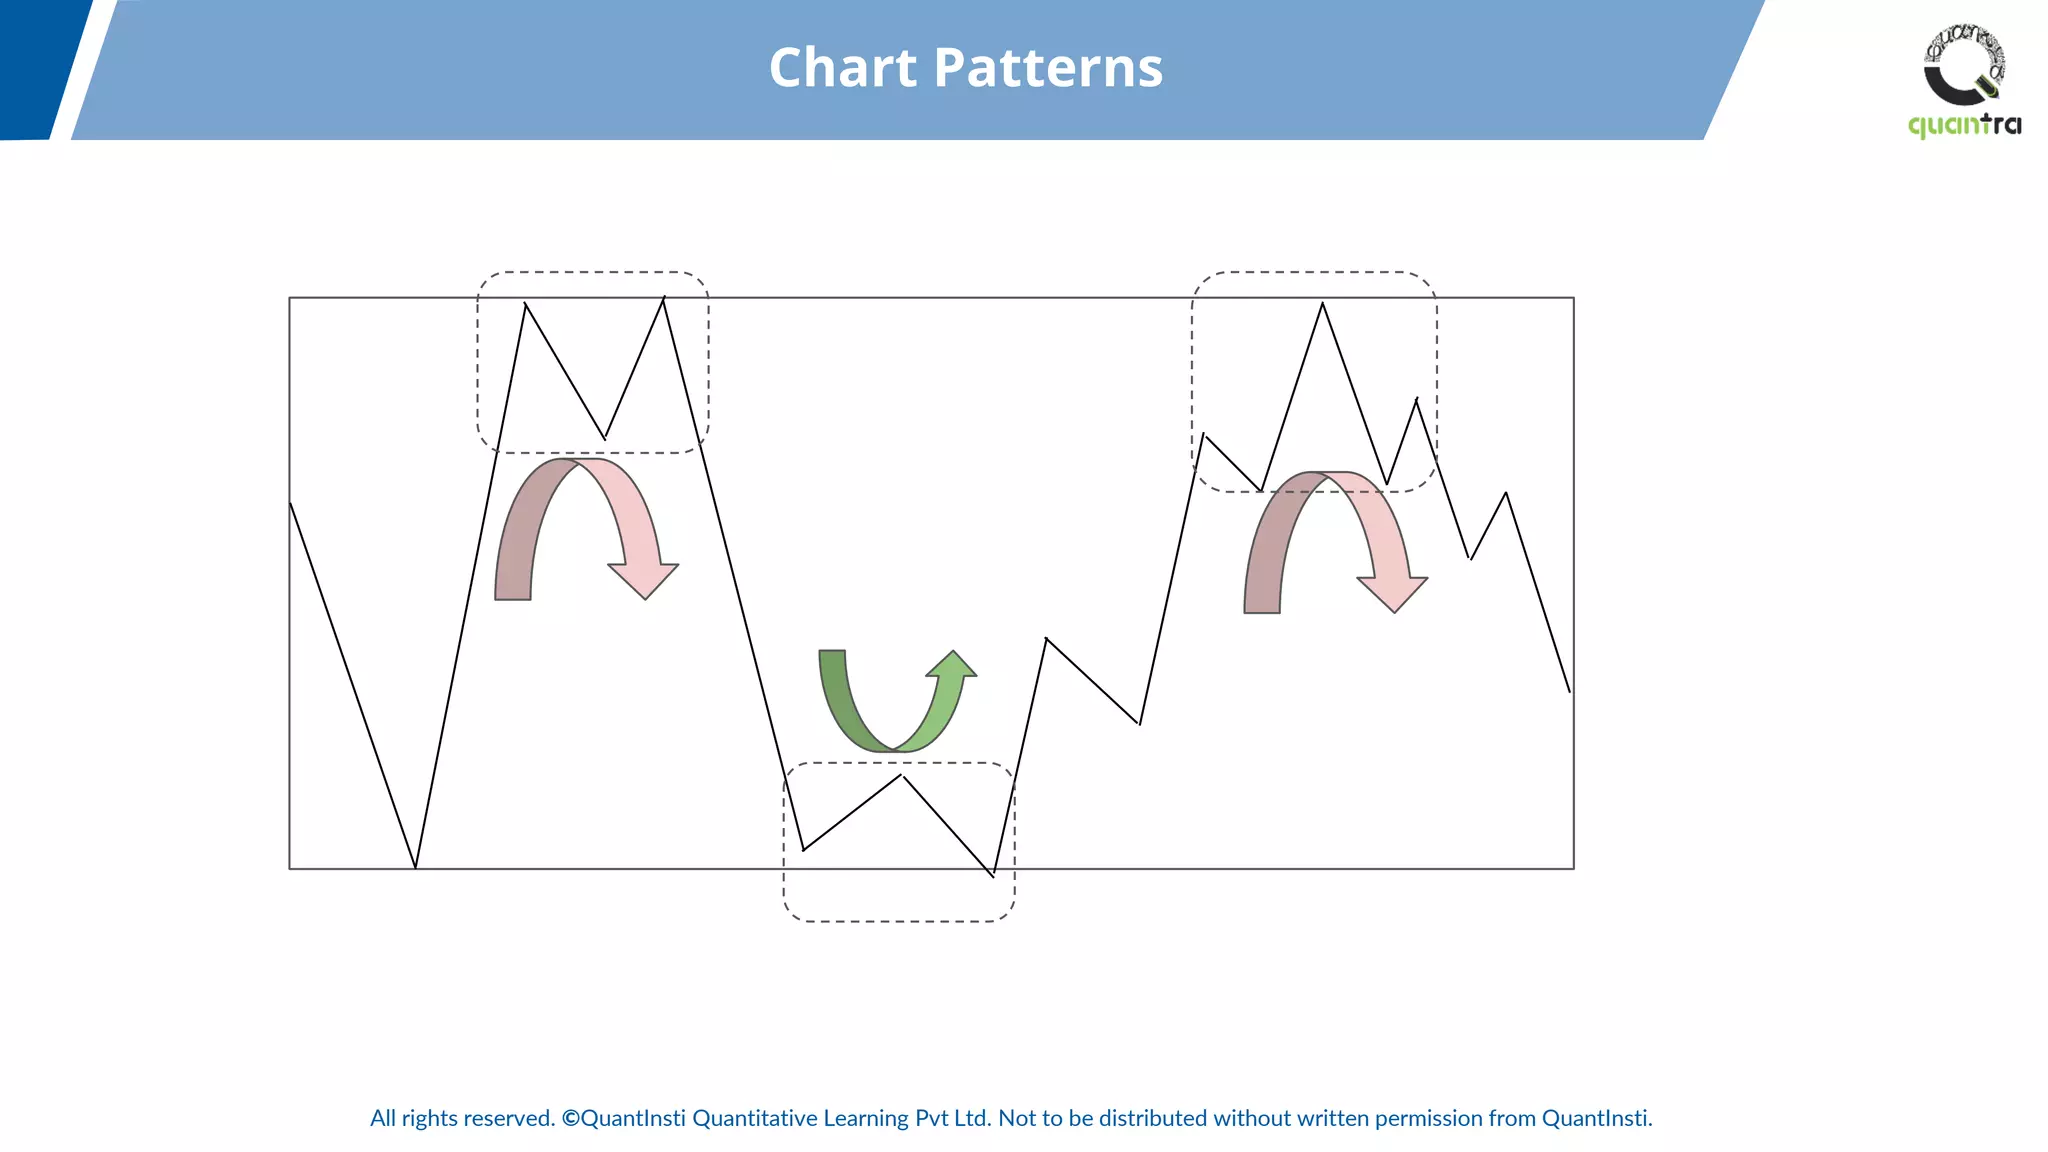
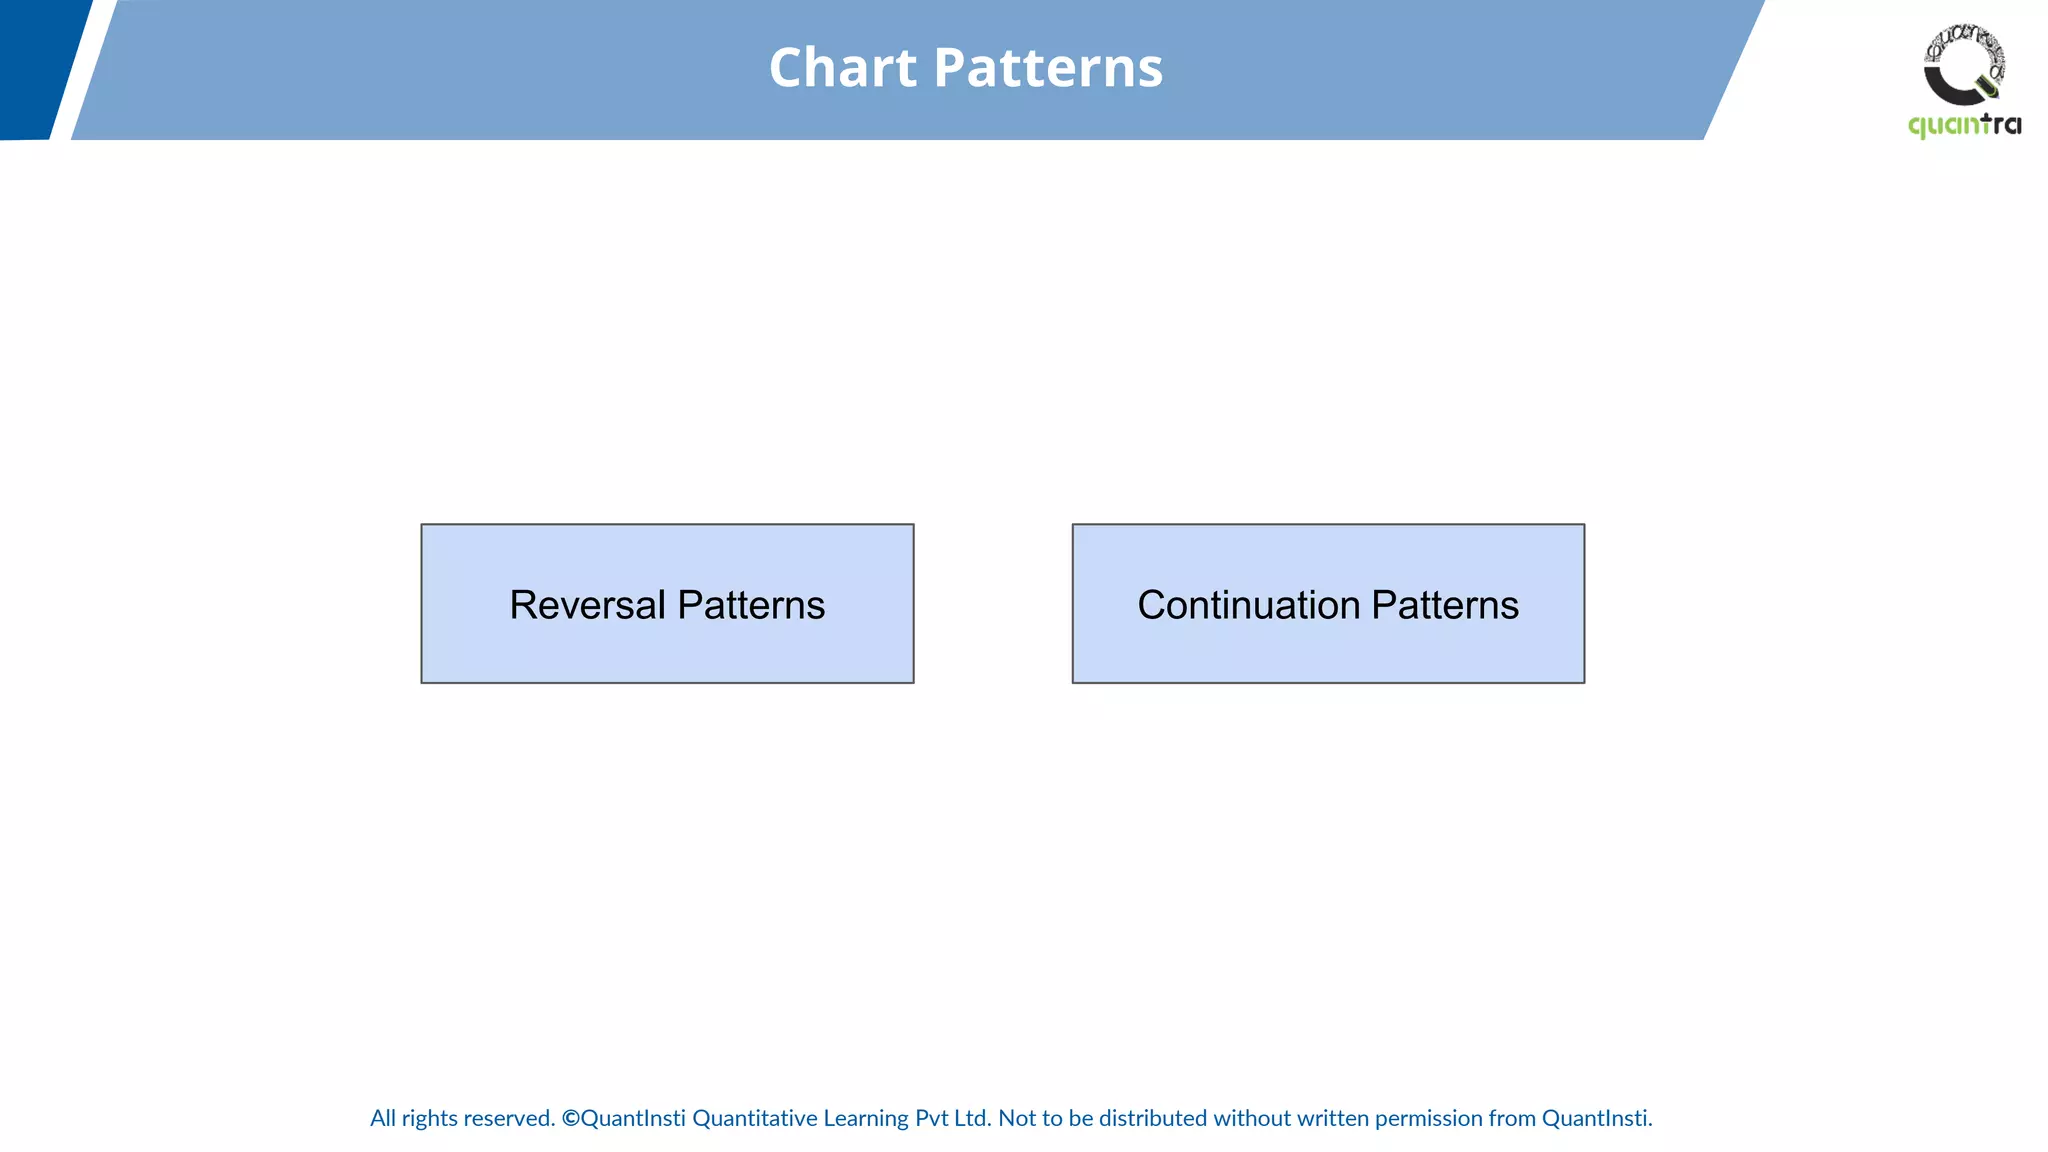

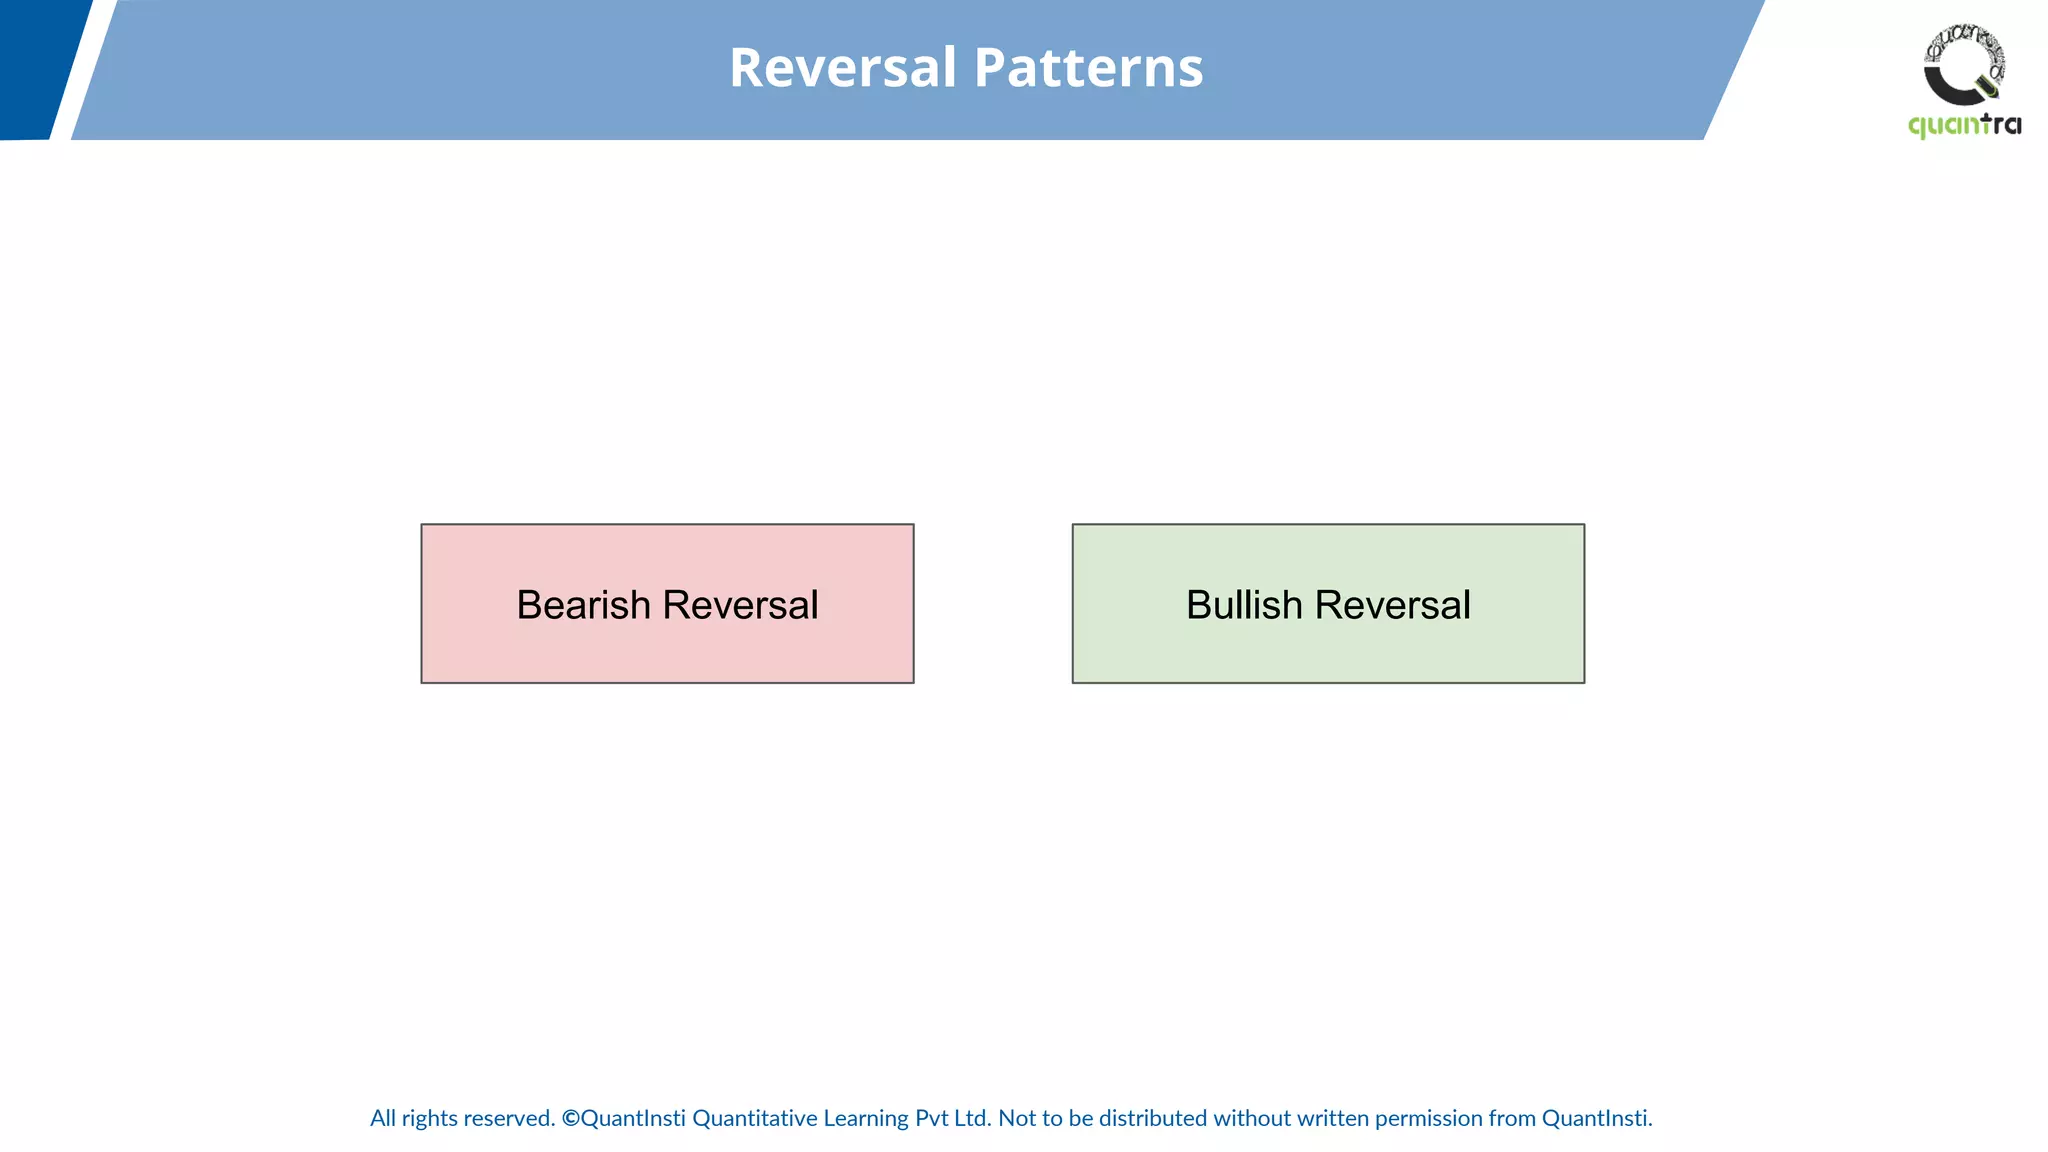
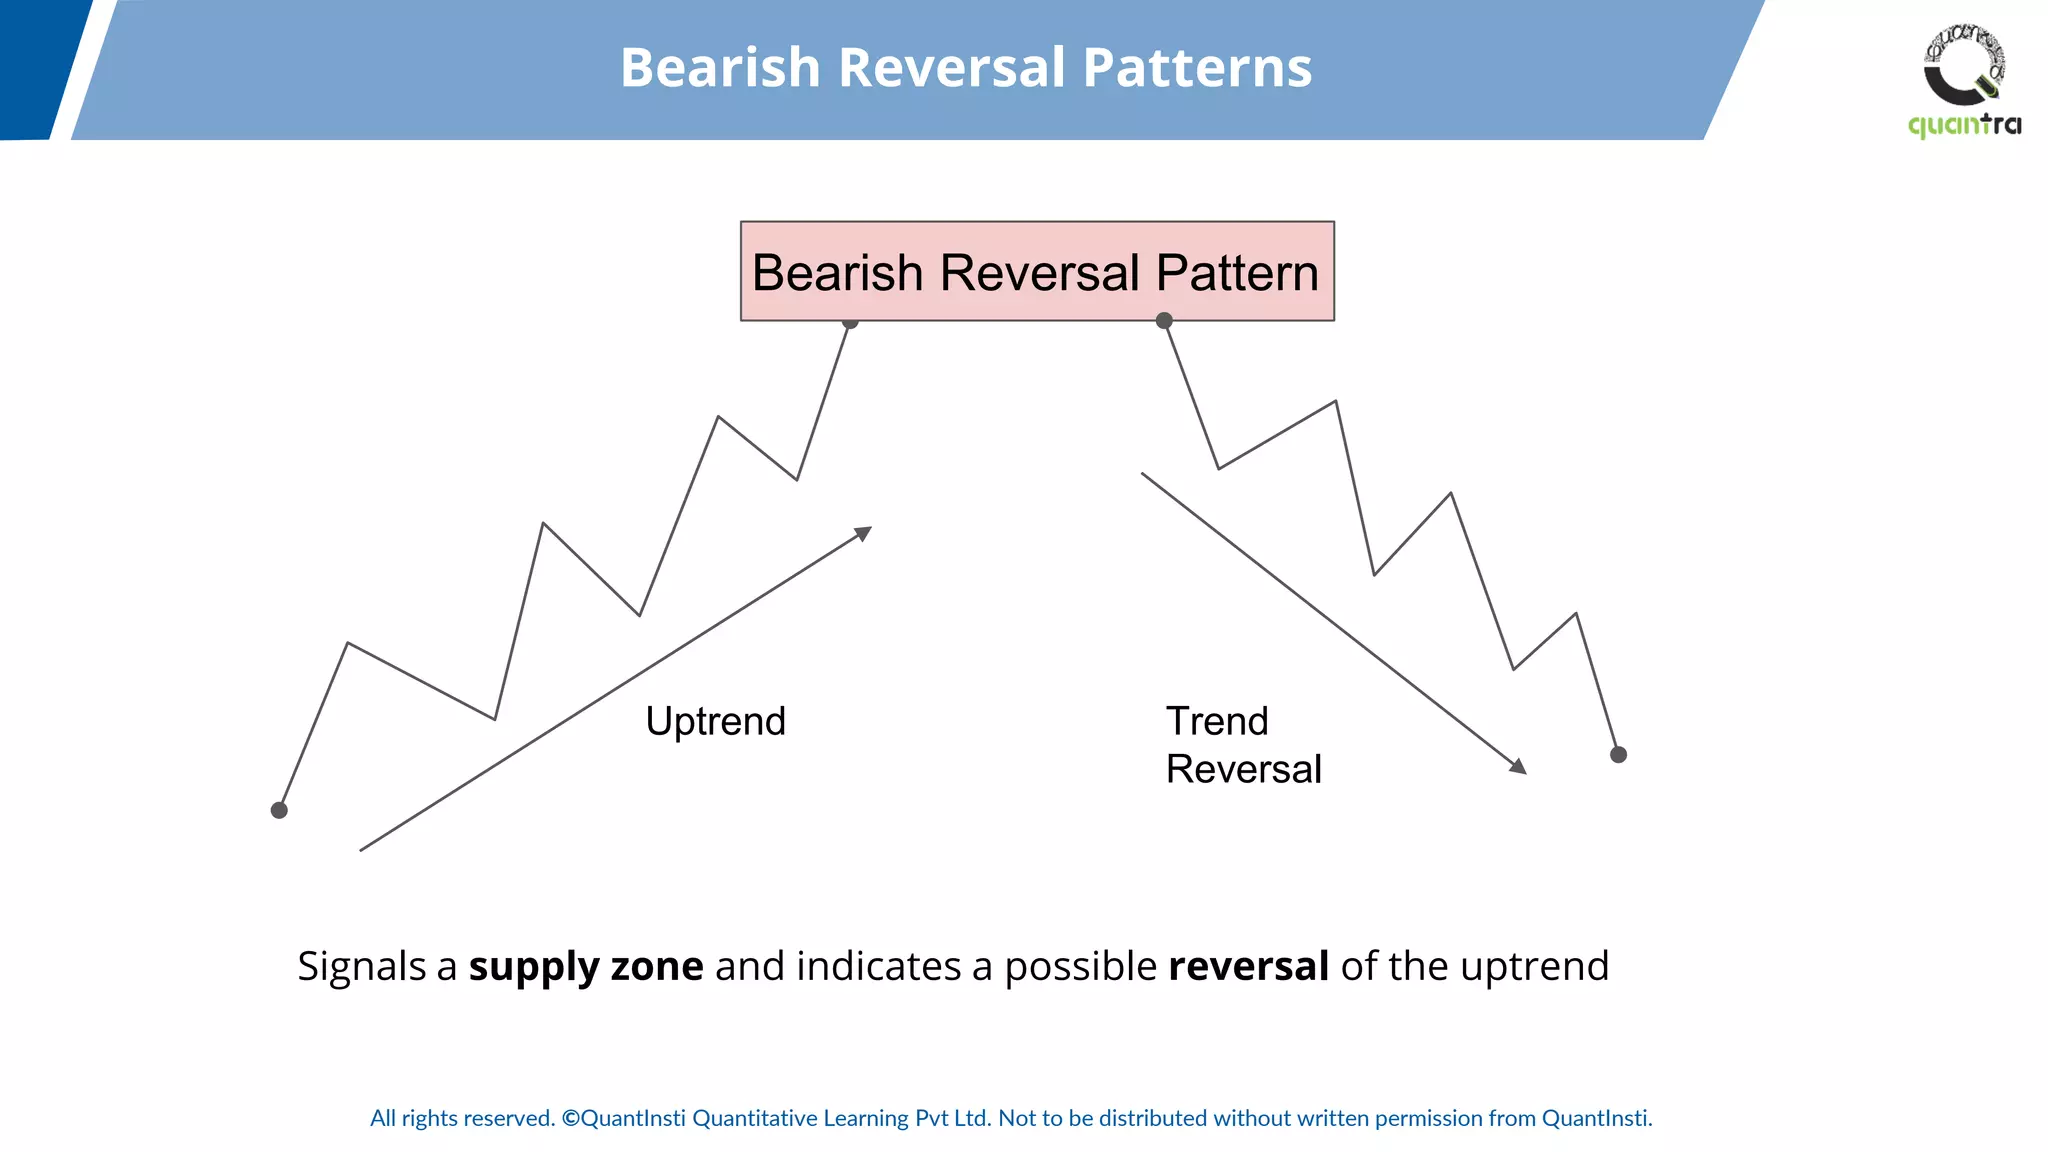
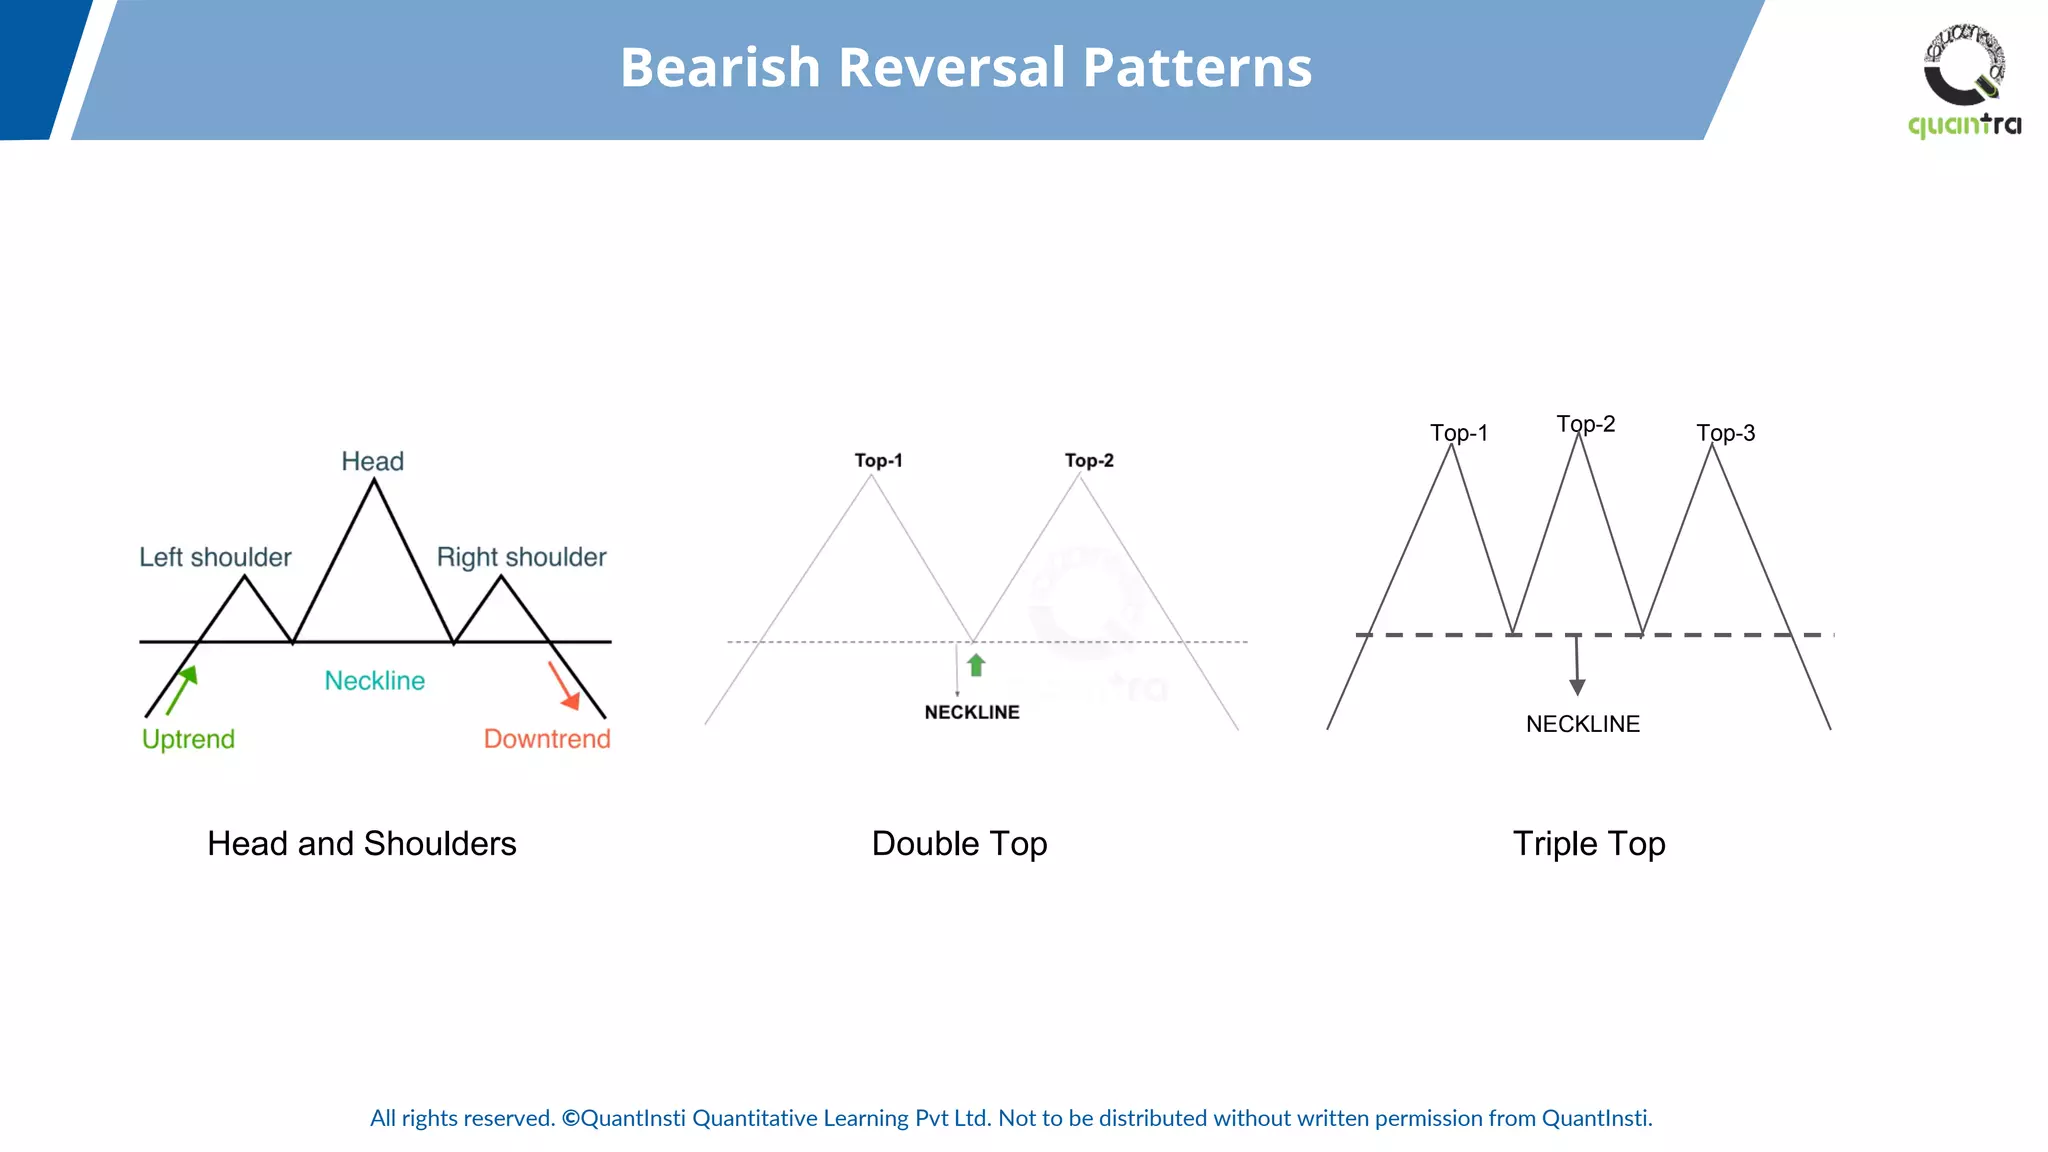
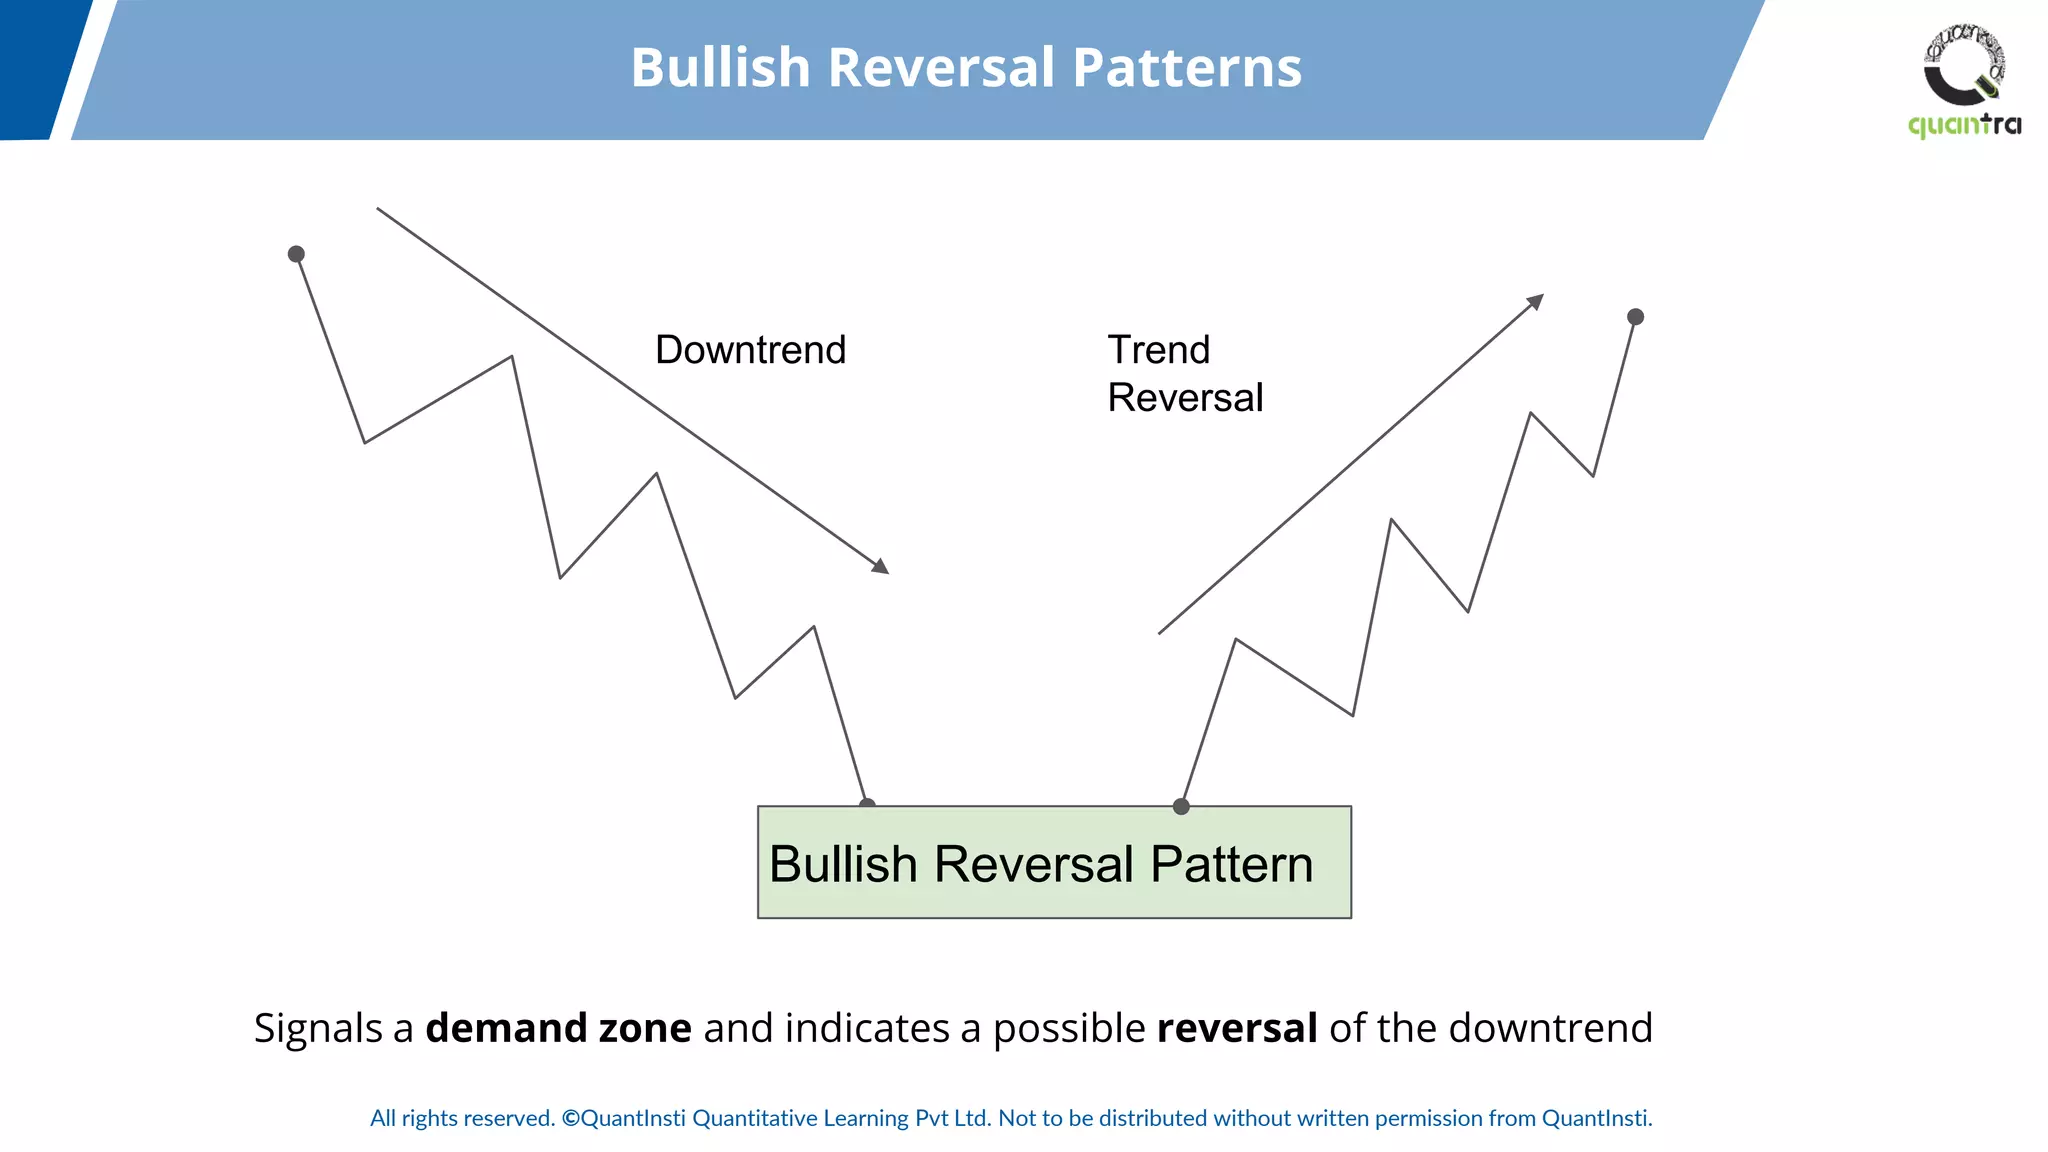
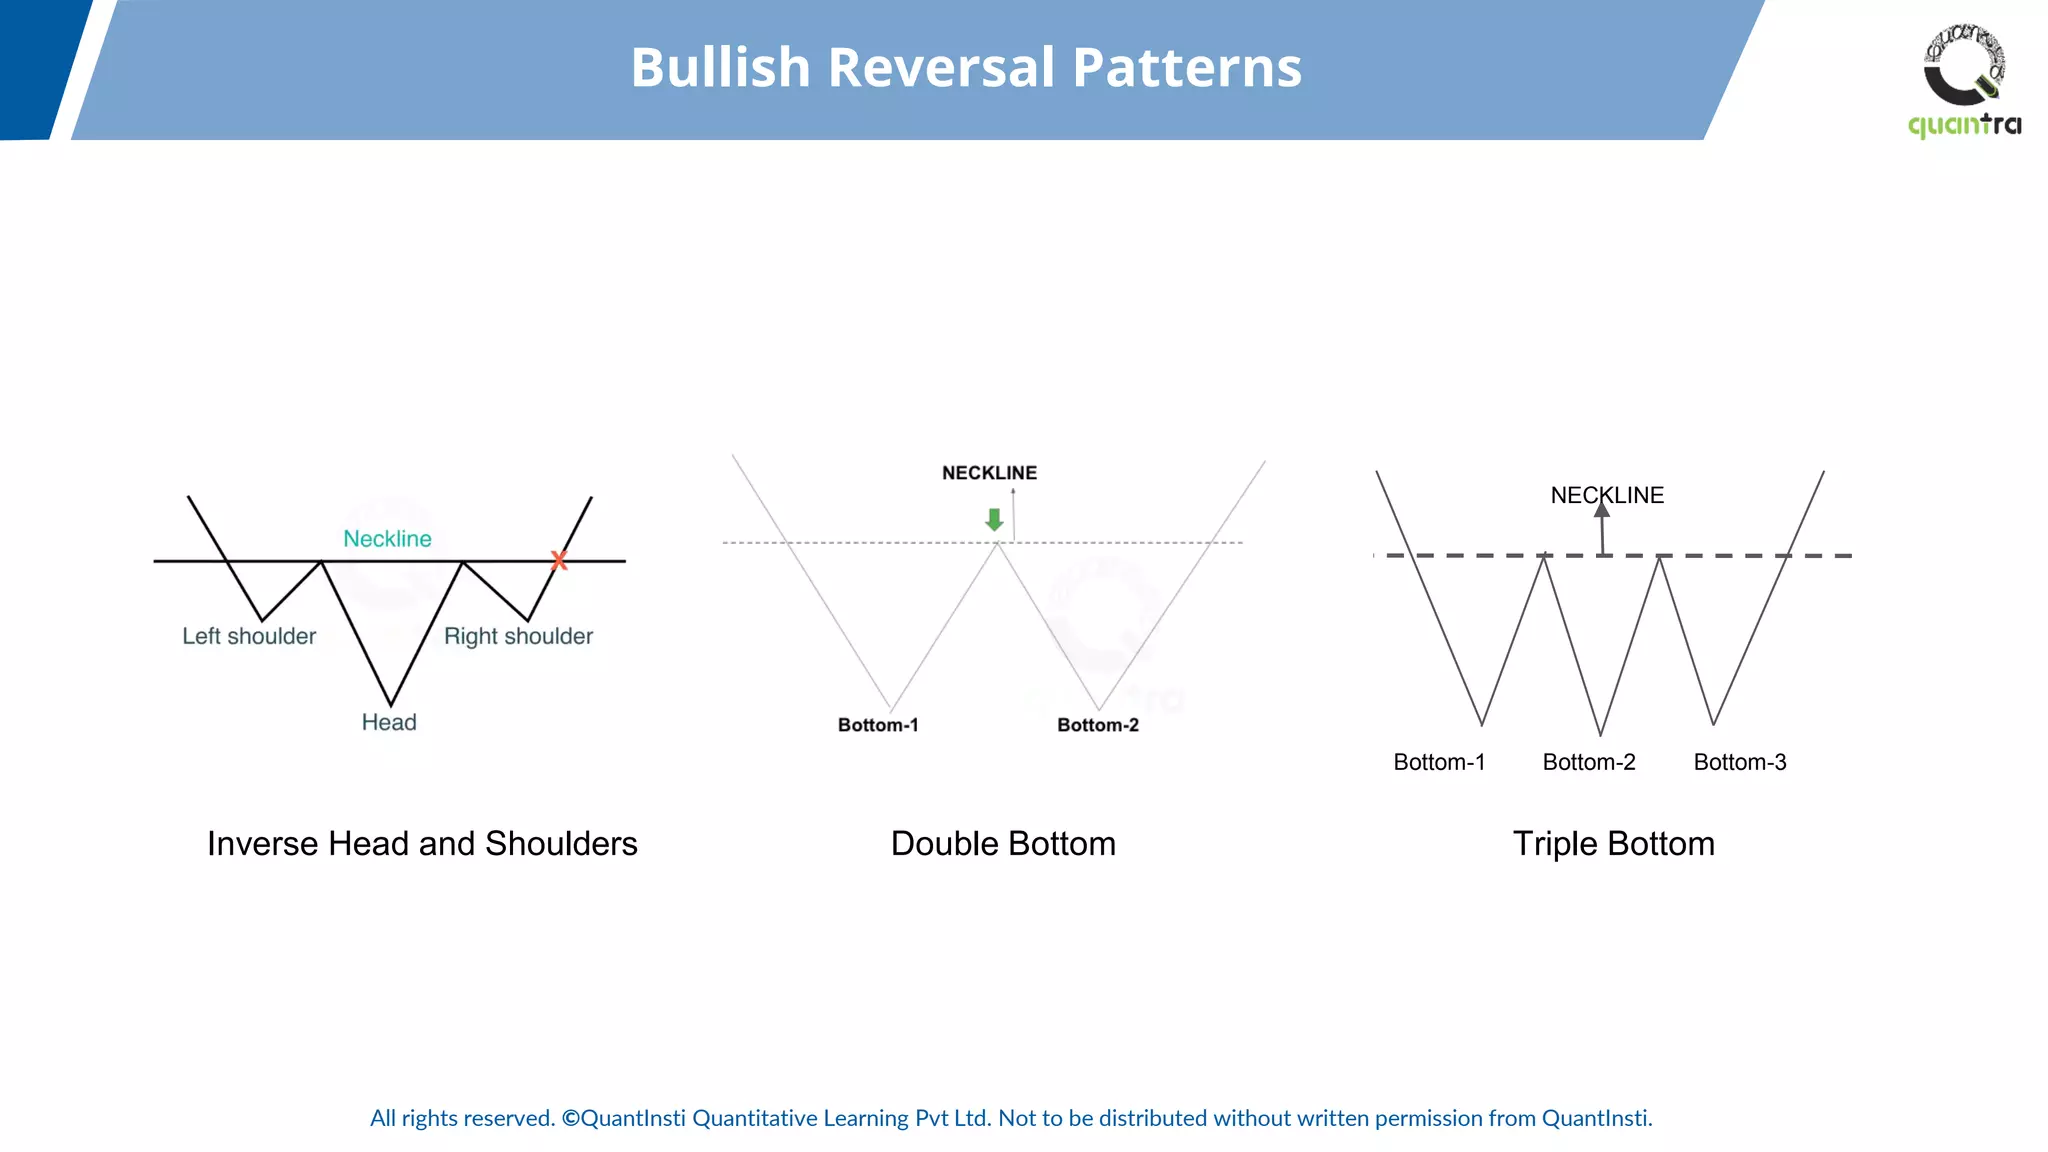
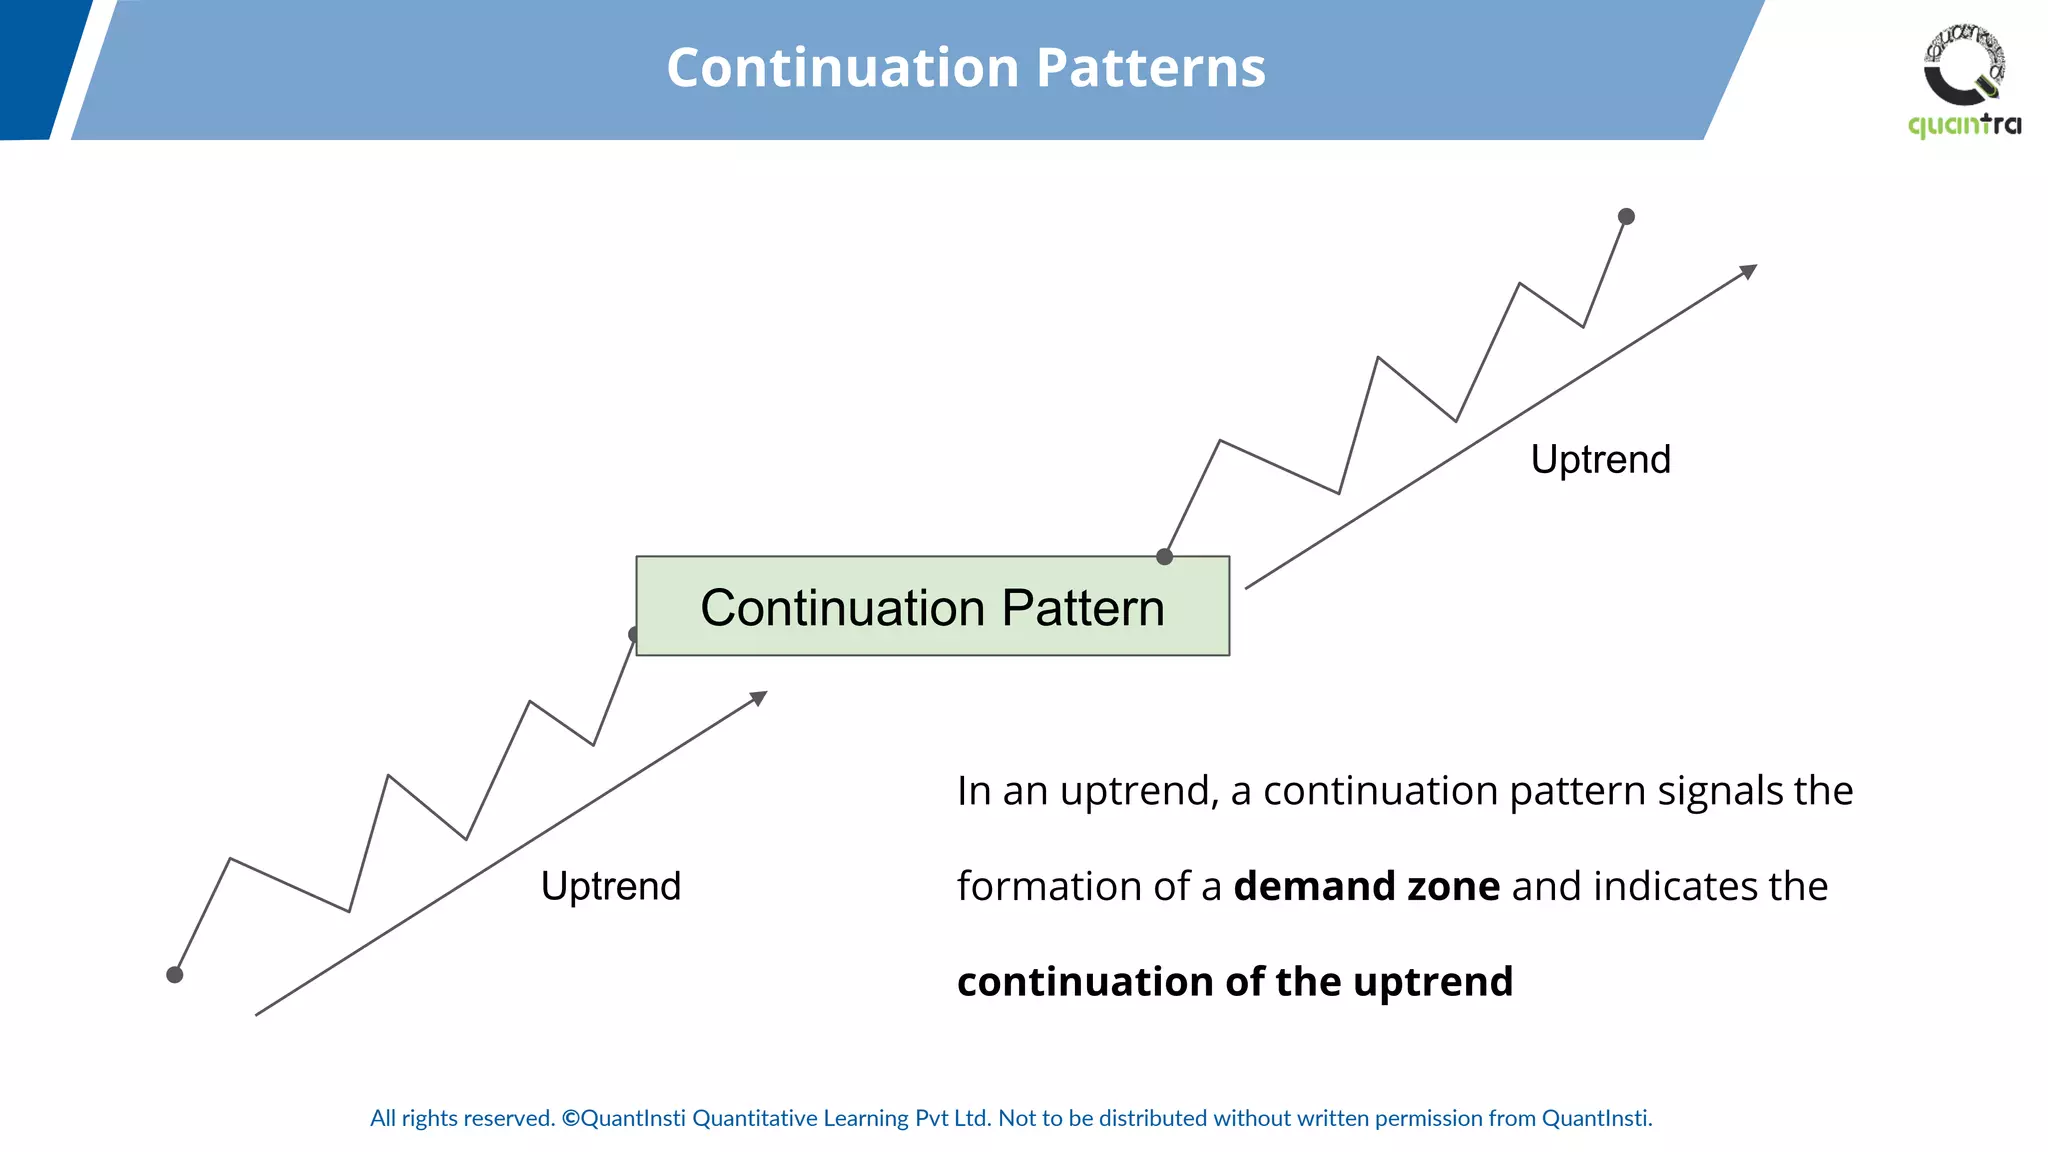
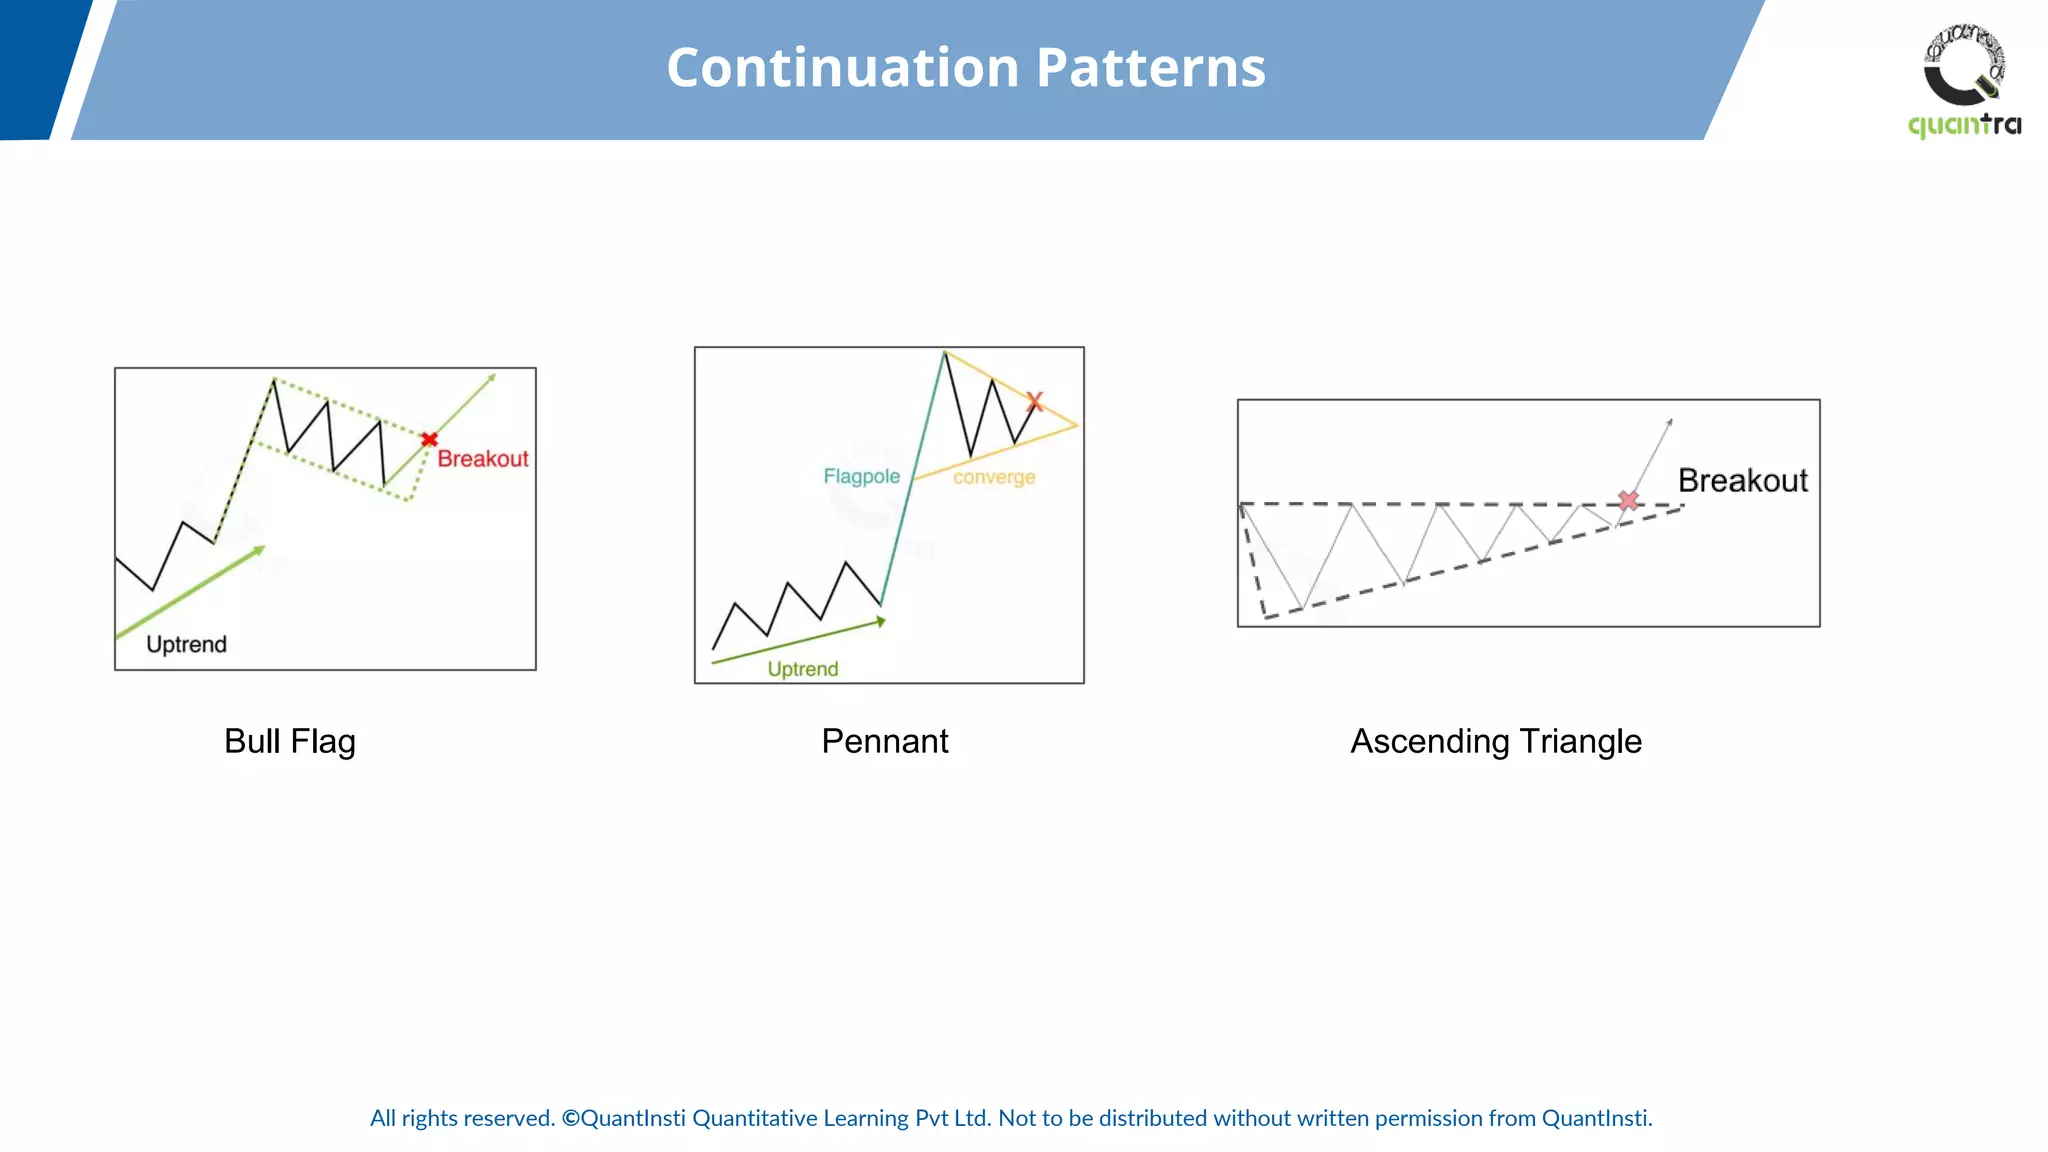
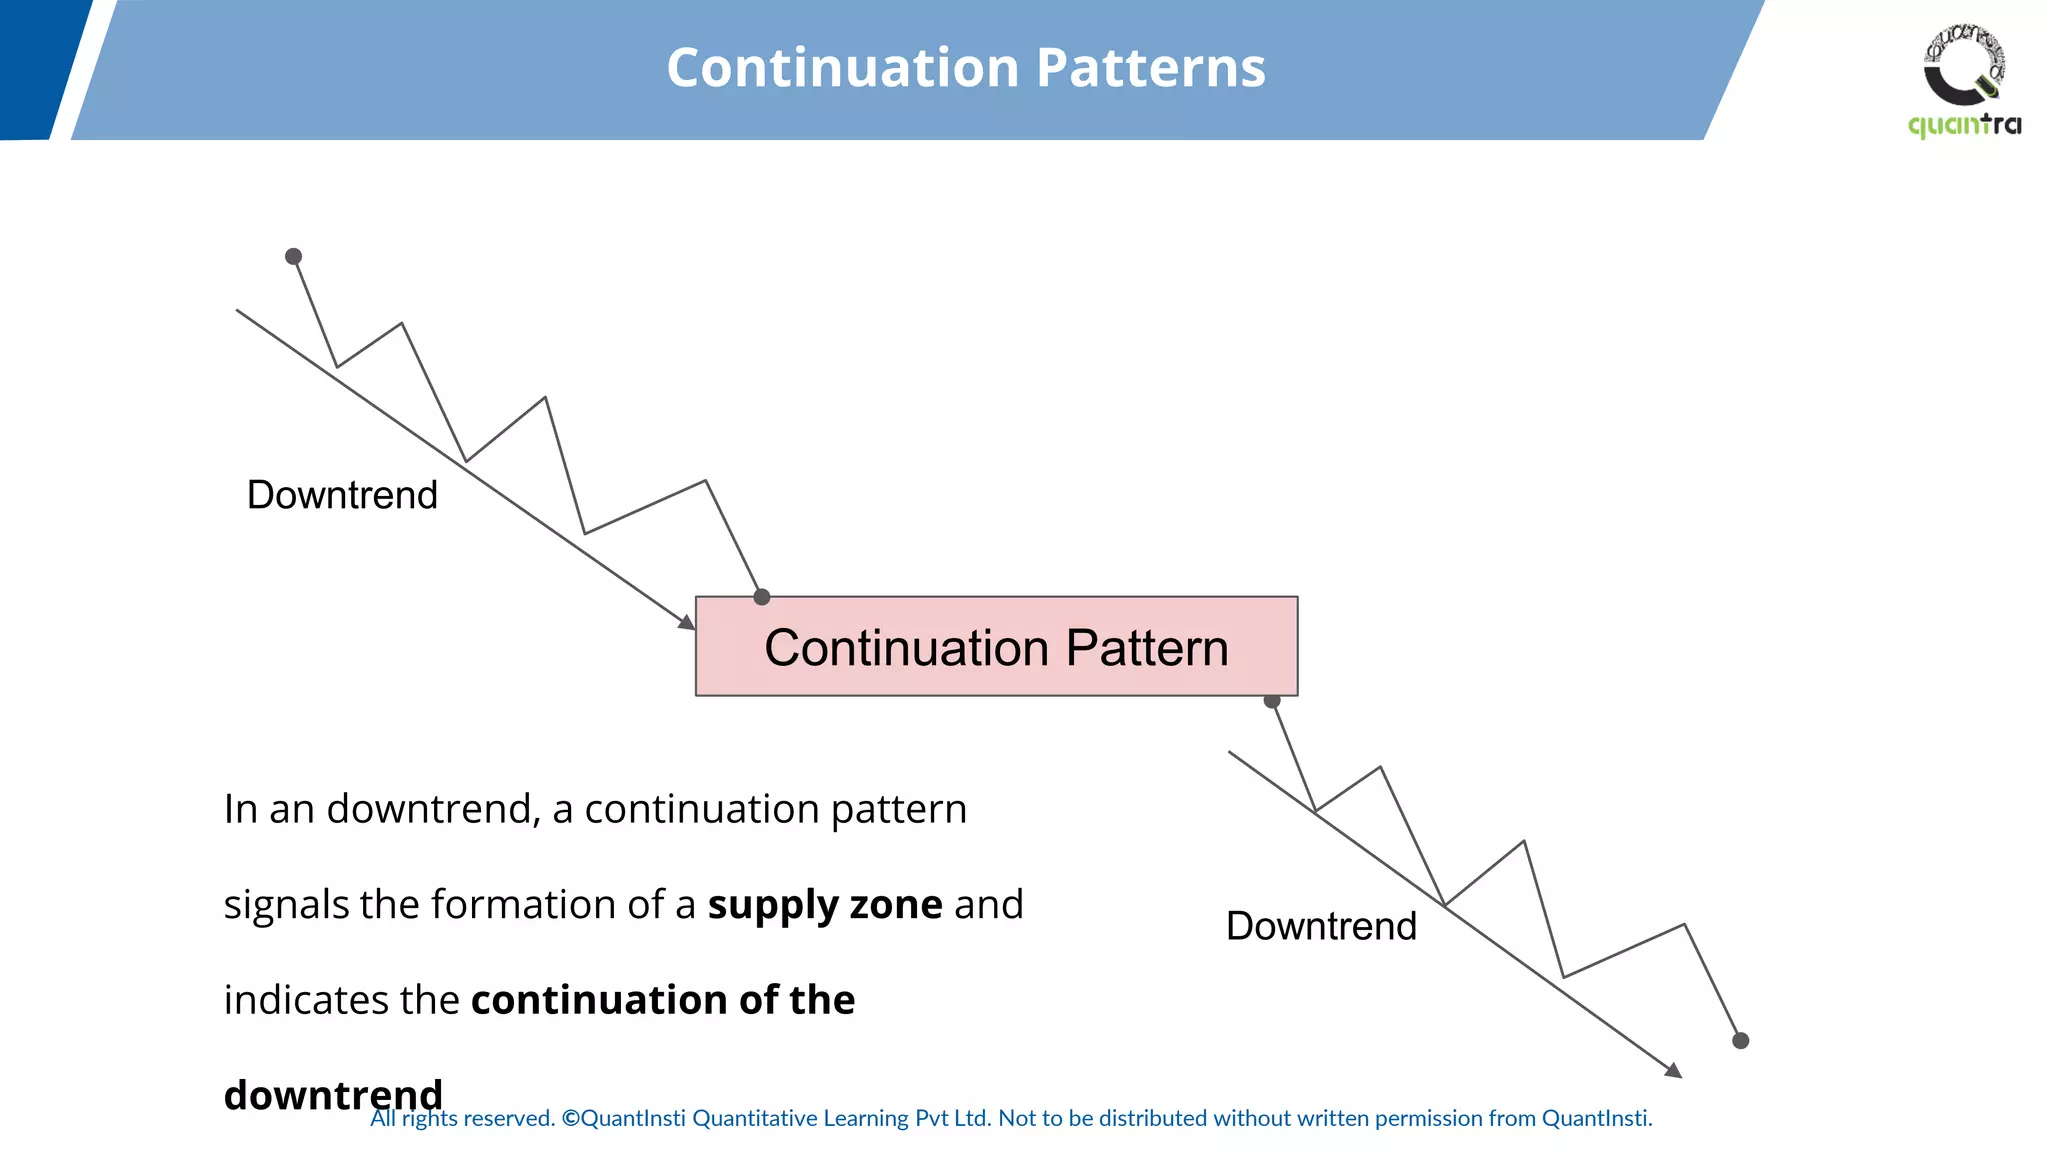
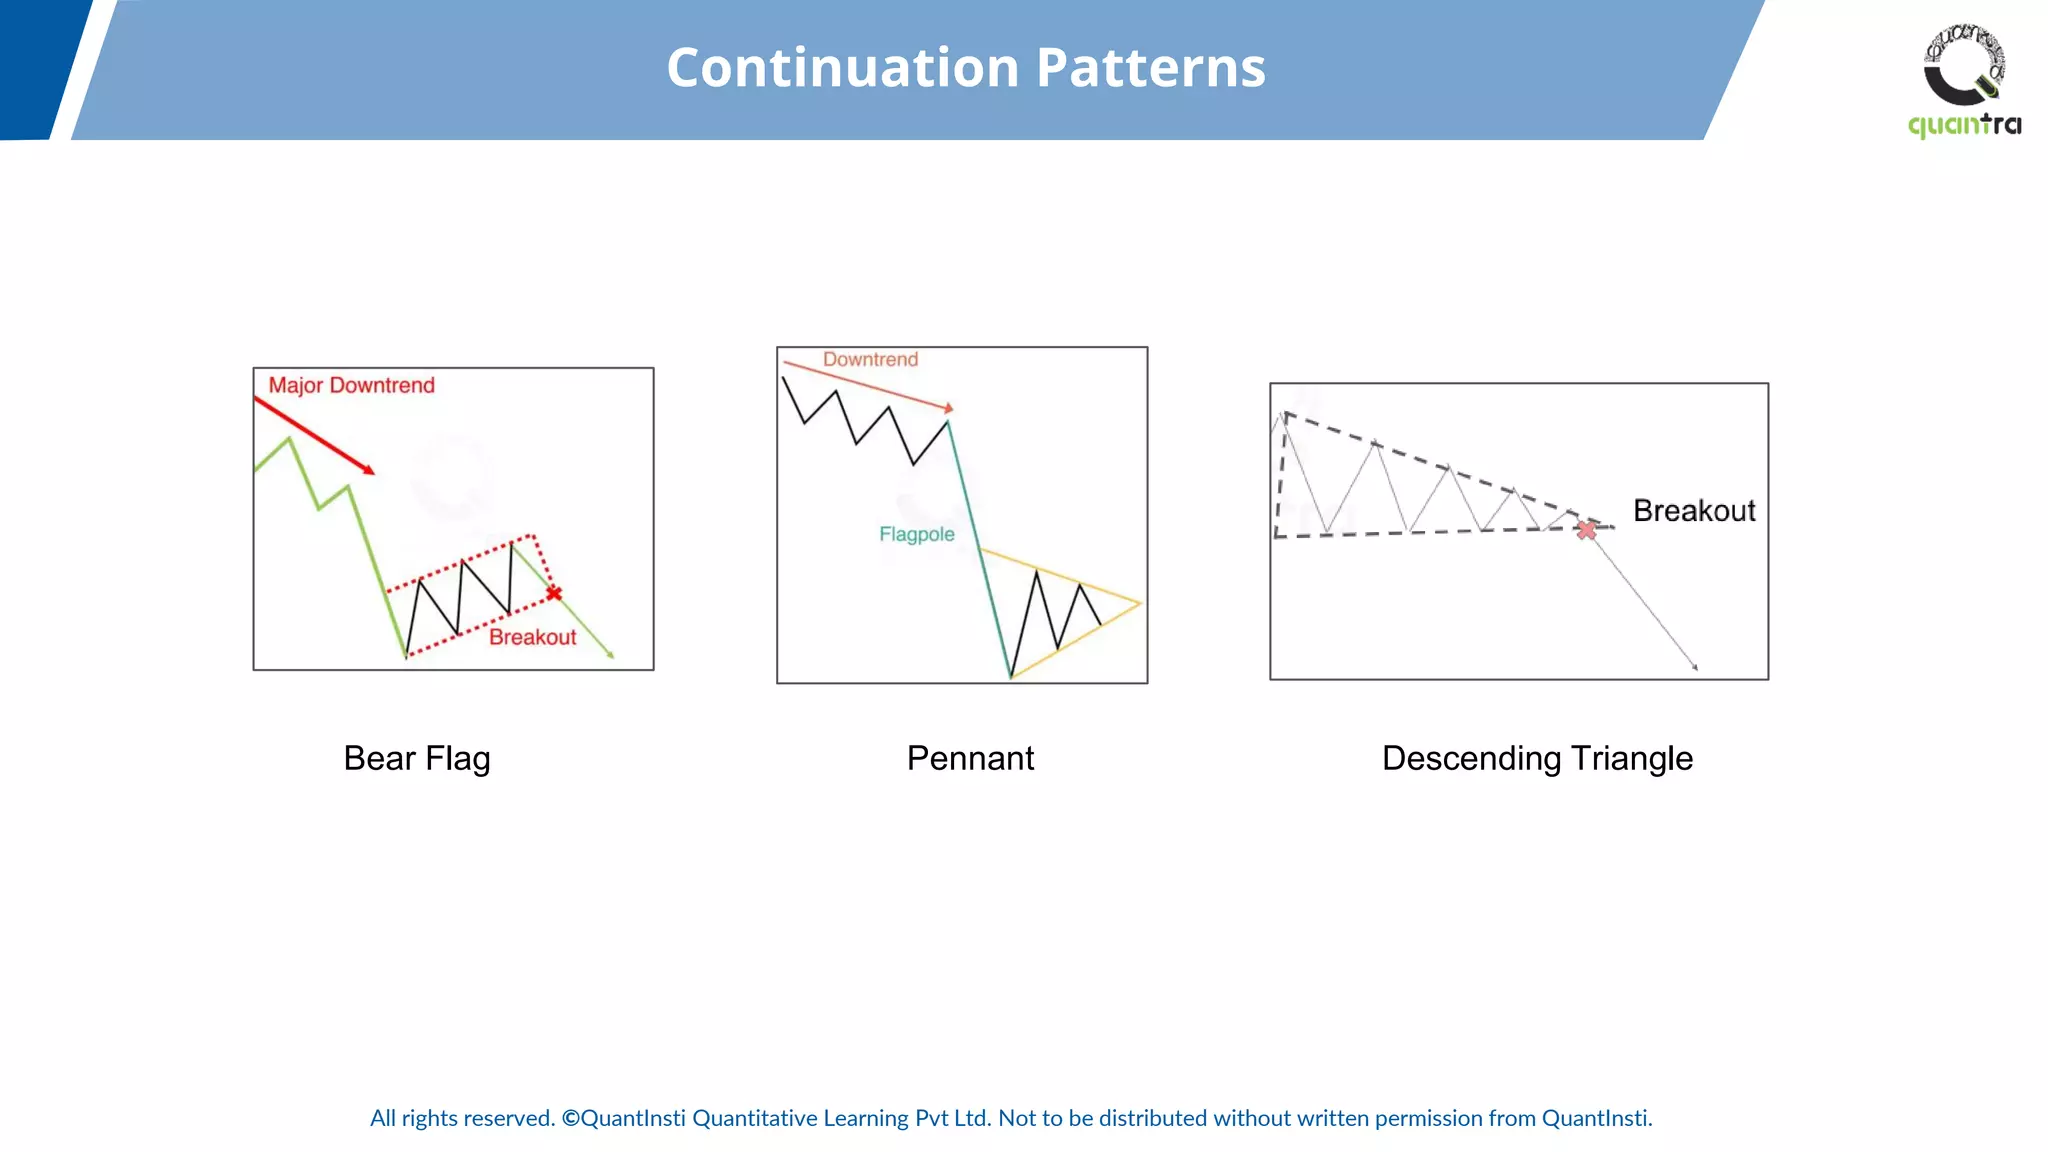

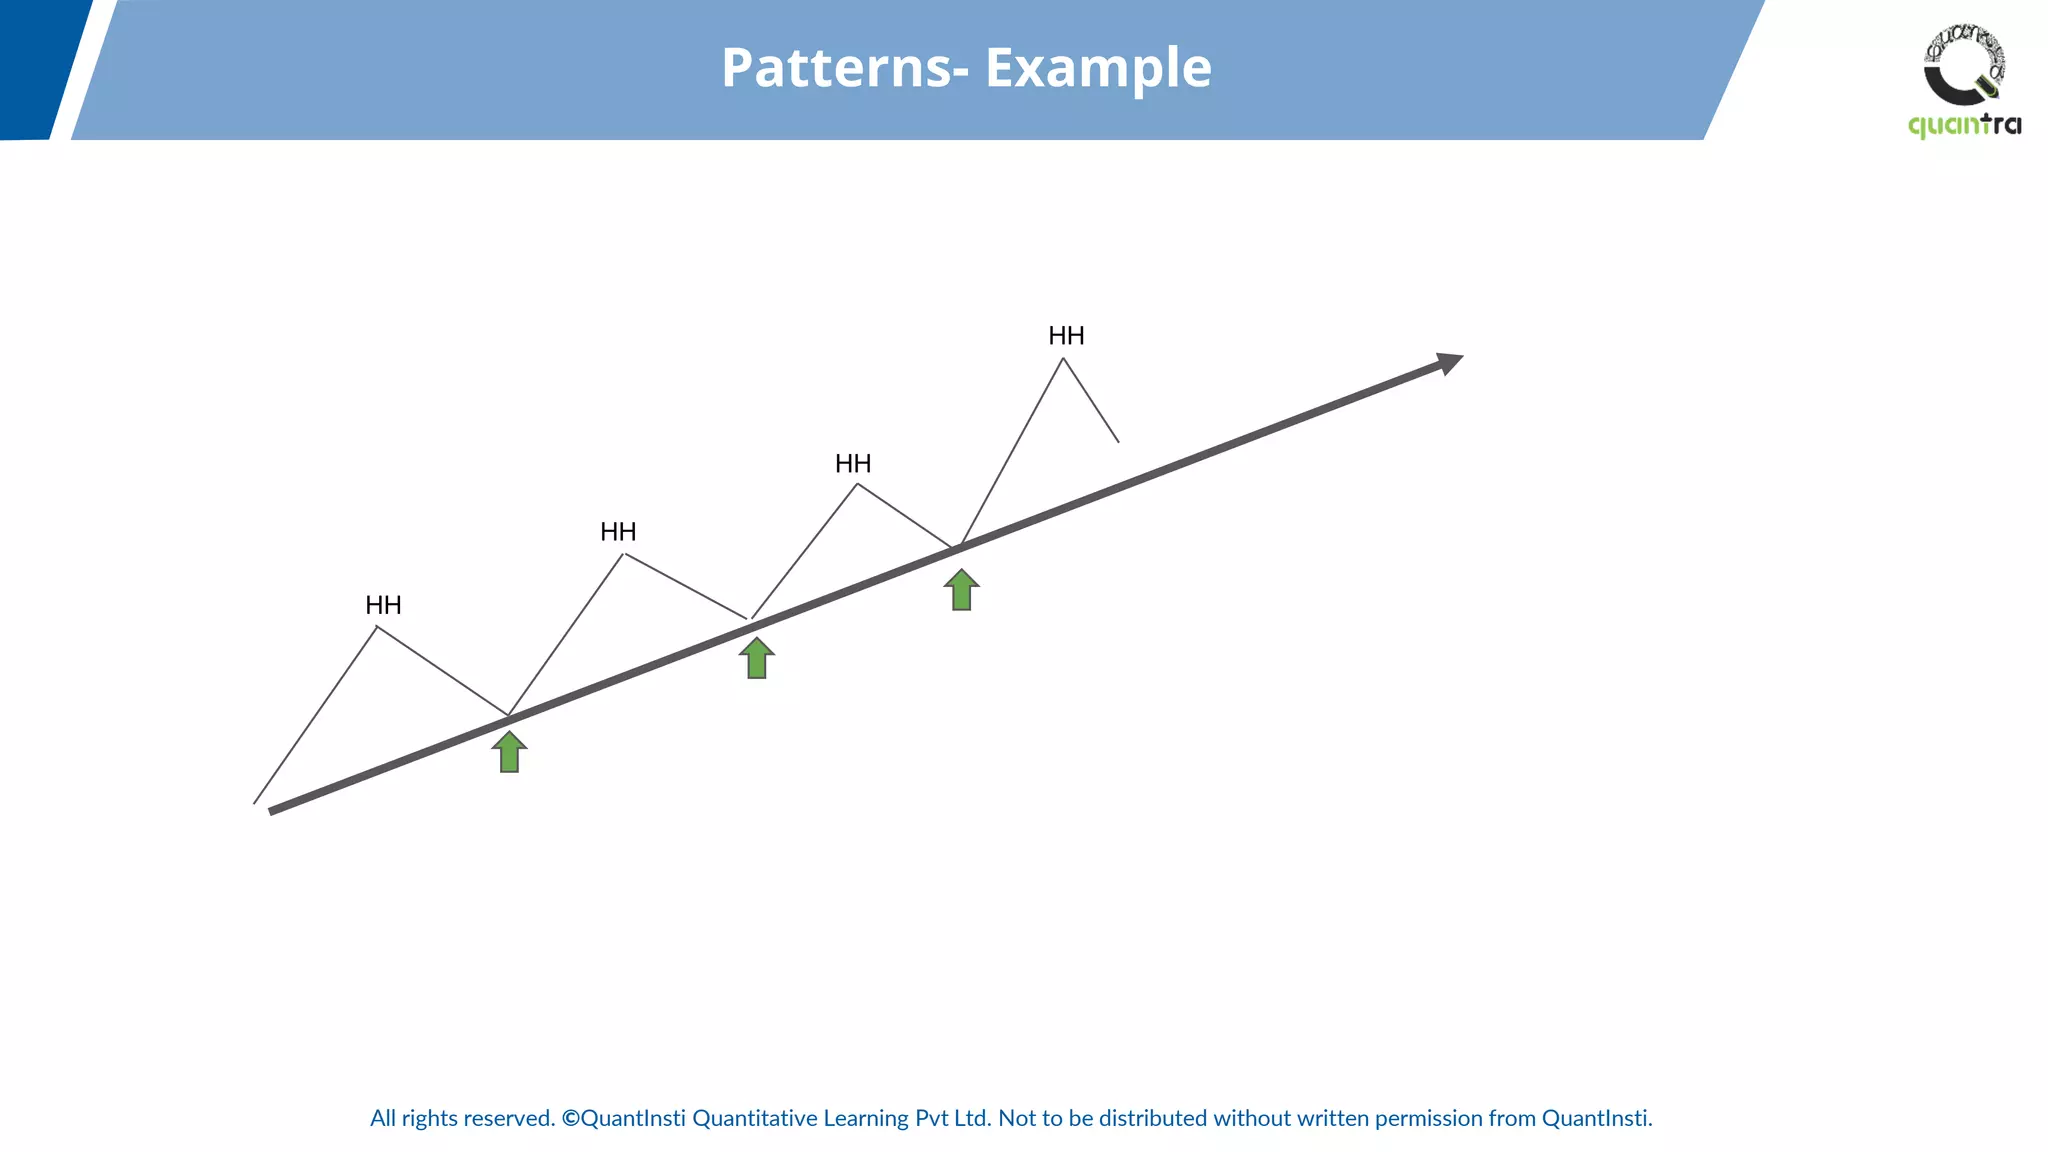
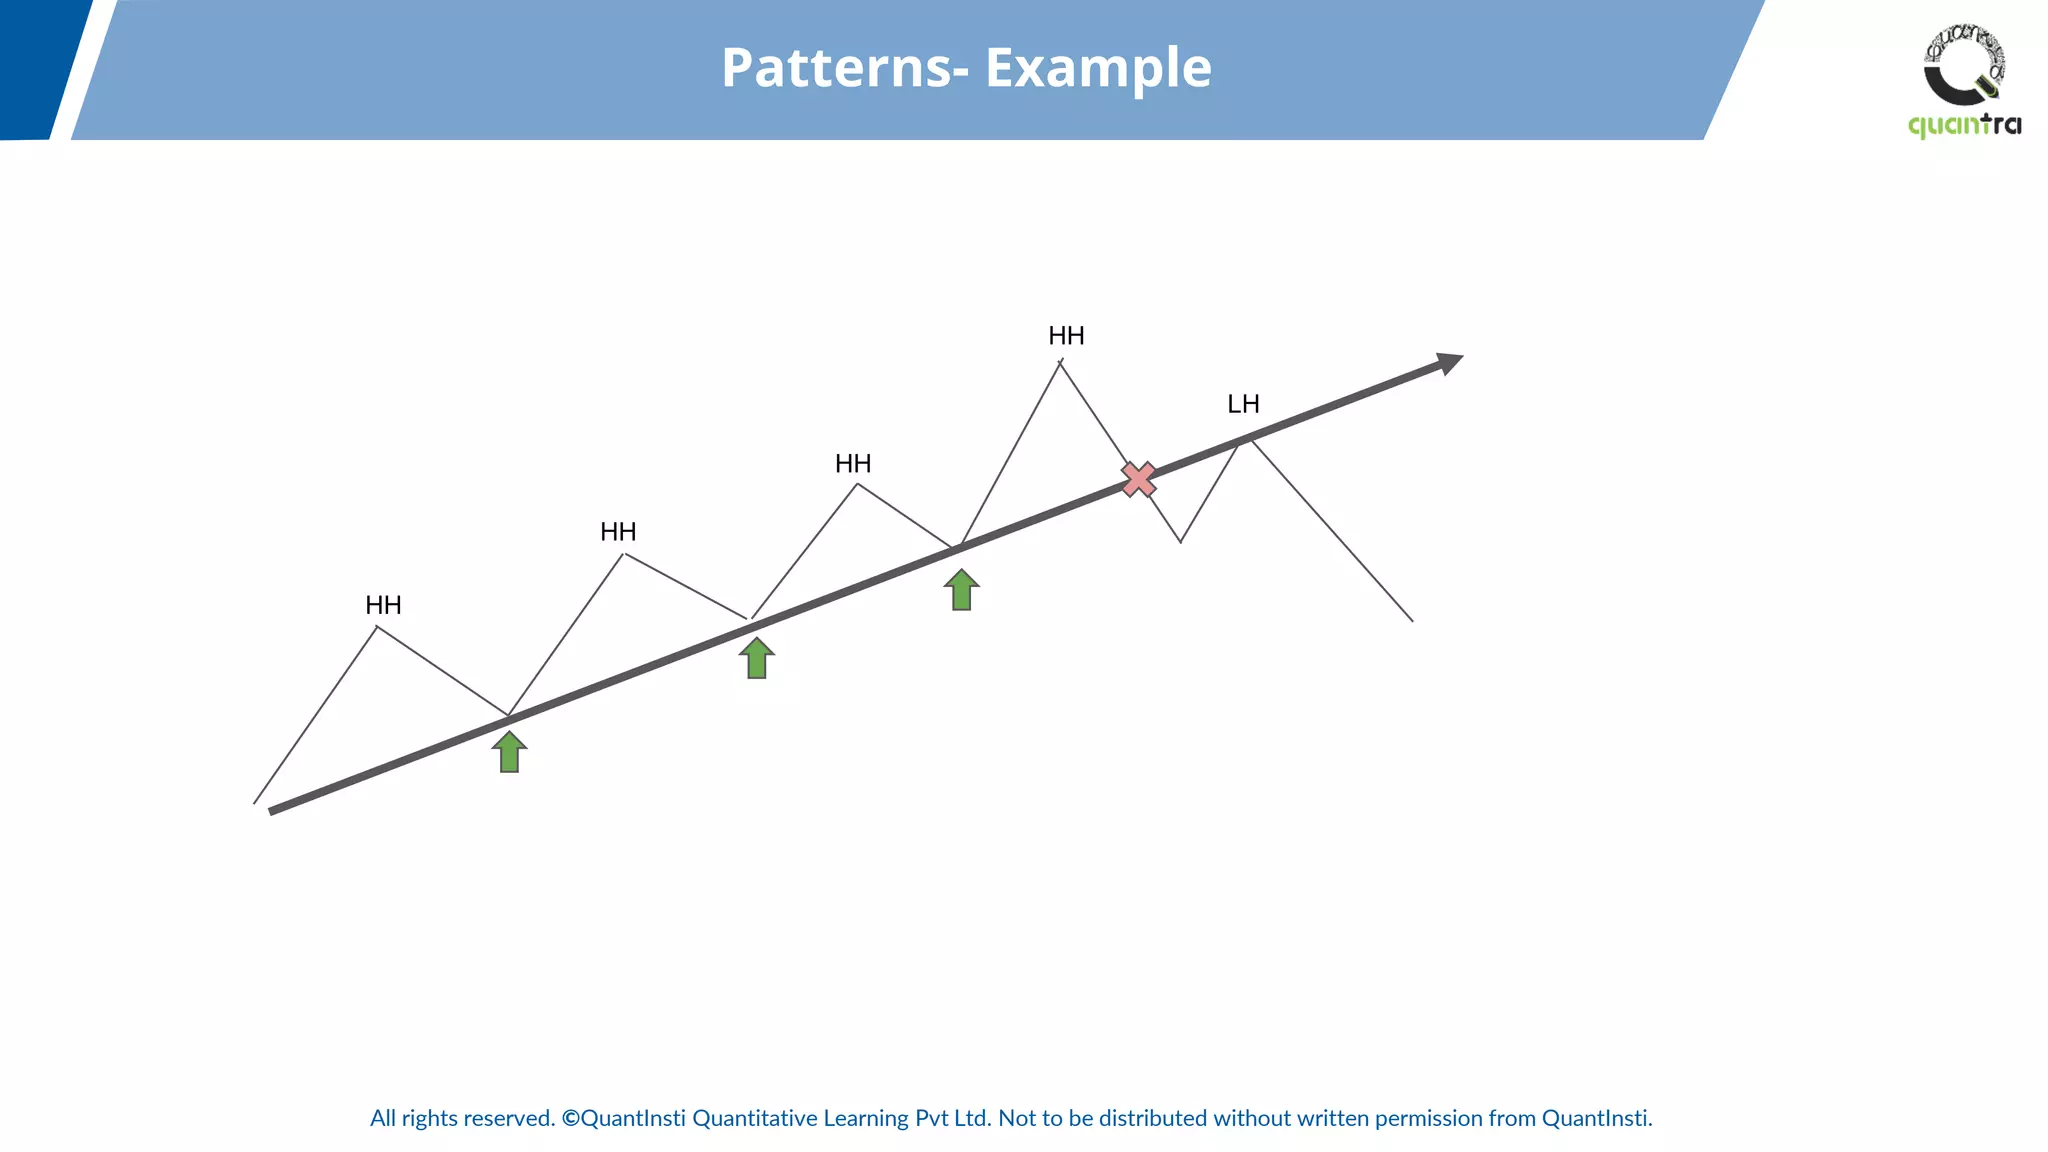
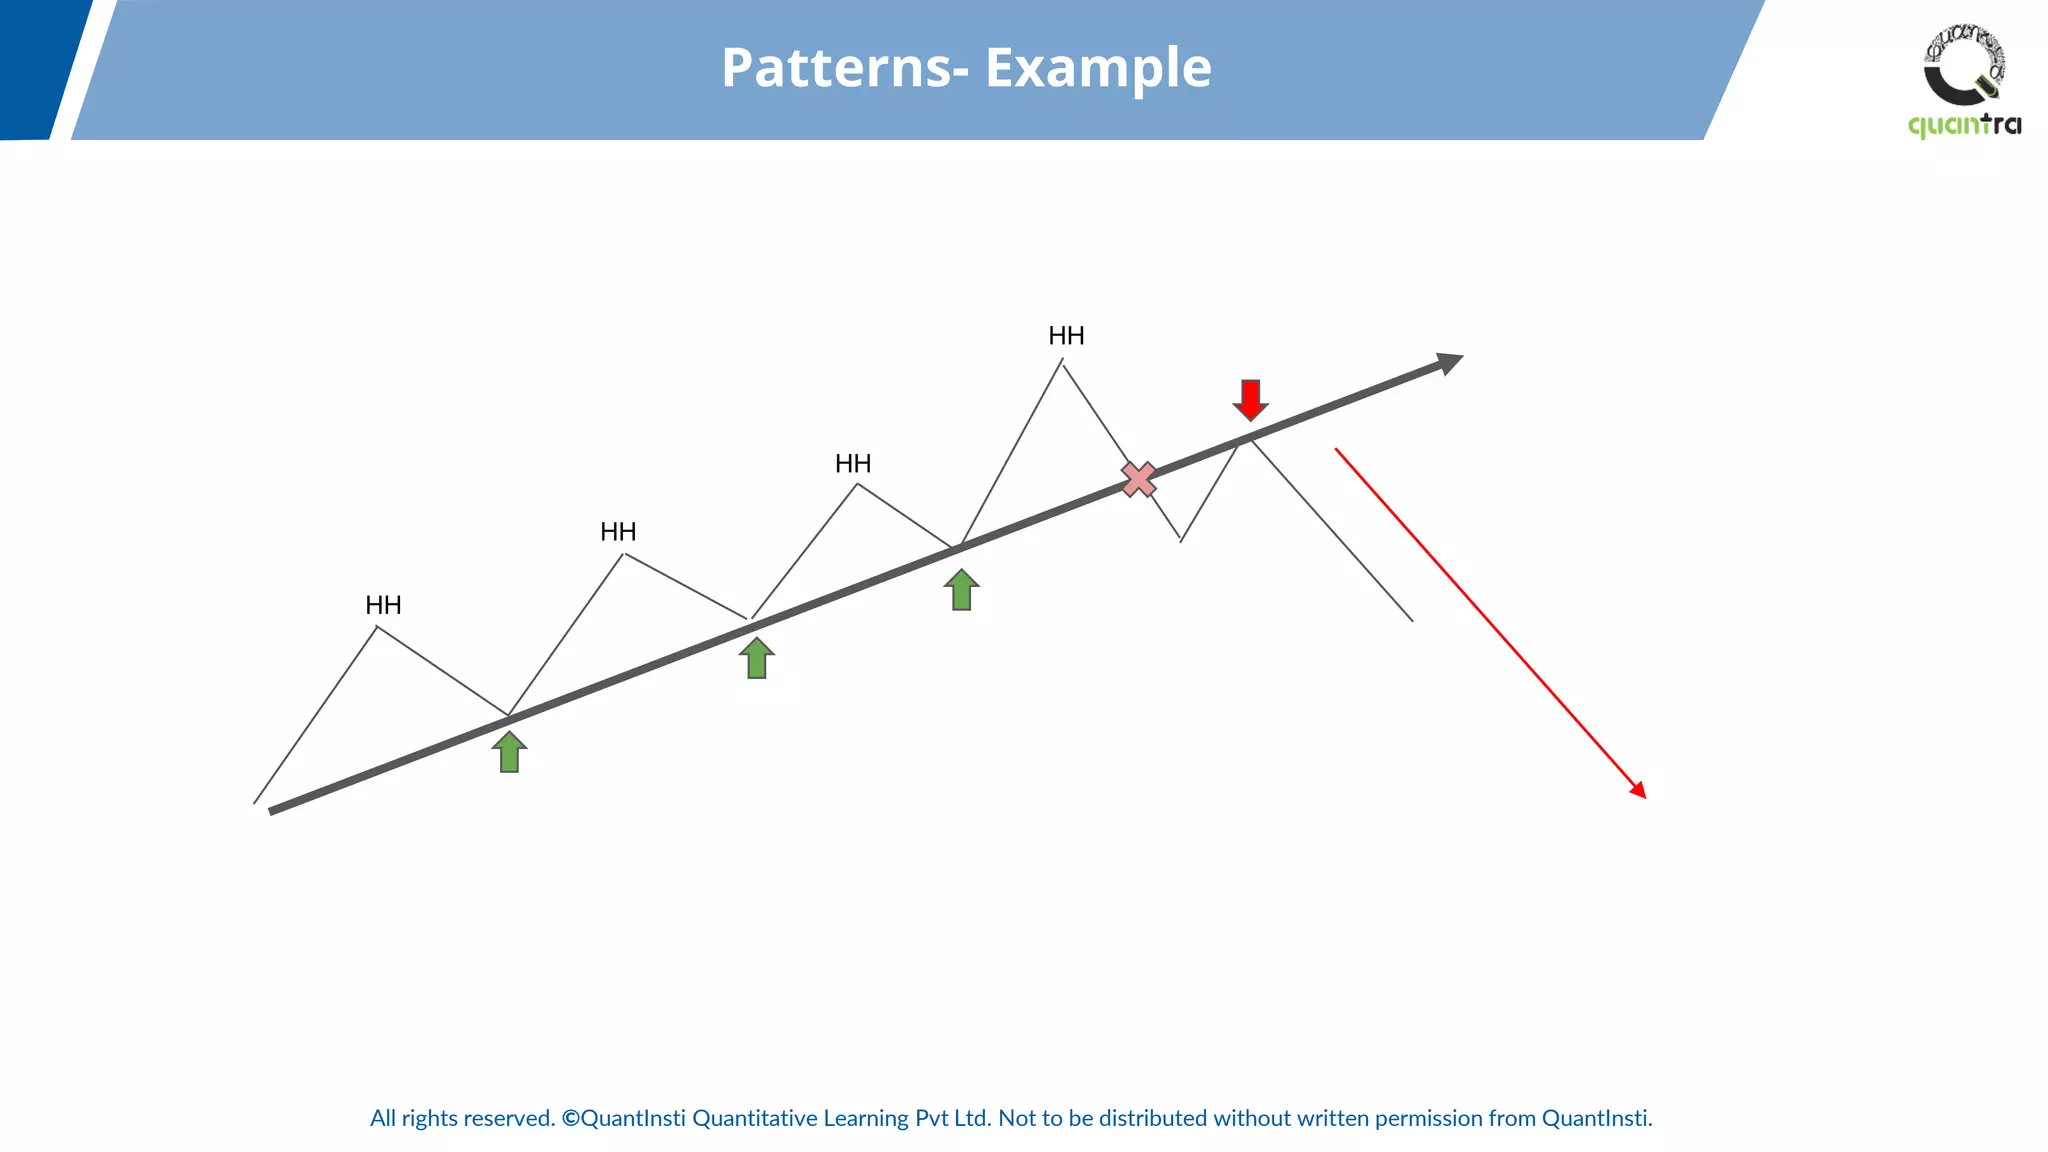
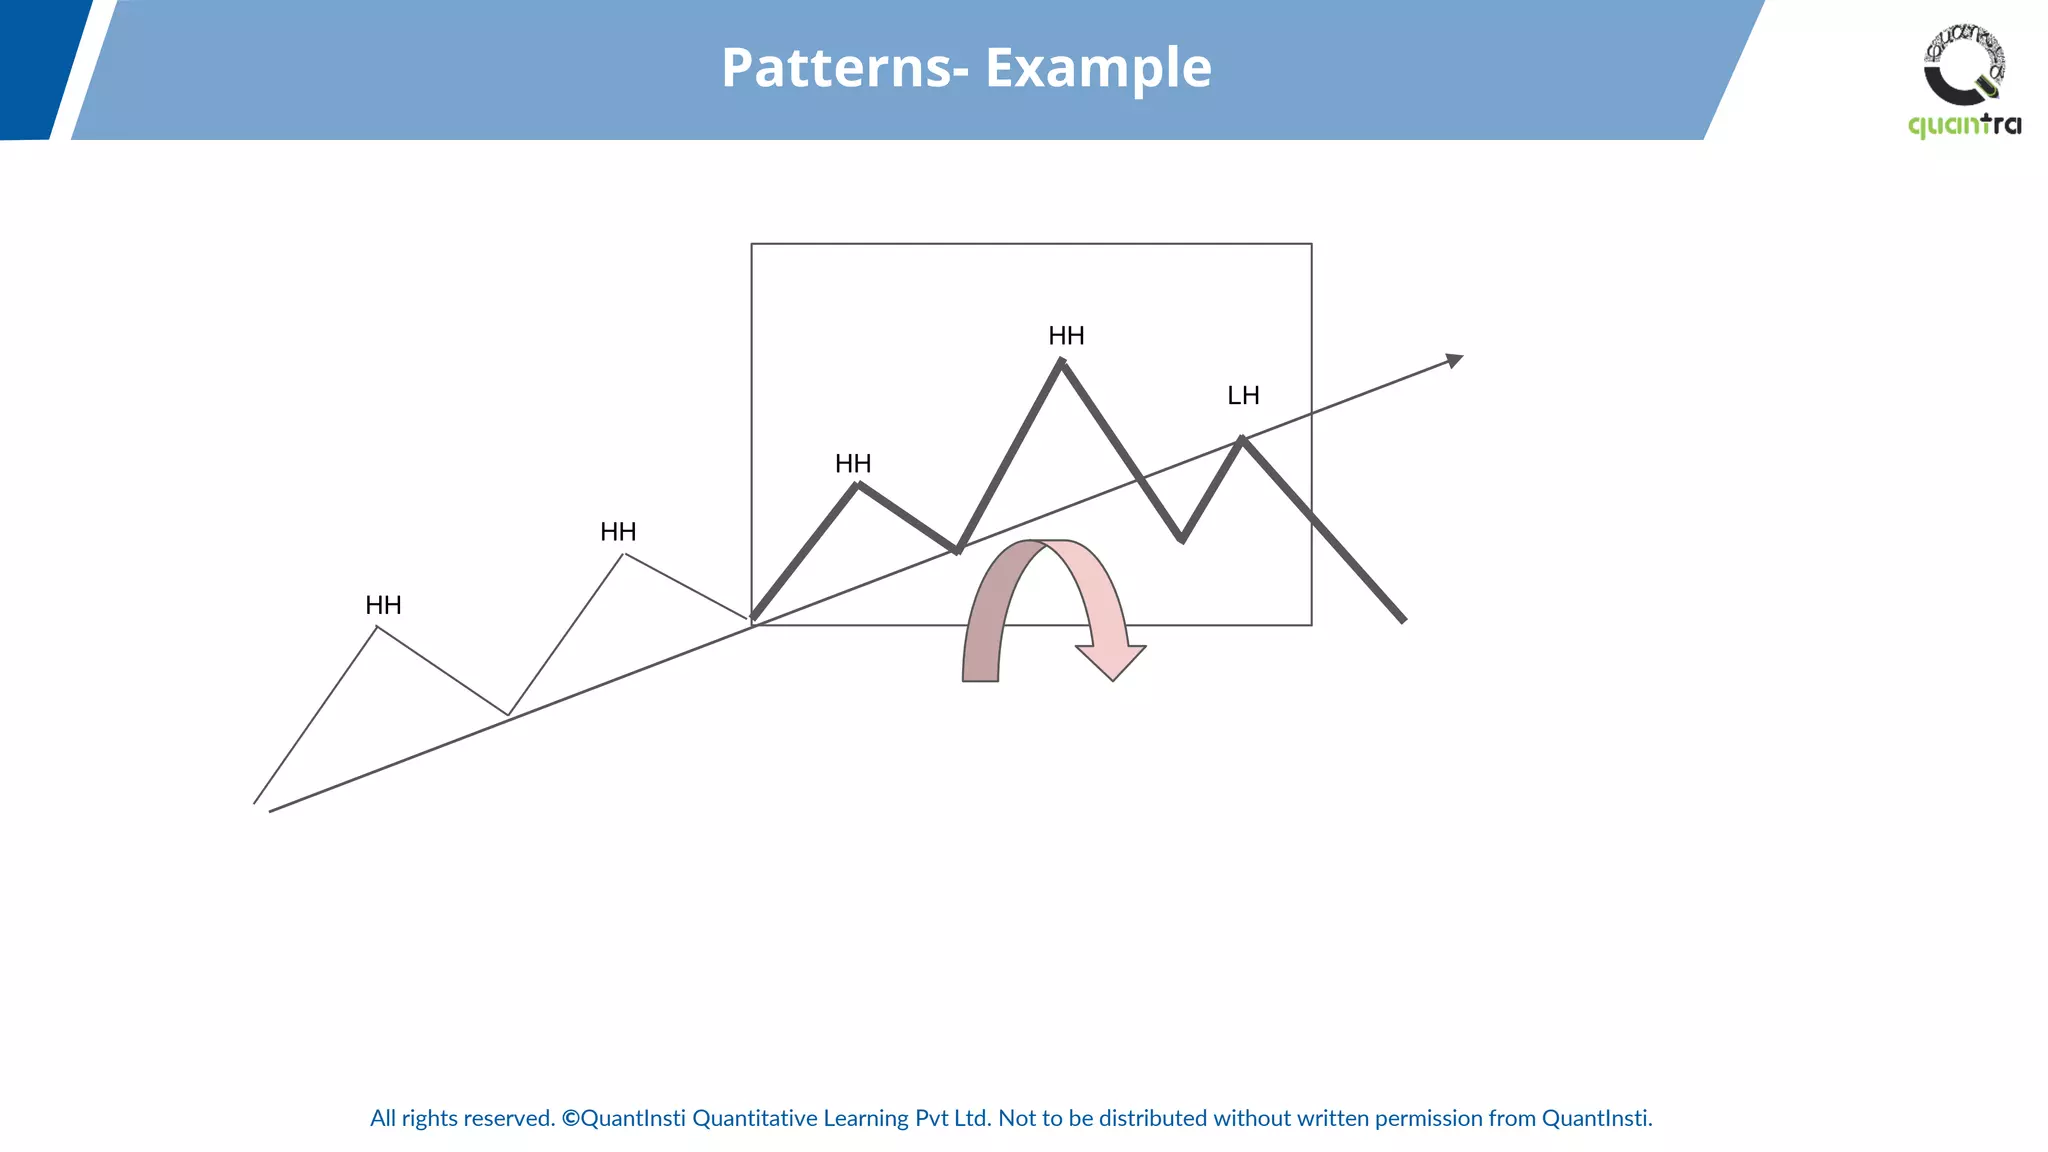
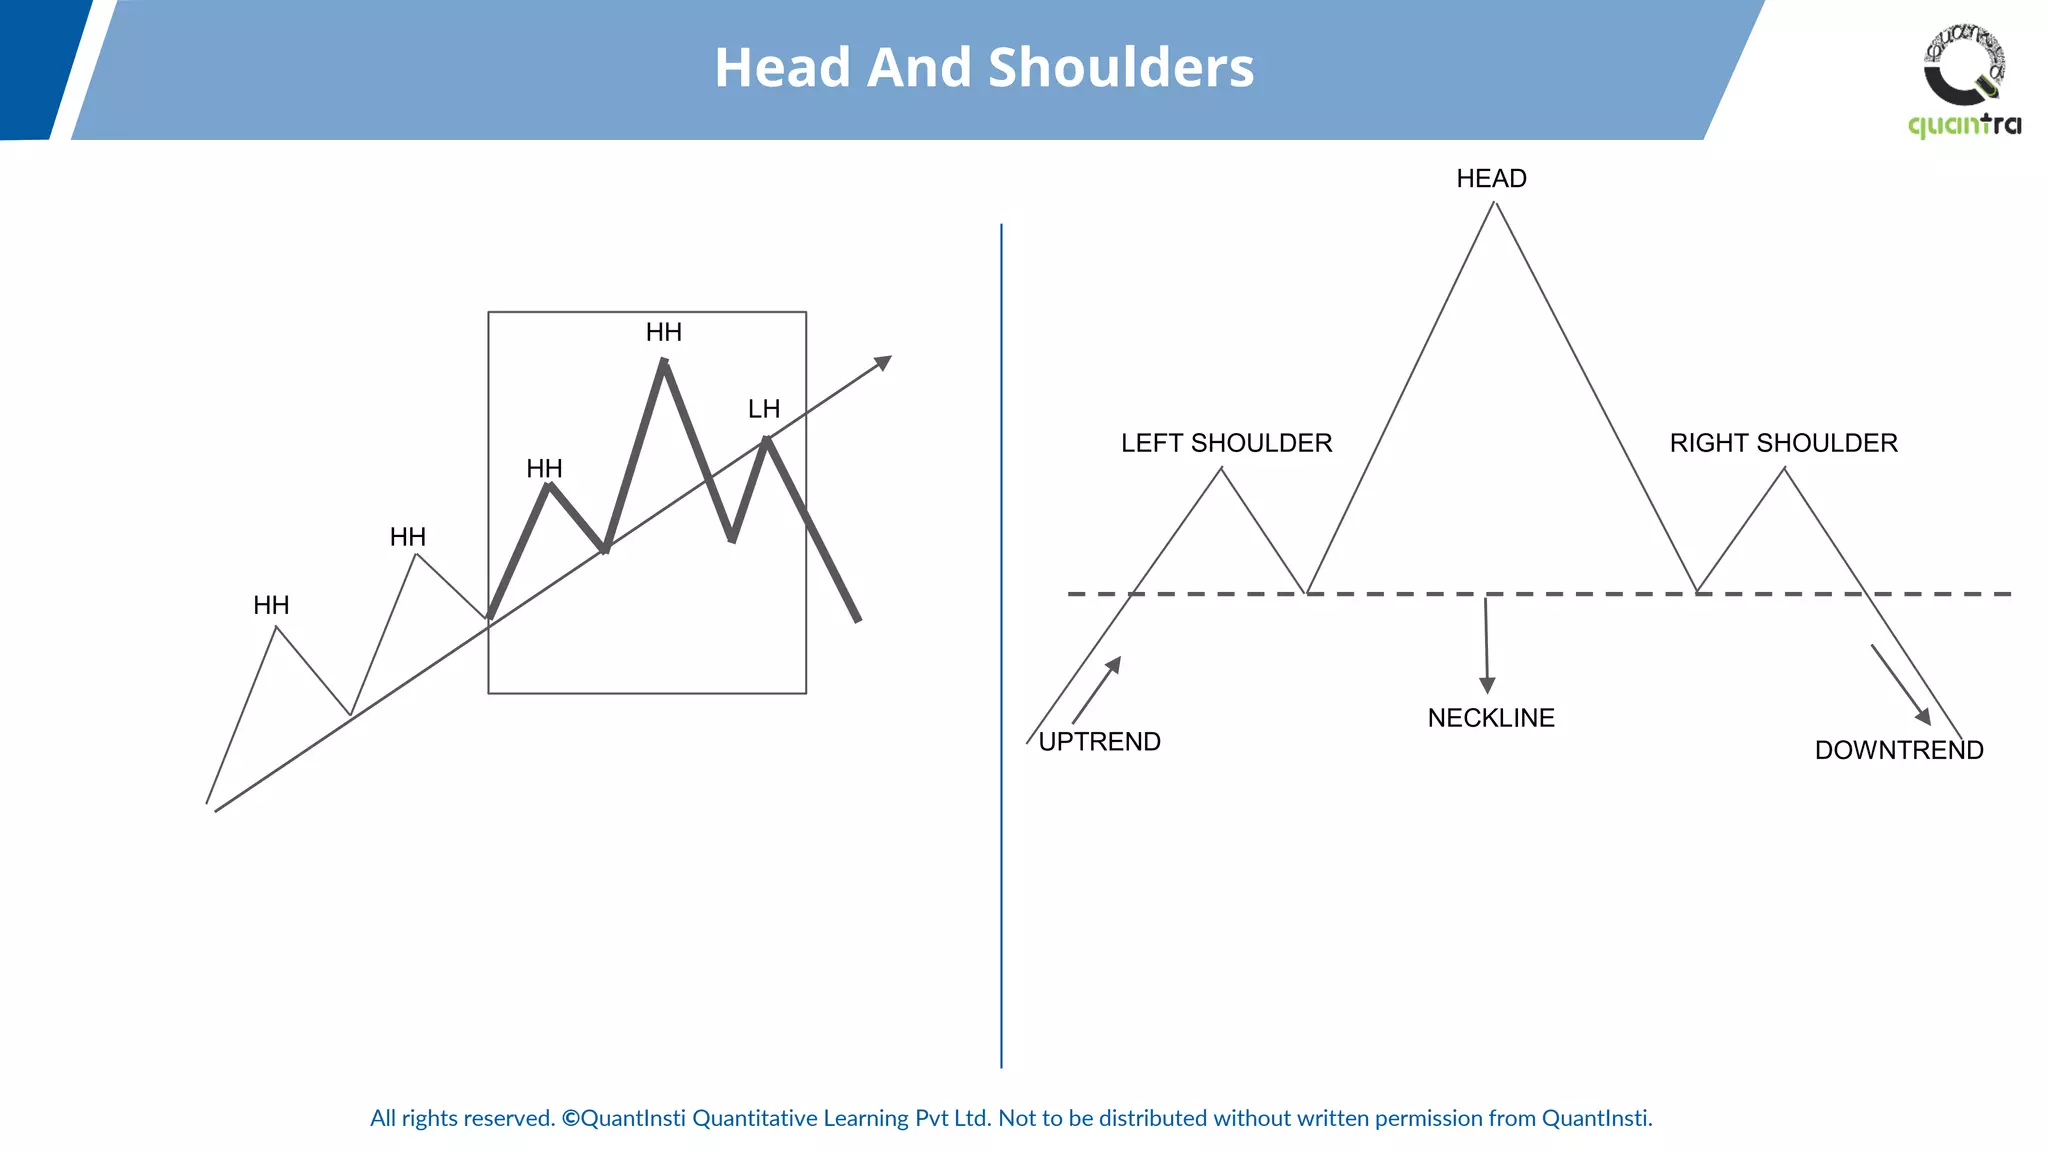


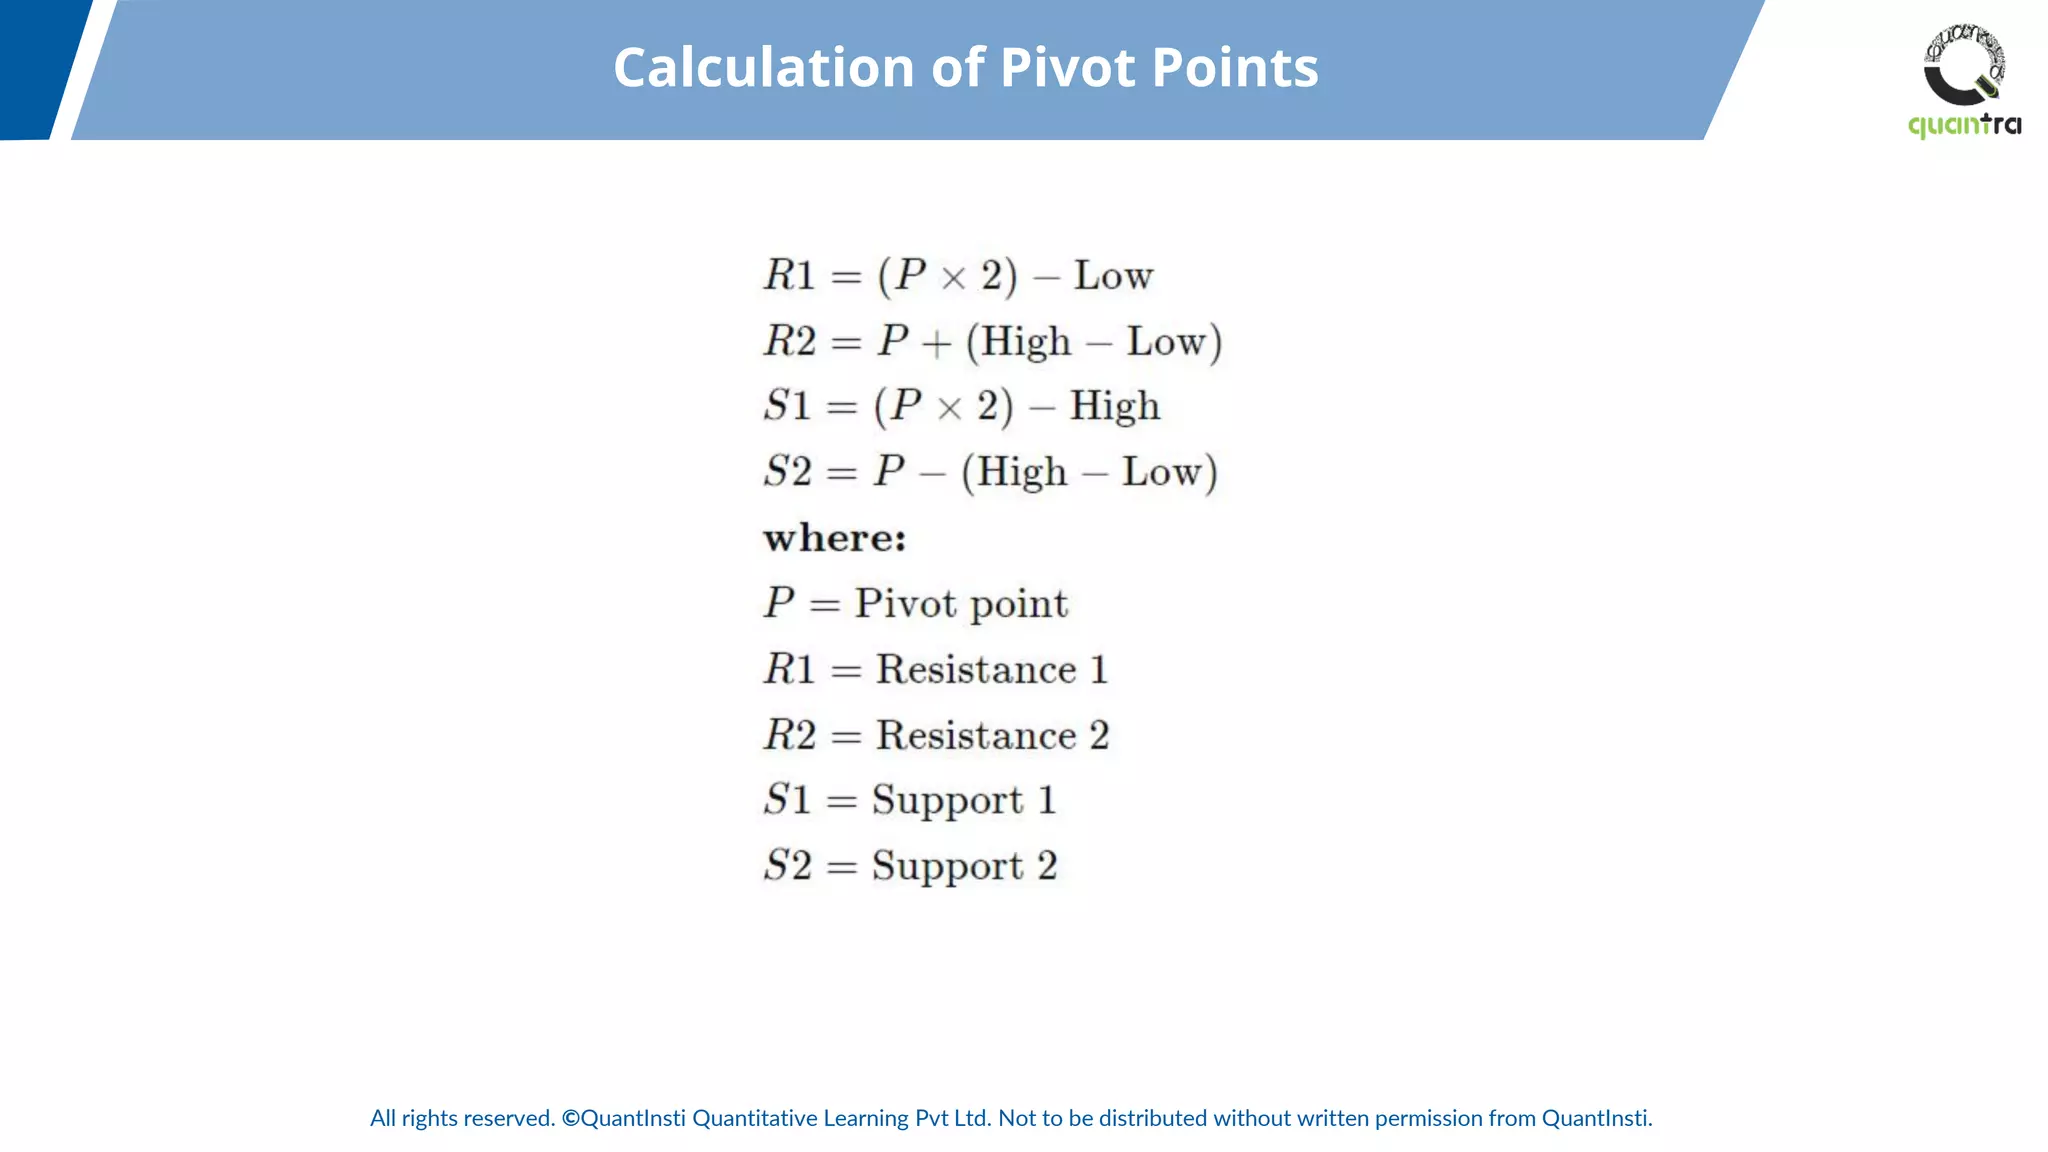
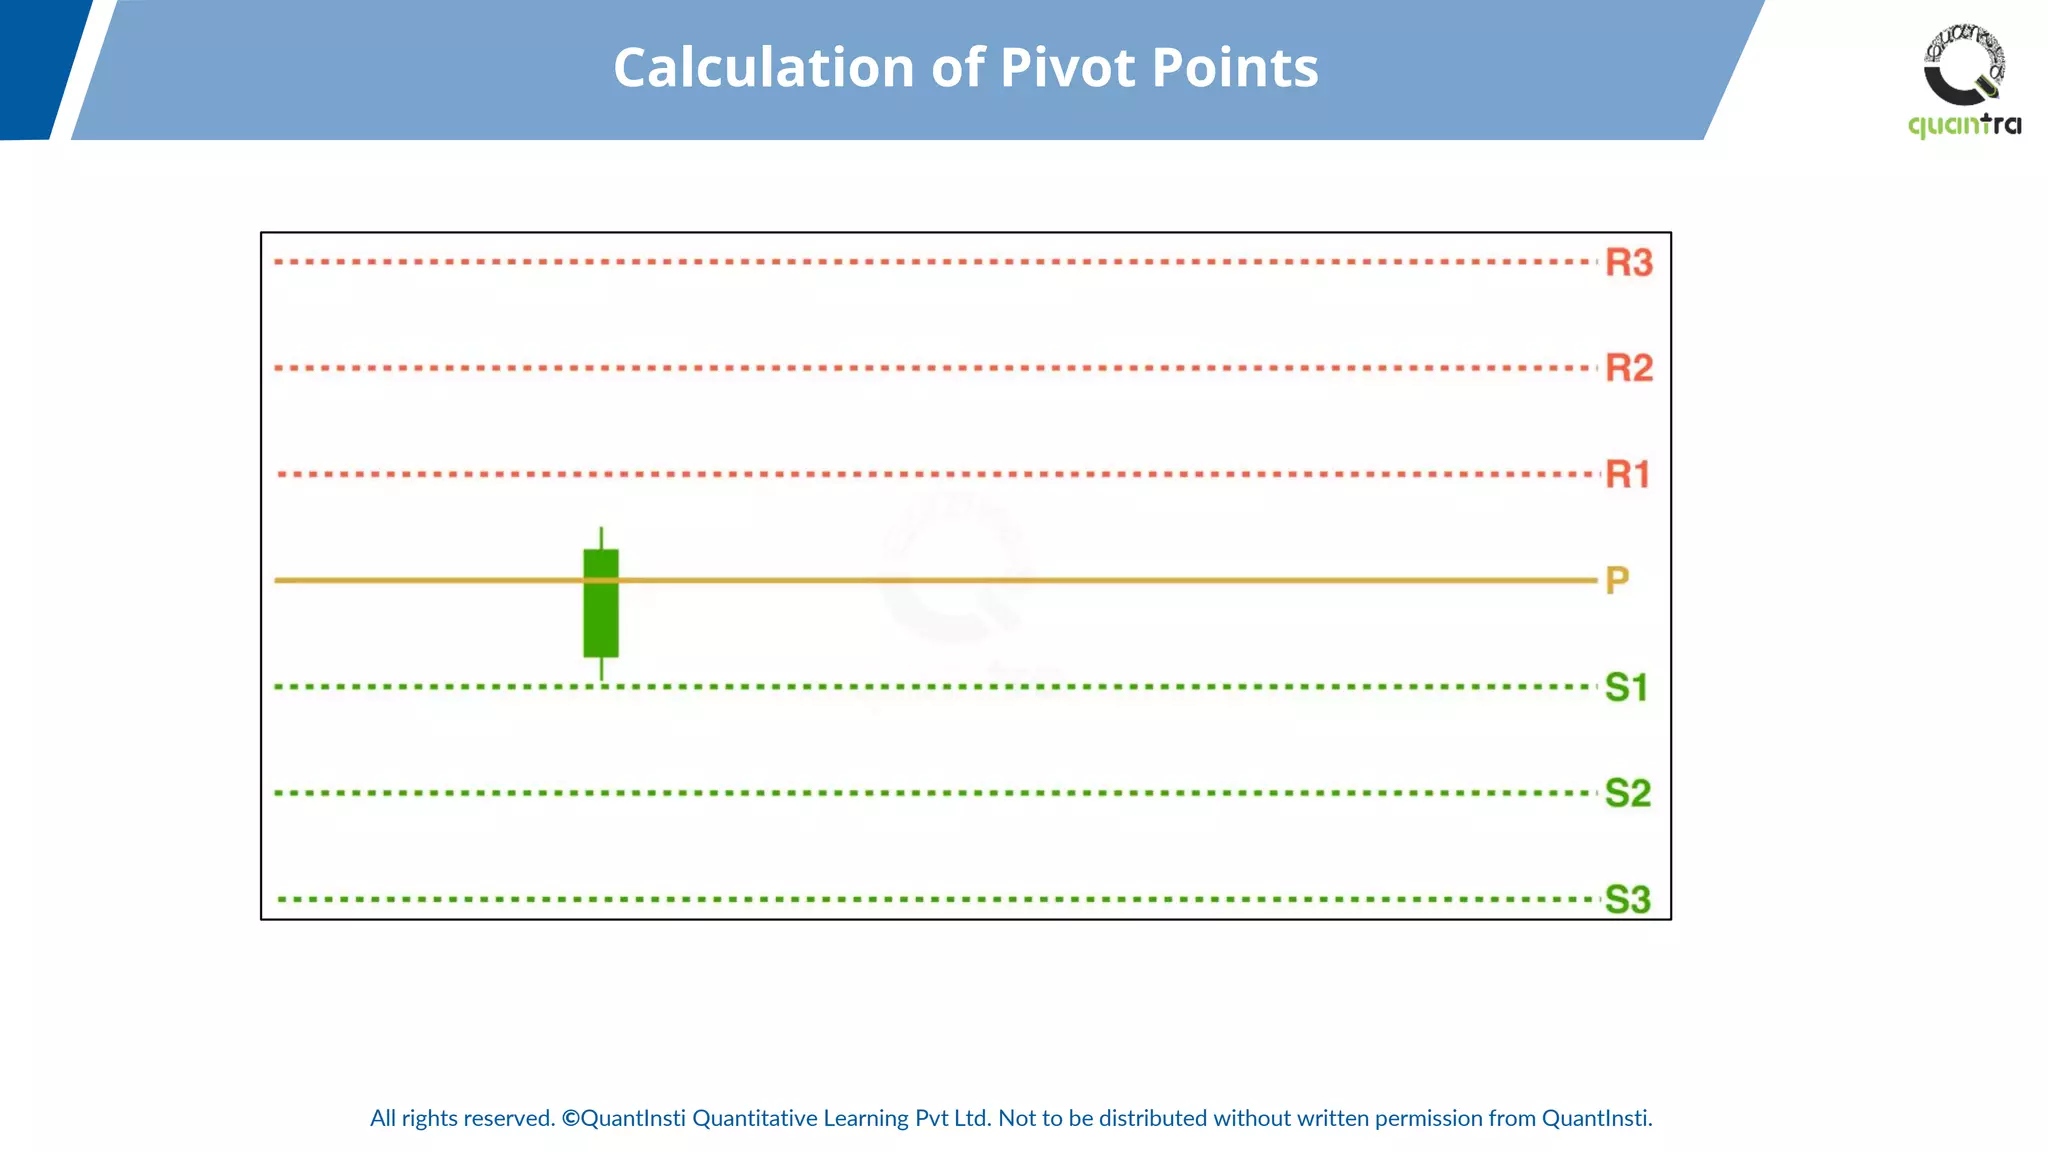


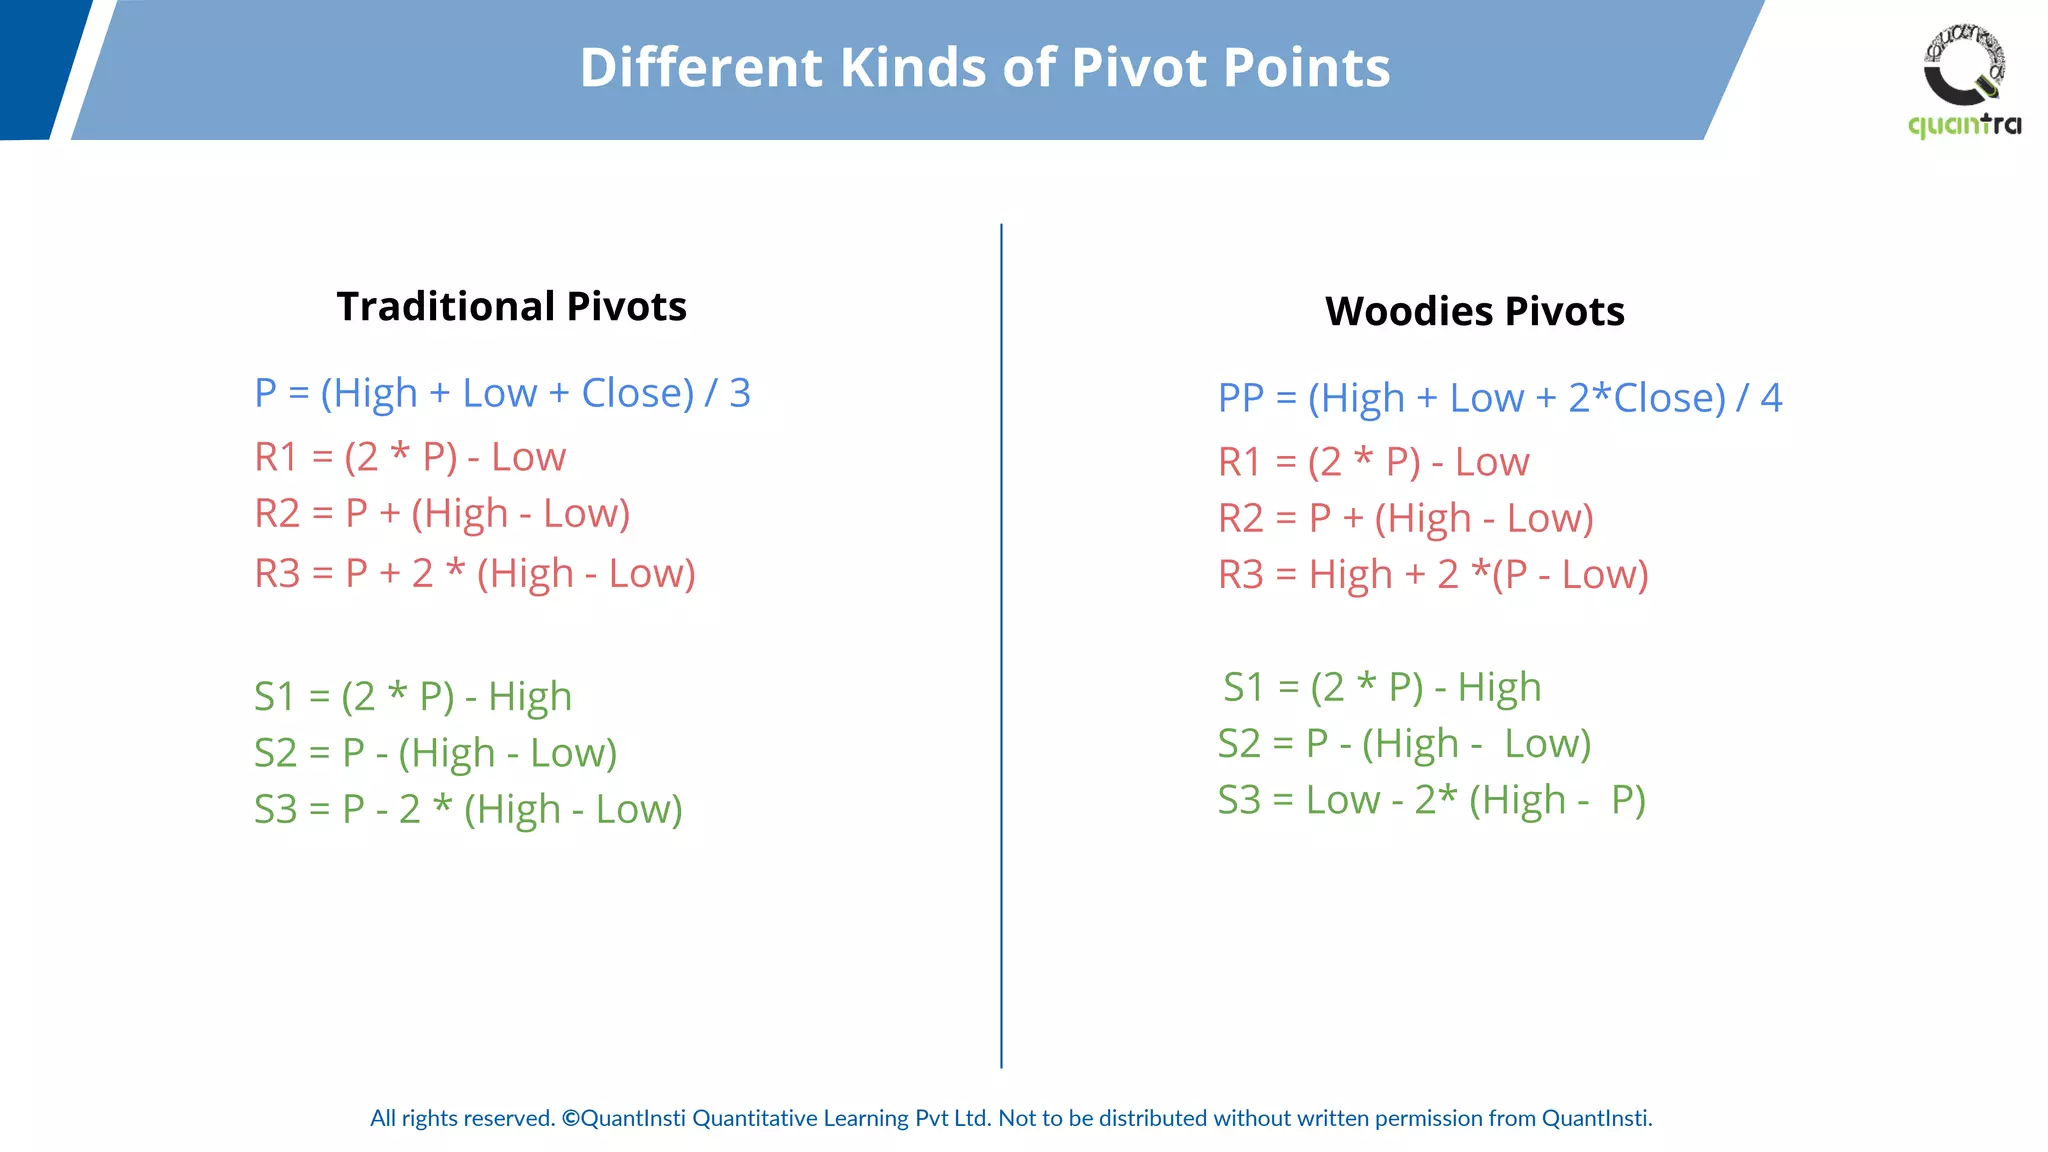
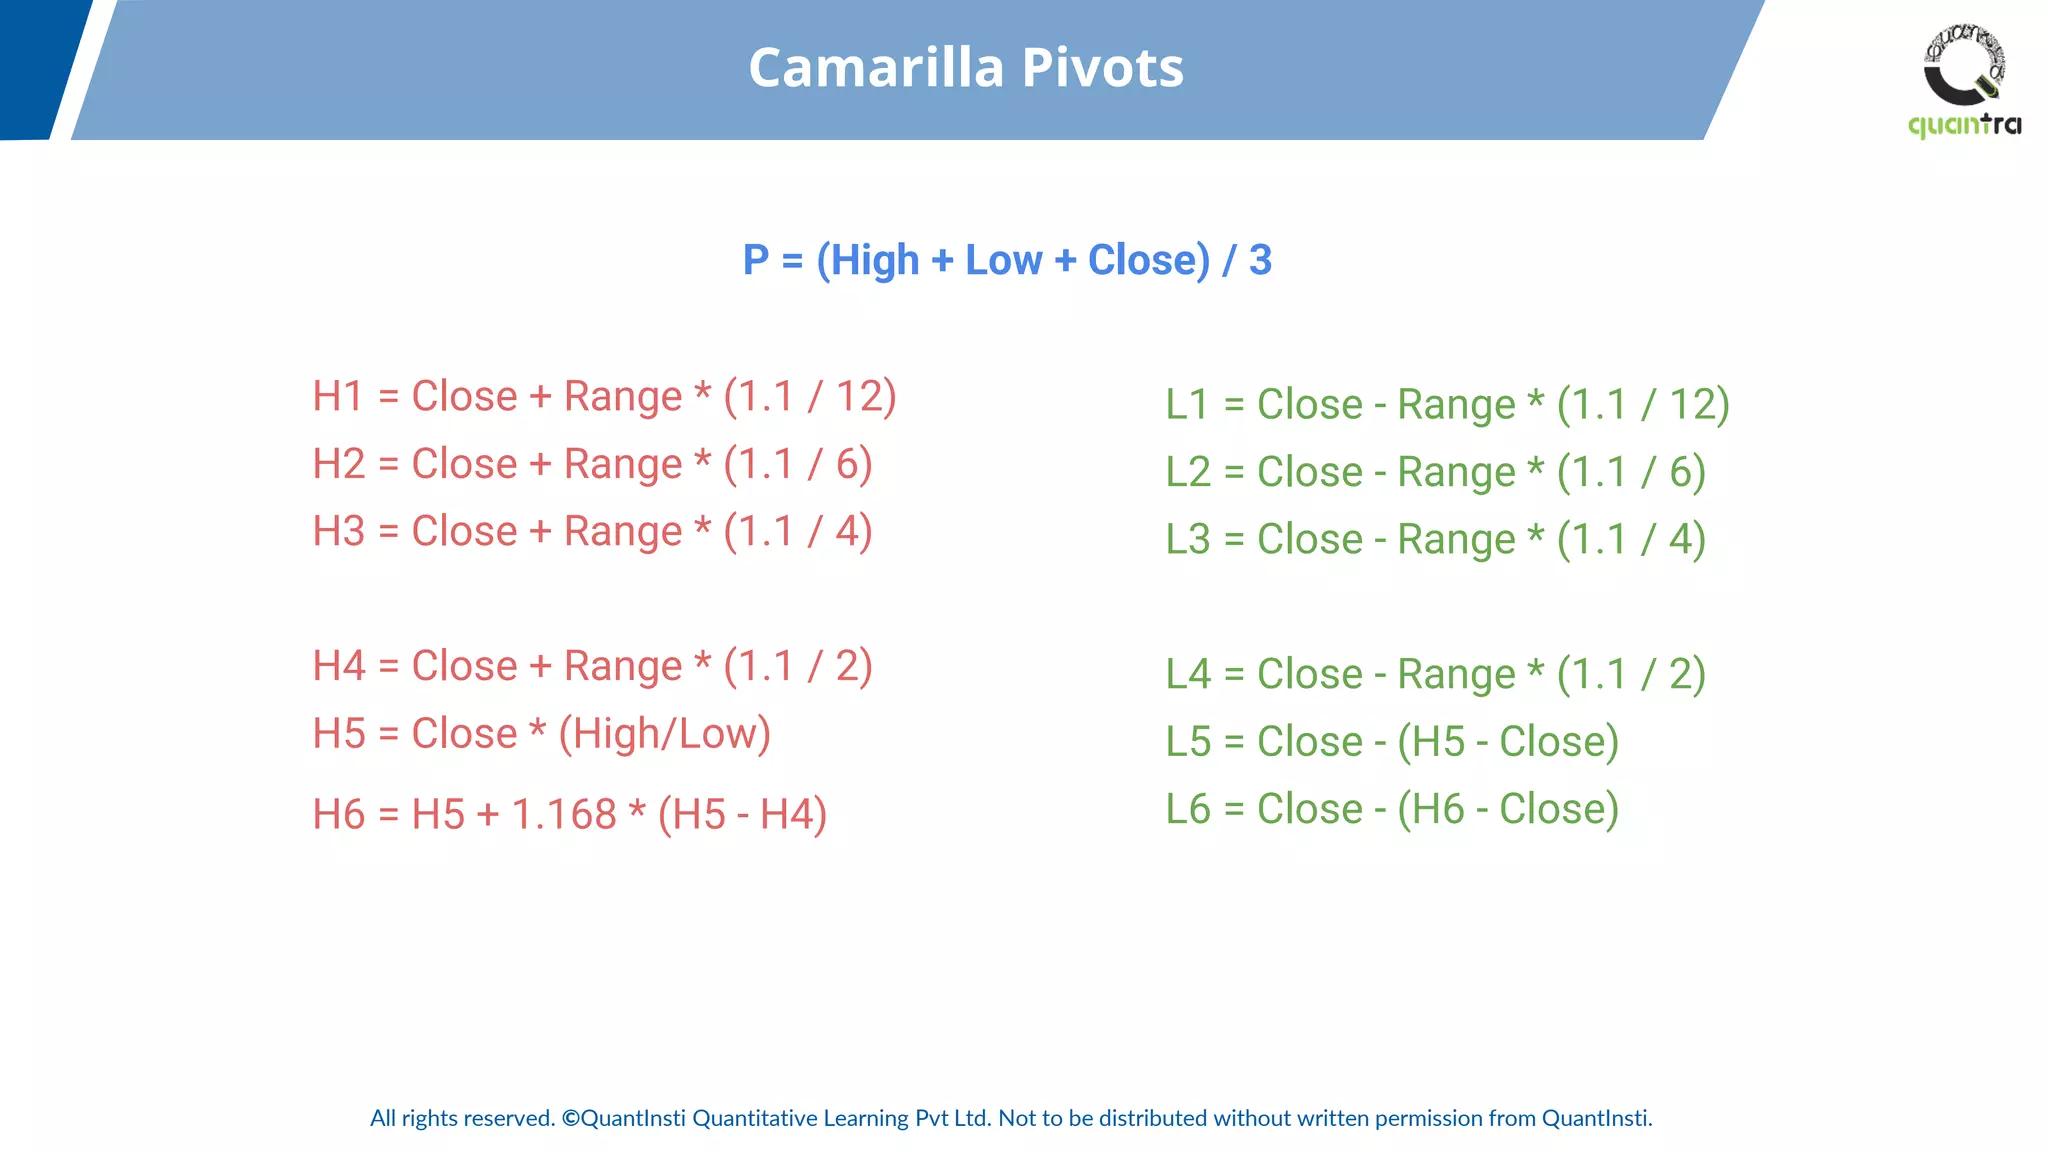
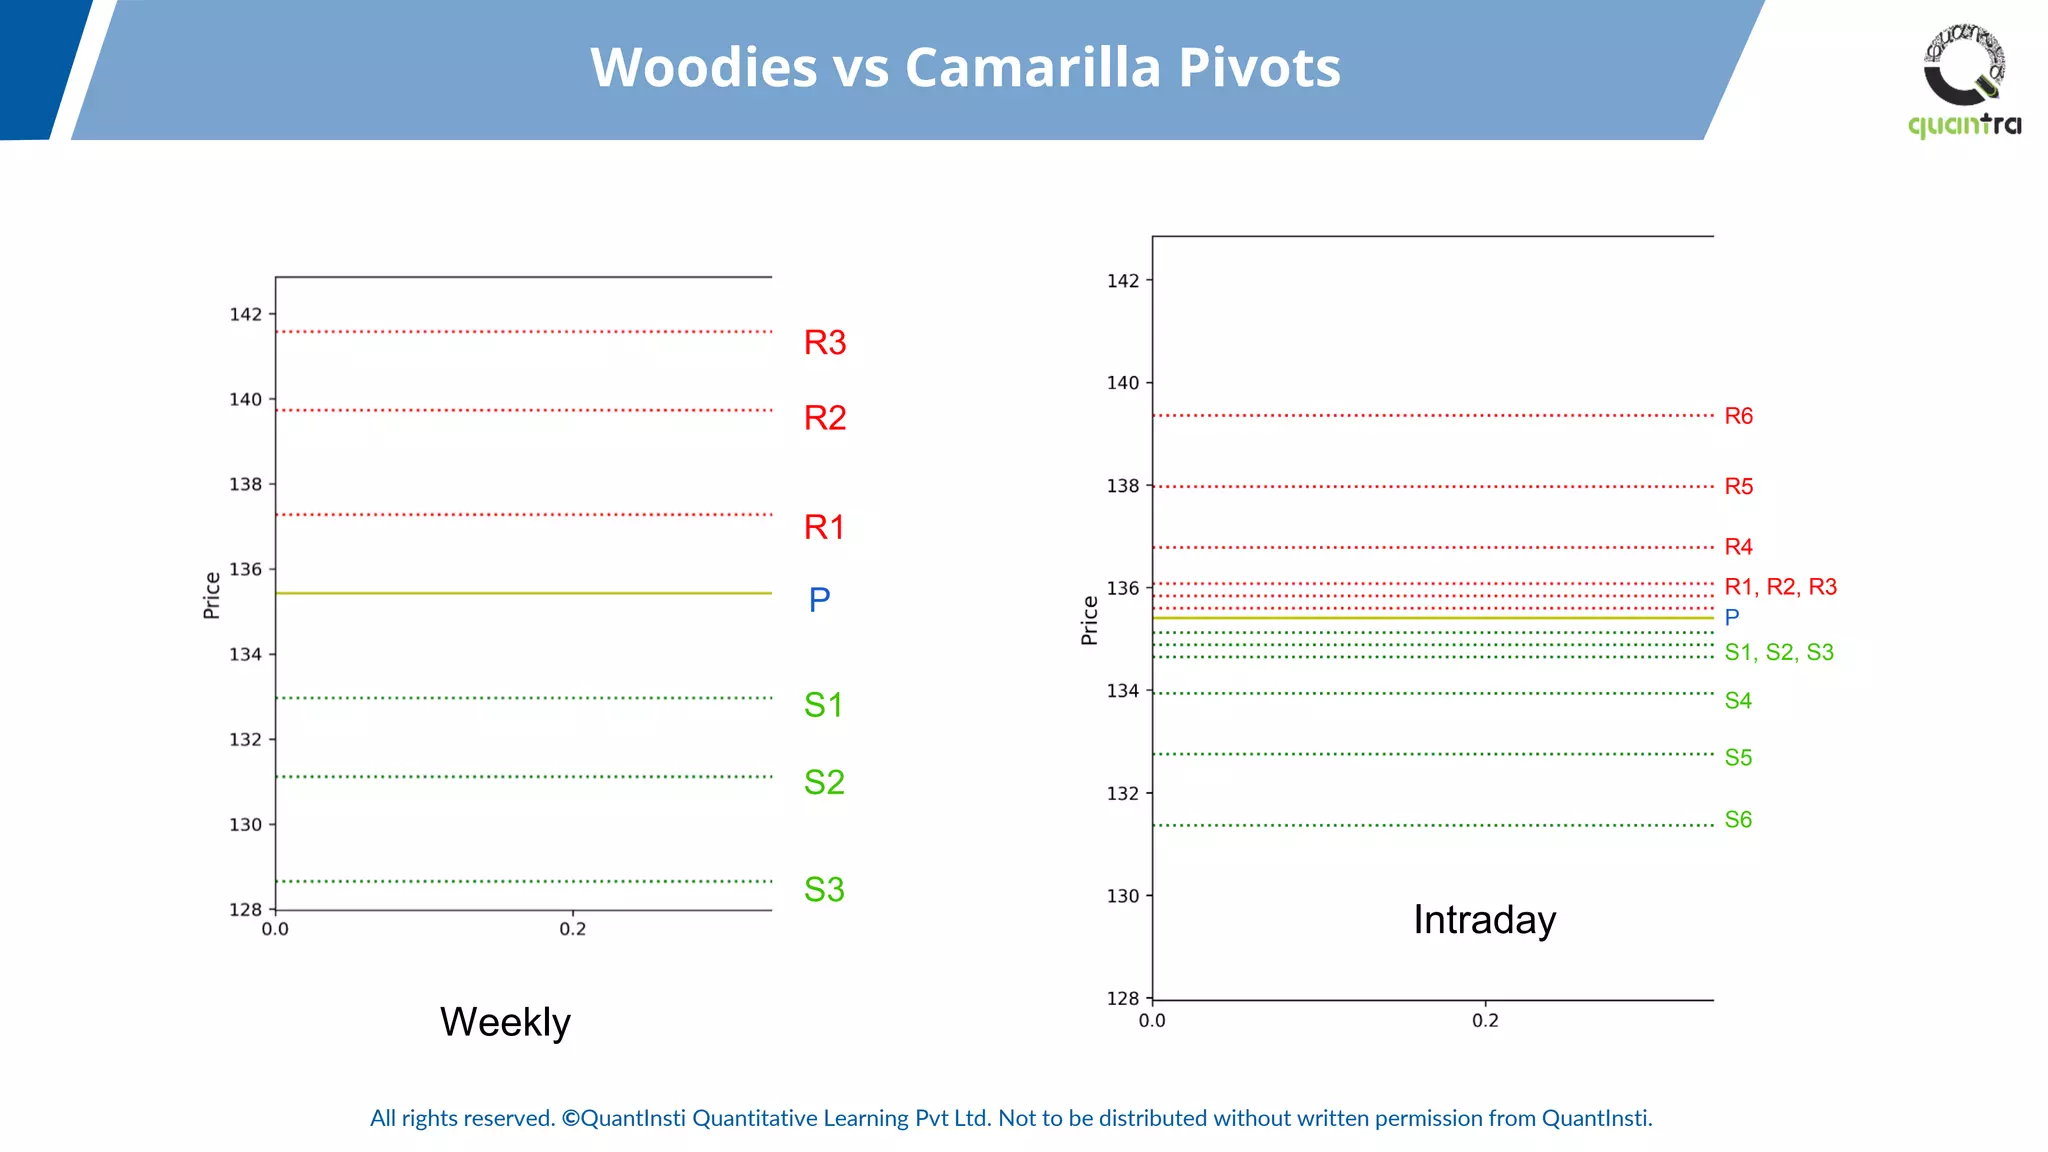


The document provides an introduction to price action trading, emphasizing its foundational concepts, tools, and key patterns utilized by traders. It focuses on the analysis of price behavior without the use of technical indicators, highlighting supply and demand dynamics, support and resistance levels, and various chart patterns such as reversal and continuation patterns. Additionally, it discusses the calculation and significance of pivot points in trading decisions.


![Support and-resistance-simplified[1]](https://cdn.slidesharecdn.com/ss_thumbnails/support-and-resistance-simplified1-120113122100-phpapp01-thumbnail.jpg?width=640&height=640&fit=bounds)


