This document discusses direct and inverse proportions.
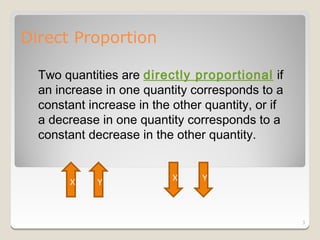
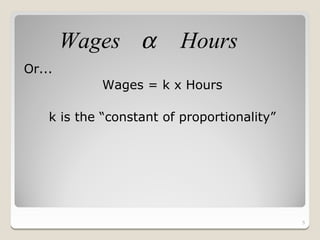
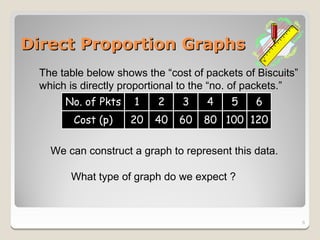
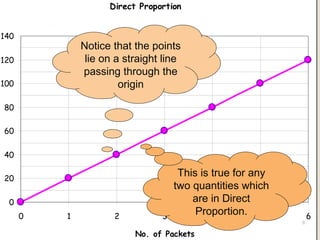
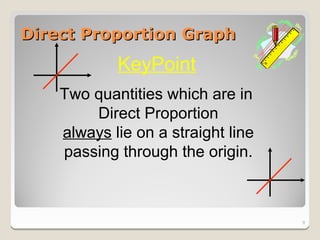
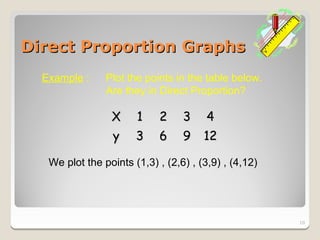
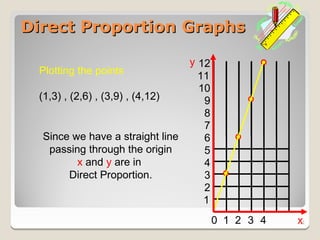
Direct proportion means that as one quantity increases, the other increases by the same ratio. They form a straight line graph passing through the origin.
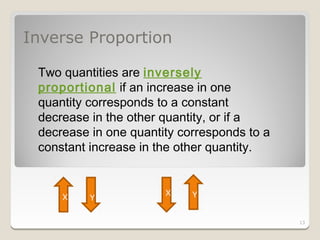
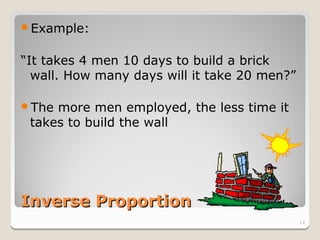
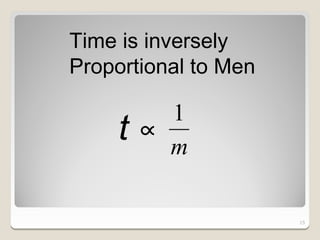
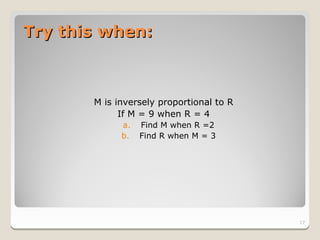
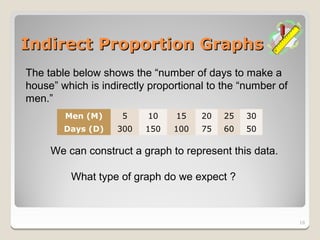
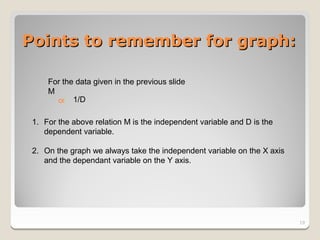
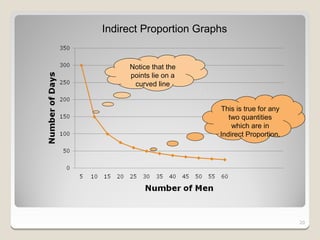
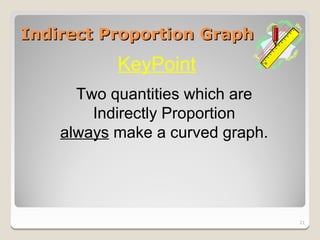
Inverse proportion means that as one quantity increases, the other decreases. The quantities are inversely related by a constant factor. Their relationship forms a curved line graph.
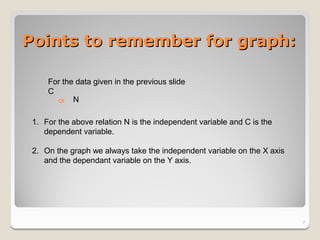
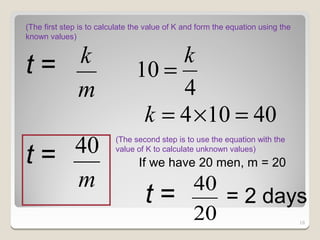
Examples of direct and inverse proportions are provided along with their equation representations and graphs. Key features of these graphs are highlighted.