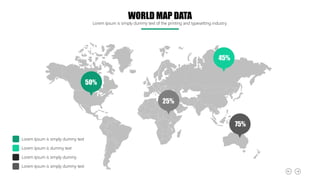
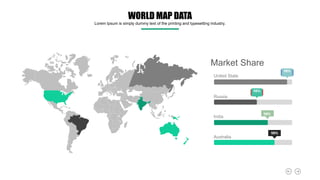
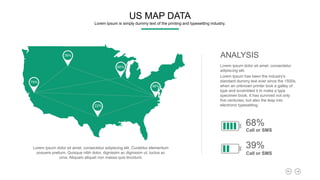
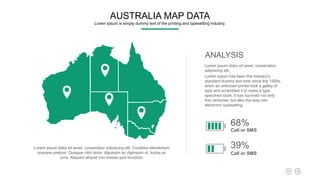
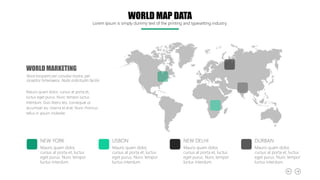
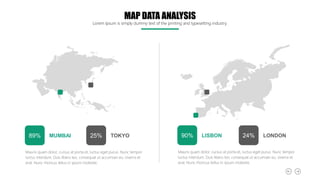
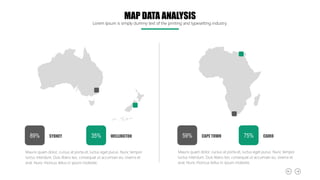
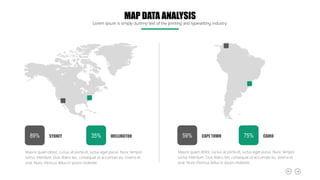
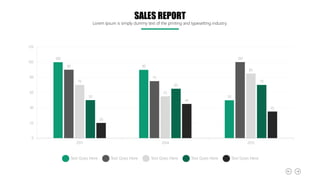
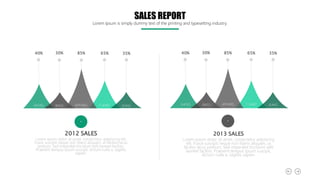
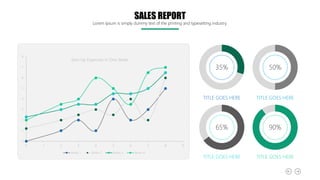
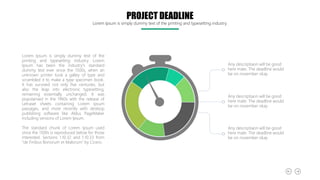
The document contains various charts and graphs containing dummy text and data. It includes pie charts, line graphs, and maps showing percentages and comparisons over time. The charts and graphs cover topics like market share, sales reports, production factors, and project deadlines. The document appears to be a multipurpose PowerPoint template containing different styles of infographics that can be used to present data in a visual format.