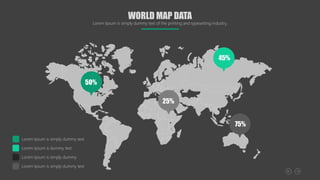
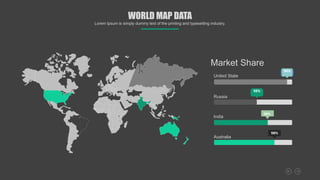
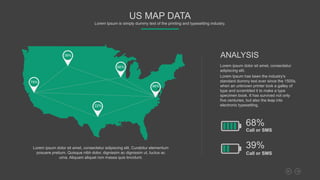
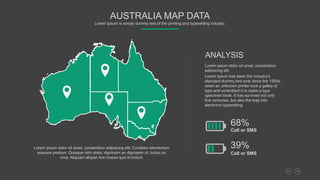
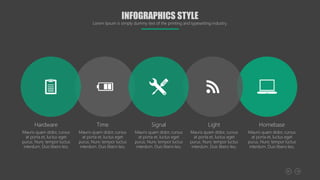
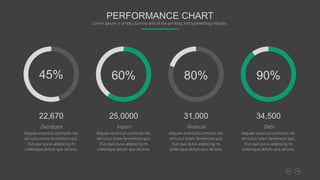
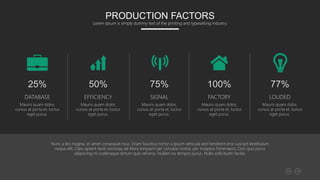
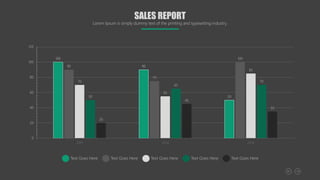
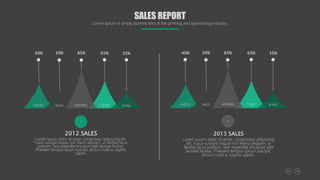
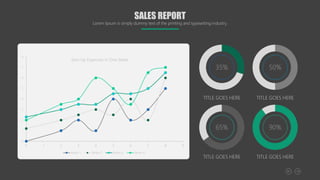
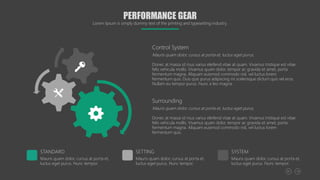
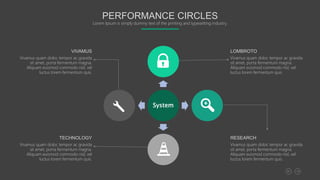
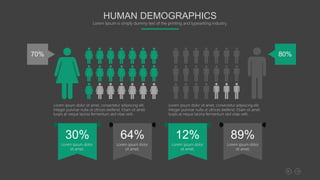
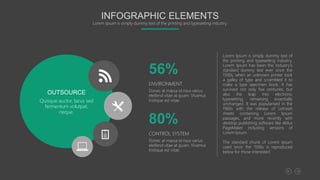
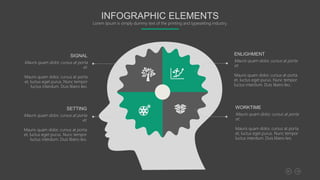
This document contains various infographics and data visualizations. It includes charts showing percentages, maps with location data, graphs tracking metrics over time, and diagrams comparing different factors. The visuals cover topics like market share, sales reports, production performance, and project deadlines. Dummy text is used throughout for descriptive labels and analysis.