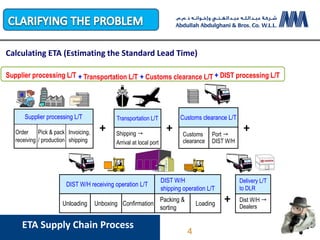
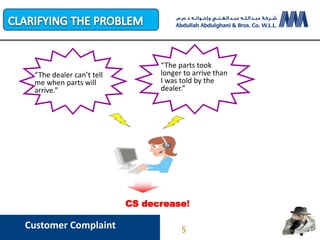
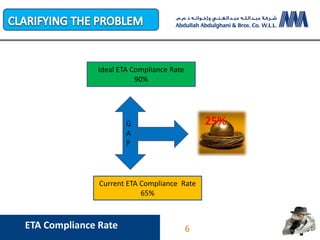
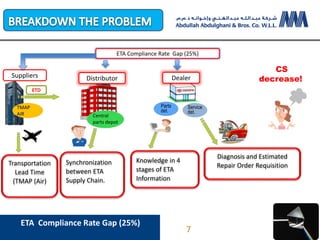
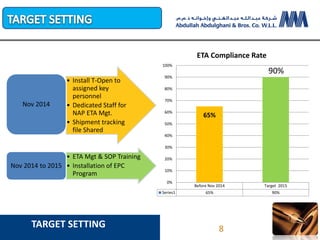
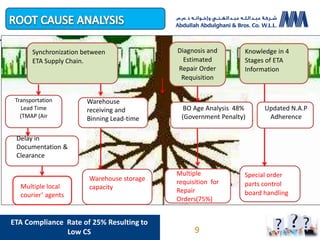
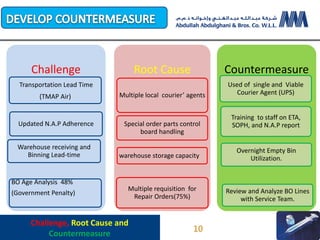
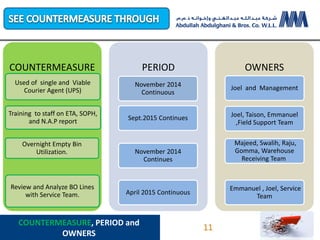
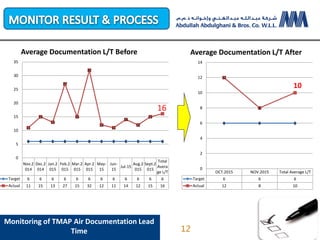
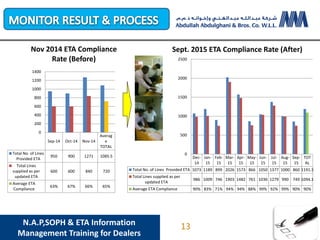
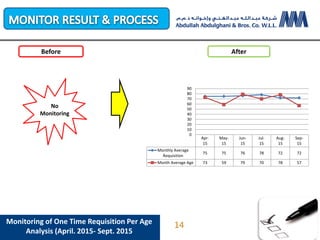
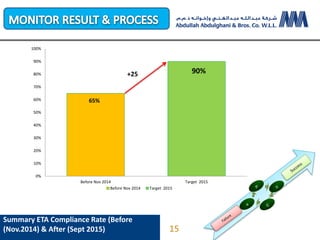
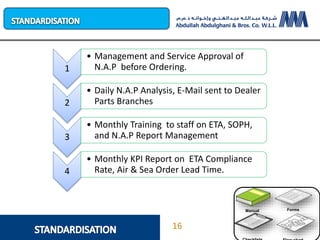
Title: Parts Kaizen Marathon 2015
Subject: “Improve ETA Compliance Rate for Dist.
Backorders”
10th December, 2015
1
P
D
C
A
1
• Title
2
• Outline
3
• Team Formation
4-6
• Clarify The problem
7
• Breakdown the Problem
8
• Target Setting
9
• Root Couse Analysis
10
• Develop Counter measure
11
• See Counter Measure Through
12-15
• Monitor Result & Process
16
• Standardization
17
• Next Step
TOYOTA 8 STEP PROBLEM SOLVING
PROCESS
2
Express TEAM
Joel Justice
Okine
Swalih
Chenath
Emmanuel
K.H.Agama
Abdallah
Gomma Raju Nuepane
Abdul Majeed
Nissar
Taison
Mathew
3
+ + +
+
Shipping "
Arrival at local port
Transportation L/T
Dist W/H "
Dealers
Delivery L/T
to DLR
Loading
Packing &
sorting
ConfirmationUnboxingUnloading
DIST W/H
shipping operation L/T
DIST W/H receiving operation L/T
Port "
DIST W/H
Customs
clearance
Customs clearance L/T
Invoicing,
shipping
Pick & pack
/ production
Order
receiving
Supplier processing L/T
Invoice
Supplier processing L/T + Transportation L/T + Customs clearance L/T + DIST processing L/T
Calculating ETA (Estimating the Standard Lead Time)
ETA Supply Chain Process
4
“The parts took
longer to arrive than
I was told by the
dealer.”
“The dealer can’t tell
me when parts will
arrive.”
CS decrease!
Customer Complaint 5
Ideal ETA Compliance Rate
90%
Current ETA Compliance Rate
65%
25%
ETA Compliance Rate
G
A
P
6
TMAP
AIR Central
parts depot
Parts
det.
Service
det.
Distributor Dealer
ETA Compliance Rate Gap (25%)
ETD
Suppliers
CS
decrease!
Synchronization
between ETA
Supply Chain.
Knowledge in 4
stages of ETA
Information
Diagnosis and Estimated
Repair Order RequisitionTransportation
Lead Time
(TMAP (Air)
ETA Compliance Rate Gap (25%)
7
8
8
TARGET SETTING
Before Nov 2014 Target 2015
Series1 65% 90%
65%
90%
0%
10%
20%
30%
40%
50%
60%
70%
80%
90%
100%
ETA Compliance Rate
• Install T-Open to
assigned key
personnel
• Dedicated Staff for
NAP ETA Mgt.
• Shipment tracking
file Shared
Nov 2014
• ETA Mgt & SOP Training
• Installation of EPC
Program
Nov 2014 to 2015
Warehouse
receiving and
Binning Lead-time
Multiple
requisition for
Repair
Orders(75%)
Synchronization between
ETA Supply Chain.
Special order
parts control
board handling
Knowledge in 4
Stages of ETA
Information
Diagnosis and
Estimated
Repair Order
Requisition
Delay in
Documentation &
Clearance
Warehouse storage
capacityMultiple local
courier’ agents
Transportation
Lead Time
(TMAP (Air
ETA Compliance Rate of 25% Resulting to
Low CS
BO Age Analysis 48%
(Government Penalty)
Updated N.A.P
Adherence
9
Challenge
Transportation Lead Time
(TMAP Air)
Warehouse receiving and
Binning Lead-time
Updated N.A.P Adherence
BO Age Analysis 48%
(Government Penalty)
Root Cause
Multiple local courier’ agents
warehouse storage capacity
Special order parts control
board handling
Multiple requisition for
Repair Orders(75%)
Countermeasure
Used of single and Viable
Courier Agent (UPS)
Overnight Empty Bin
Utilization.
Training to staff on ETA,
SOPH, and N.A.P report
Review and Analyze BO Lines
with Service Team.
Challenge, Root Cause and
Countermeasure
10
11
COUNTERMEASURE
Used of single and Viable
Courier Agent (UPS)
Training to staff on ETA, SOPH,
and N.A.P report
Review and Analyze BO Lines
with Service Team.
Overnight Empty Bin
Utilization.
PERIOD
November 2014
Continuous
Sept.2015 Continues
November 2014
Continues
April 2015 Continuous
OWNERS
Joel and Management
Joel, Taison, Emmanuel
,Field Support Team
Emmanuel , Joel, Service
Team
Majeed, Swalih, Raju,
Gomma, Warehouse
Receiving Team
COUNTERMEASURE, PERIOD and
OWNERS
11
Monitoring of TMAP Air Documentation Lead
Time
Nov.2
014
Dec.2
014
Jan.2
015
Feb.2
015
Mar.2
015
Apr.2
015
May-
15
Jun-
15
Jul-15
Aug.2
015
Sept.2
015
Total
Avera
ge L/T
Target 6 6 6 6 6 6 6 6 6 6 6 6
Actual 11 15 13 27 15 32 12 11 14 12 15 16
6 6 6 6 6 6 6 6 6 6 6 6
11
15
13
27
15
32
12
11
14
12
15
16
0
5
10
15
20
25
30
35
Average Documentation L/T Before
OCT.2015 NOV.2015 Total Average L/T
Target 6 6 6
Actual 12 8 10
6 6 6
12
8
10
0
2
4
6
8
10
12
14
Average Documentation L/T After
12
N.A.P,SOPH & ETA Information
Management Training for Dealers
Sep-14 Oct-14 Nov-14
Averag
e
TOTAL
Total No. of Lines
Provided ETA
950 900 1271 1085.5
Total Lines
supplied as per
updated ETA
600 600 840 720
Average ETA
Compliance
63% 67% 66% 65%
0
200
400
600
800
1000
1200
1400
Nov 2014 ETA Compliance
Rate (Before)
Dec-
14
Jan-
15
Feb-
15
Mar-
15
Apr-
15
May-
15
Jun-
15
Jul-
15
Aug-
15
Sep-
15
TOT
AL
Total No. of Lines Provided ETA 1073 1189 899 2026 1573 866 1050 1377 1000 860 1191.3
Total Lines supplied as per
updated ETA
986 1009 746 1903 1482 761 1036 1279 990 749 1094.1
Average ETA Compliance 90% 83% 71% 94% 94% 88% 99% 92% 99% 90% 90%
0
500
1000
1500
2000
2500
Sept. 2015 ETA Compliance Rate (After)
13
Before After
No
Monitoring
Apr-
15
May-
15
Jun-
15
Jul-
15
Aug-
15
Sep-
15
Monthly Average
Requisition
75 75 76 78 72 72
Month Average Age 73 59 79 70 78 57
0
10
20
30
40
50
60
70
80
90
Monitoring of One Time Requisition Per Age
Analysis (April. 2015- Sept. 2015
14
Summary ETA Compliance Rate (Before
(Nov.2014) & After (Sept 2015)
65%
90%
0%
10%
20%
30%
40%
50%
60%
70%
80%
90%
100%
Before Nov 2014 Target 2015
+25
15
Manual Forms
1
• Management and Service Approval of
N.A.P before Ordering.
2
• Daily N.A.P Analysis, E-Mail sent to Dealer
Parts Branches
3
• Monthly Training to staff on ETA, SOPH,
and N.A.P Report Management
4
• Monthly KPI Report on ETA Compliance
Rate, Air & Sea Order Lead Time.
16
Target 98% 2016
Sustainability
Effective
Communication
17
18
Question & Answer
Thanks
18

PPT ON IMPROVING DISTRIBUTOR ETA COMPLIANCE RATE DEC.2015

  • 1.
    Title: Parts KaizenMarathon 2015 Subject: “Improve ETA Compliance Rate for Dist. Backorders” 10th December, 2015 1
  • 2.
    P D C A 1 • Title 2 • Outline 3 •Team Formation 4-6 • Clarify The problem 7 • Breakdown the Problem 8 • Target Setting 9 • Root Couse Analysis 10 • Develop Counter measure 11 • See Counter Measure Through 12-15 • Monitor Result & Process 16 • Standardization 17 • Next Step TOYOTA 8 STEP PROBLEM SOLVING PROCESS 2
  • 3.
  • 4.
    + + + + Shipping" Arrival at local port Transportation L/T Dist W/H " Dealers Delivery L/T to DLR Loading Packing & sorting ConfirmationUnboxingUnloading DIST W/H shipping operation L/T DIST W/H receiving operation L/T Port " DIST W/H Customs clearance Customs clearance L/T Invoicing, shipping Pick & pack / production Order receiving Supplier processing L/T Invoice Supplier processing L/T + Transportation L/T + Customs clearance L/T + DIST processing L/T Calculating ETA (Estimating the Standard Lead Time) ETA Supply Chain Process 4
  • 5.
    “The parts took longerto arrive than I was told by the dealer.” “The dealer can’t tell me when parts will arrive.” CS decrease! Customer Complaint 5
  • 6.
    Ideal ETA ComplianceRate 90% Current ETA Compliance Rate 65% 25% ETA Compliance Rate G A P 6
  • 7.
    TMAP AIR Central parts depot Parts det. Service det. DistributorDealer ETA Compliance Rate Gap (25%) ETD Suppliers CS decrease! Synchronization between ETA Supply Chain. Knowledge in 4 stages of ETA Information Diagnosis and Estimated Repair Order RequisitionTransportation Lead Time (TMAP (Air) ETA Compliance Rate Gap (25%) 7
  • 8.
    8 8 TARGET SETTING Before Nov2014 Target 2015 Series1 65% 90% 65% 90% 0% 10% 20% 30% 40% 50% 60% 70% 80% 90% 100% ETA Compliance Rate • Install T-Open to assigned key personnel • Dedicated Staff for NAP ETA Mgt. • Shipment tracking file Shared Nov 2014 • ETA Mgt & SOP Training • Installation of EPC Program Nov 2014 to 2015
  • 9.
    Warehouse receiving and Binning Lead-time Multiple requisitionfor Repair Orders(75%) Synchronization between ETA Supply Chain. Special order parts control board handling Knowledge in 4 Stages of ETA Information Diagnosis and Estimated Repair Order Requisition Delay in Documentation & Clearance Warehouse storage capacityMultiple local courier’ agents Transportation Lead Time (TMAP (Air ETA Compliance Rate of 25% Resulting to Low CS BO Age Analysis 48% (Government Penalty) Updated N.A.P Adherence 9
  • 10.
    Challenge Transportation Lead Time (TMAPAir) Warehouse receiving and Binning Lead-time Updated N.A.P Adherence BO Age Analysis 48% (Government Penalty) Root Cause Multiple local courier’ agents warehouse storage capacity Special order parts control board handling Multiple requisition for Repair Orders(75%) Countermeasure Used of single and Viable Courier Agent (UPS) Overnight Empty Bin Utilization. Training to staff on ETA, SOPH, and N.A.P report Review and Analyze BO Lines with Service Team. Challenge, Root Cause and Countermeasure 10
  • 11.
    11 COUNTERMEASURE Used of singleand Viable Courier Agent (UPS) Training to staff on ETA, SOPH, and N.A.P report Review and Analyze BO Lines with Service Team. Overnight Empty Bin Utilization. PERIOD November 2014 Continuous Sept.2015 Continues November 2014 Continues April 2015 Continuous OWNERS Joel and Management Joel, Taison, Emmanuel ,Field Support Team Emmanuel , Joel, Service Team Majeed, Swalih, Raju, Gomma, Warehouse Receiving Team COUNTERMEASURE, PERIOD and OWNERS 11
  • 12.
    Monitoring of TMAPAir Documentation Lead Time Nov.2 014 Dec.2 014 Jan.2 015 Feb.2 015 Mar.2 015 Apr.2 015 May- 15 Jun- 15 Jul-15 Aug.2 015 Sept.2 015 Total Avera ge L/T Target 6 6 6 6 6 6 6 6 6 6 6 6 Actual 11 15 13 27 15 32 12 11 14 12 15 16 6 6 6 6 6 6 6 6 6 6 6 6 11 15 13 27 15 32 12 11 14 12 15 16 0 5 10 15 20 25 30 35 Average Documentation L/T Before OCT.2015 NOV.2015 Total Average L/T Target 6 6 6 Actual 12 8 10 6 6 6 12 8 10 0 2 4 6 8 10 12 14 Average Documentation L/T After 12
  • 13.
    N.A.P,SOPH & ETAInformation Management Training for Dealers Sep-14 Oct-14 Nov-14 Averag e TOTAL Total No. of Lines Provided ETA 950 900 1271 1085.5 Total Lines supplied as per updated ETA 600 600 840 720 Average ETA Compliance 63% 67% 66% 65% 0 200 400 600 800 1000 1200 1400 Nov 2014 ETA Compliance Rate (Before) Dec- 14 Jan- 15 Feb- 15 Mar- 15 Apr- 15 May- 15 Jun- 15 Jul- 15 Aug- 15 Sep- 15 TOT AL Total No. of Lines Provided ETA 1073 1189 899 2026 1573 866 1050 1377 1000 860 1191.3 Total Lines supplied as per updated ETA 986 1009 746 1903 1482 761 1036 1279 990 749 1094.1 Average ETA Compliance 90% 83% 71% 94% 94% 88% 99% 92% 99% 90% 90% 0 500 1000 1500 2000 2500 Sept. 2015 ETA Compliance Rate (After) 13
  • 14.
    Before After No Monitoring Apr- 15 May- 15 Jun- 15 Jul- 15 Aug- 15 Sep- 15 Monthly Average Requisition 7575 76 78 72 72 Month Average Age 73 59 79 70 78 57 0 10 20 30 40 50 60 70 80 90 Monitoring of One Time Requisition Per Age Analysis (April. 2015- Sept. 2015 14
  • 15.
    Summary ETA ComplianceRate (Before (Nov.2014) & After (Sept 2015) 65% 90% 0% 10% 20% 30% 40% 50% 60% 70% 80% 90% 100% Before Nov 2014 Target 2015 Before Nov 2014 Target 2015 +25 15
  • 16.
    Manual Forms 1 • Managementand Service Approval of N.A.P before Ordering. 2 • Daily N.A.P Analysis, E-Mail sent to Dealer Parts Branches 3 • Monthly Training to staff on ETA, SOPH, and N.A.P Report Management 4 • Monthly KPI Report on ETA Compliance Rate, Air & Sea Order Lead Time. 16
  • 17.
  • 18.