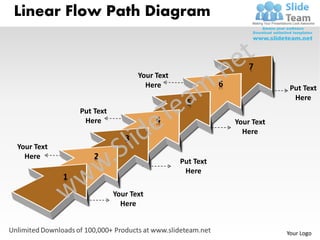
The document is a linear flow path diagram template that can be customized with text and logos. It contains 7 numbered boxes that represent steps in a linear process. The boxes and any text or logos within can be edited by ungrouping objects, changing colors using the format shape options or theme colors, and adjusting the size and orientation of icons.
Power-user creates productivity softwares.
Power-user for PowerPoint adds a new tab to PowerPoint, containing over 100 functionalities :
- 55+ editable maps
- 400+ icons
- 70+ royalty-free pictures
- 110+ slide visuals
- all countries flags
- Gantt charts
- automatic table of content
- harmonize fonts
- edit multiple charts at the same time
- unify all bullet points in the presentation
- make slide symetric
- increase / decrease spacing between shapes
- automatic presentation cleaning
- ...and dozens more!
All functionalities are regrouped with PowerPoint most useful buttons on a single tab to avoid moving from one tab to another. All are accessible with keyboard shortcuts.
Power-user can save hours every week, and greatly increases the quality of presentations.
Graphic designer, Andy Fuller talks about icons.What icons are and where they come from. He will also talk about an area of his particular specialism which is the use of icons in interfaces, apps and mobile platforms. What makes a good icon? What makes a bad icon? How do you go about developing iconography for your, or your Client's brand?
Andy Fuller runs Designbull, a graphic design agency working for small and large organisations. They specialise in brand identities, icon design, UI design and advertising. He studied Graphic Design with Business Studies and Lettering, Calligraphy and Heraldic Design. He worked with a number of design and advertising agency's before setting up Designbull. Brands he's worked on include Digital River, Going-there.com, Microsoft, NHS, RolandDG and Canon.
FREE templates from Power-user. These templates are provided as part of our regular free releases. All templates can be automatically adjusted to your own color scheme.
Arrow diagram shows required order of tasks arrows software power point templ...
Ppt linear flow path ishikawa diagram powerpoint template business templates
1. Linear Flow Path Diagram
7
Your Text
Here 6 Put Text
Here
5
Put Text
Here 4 Your Text
Here
3
Your Text
Here 2
Put Text
Here
1
Your Text
Here
Your Logo
2. Linear Flow Path Diagram
7
Your Text
Here 6 Put Text
Here
5
Put Text
Here 4 Your Text
Here
3
Your Text
Here 2
Put Text
Here
1
Your Text
Here
Your Logo
3. Linear Flow Path Diagram
7
Your Text
Here 6 Put Text
Here
5
Put Text
Here 4 Your Text
Here
3
Your Text
Here 2
Put Text
Here
1
Your Text
Here
Your Logo
4. Linear Flow Path Diagram
7
Your Text
Here 6 Put Text
Here
5
Put Text
Here 4 Your Text
Here
3
Your Text
Here 2
Put Text
1 Here
Your Text
Here
Your Logo
5. Linear Flow Path Diagram
7
Your Text
Here 6 Put Text
Here
5
Put Text
Here 4 Your Text
Here
3
Your Text
Here 2
Put Text
Here
1
Your Text
Here
Your Logo
6. Linear Flow Path Diagram
7
Your Text
Here 6 Put Text
Here
5
Put Text
Here 4 Your Text
Here
3
Your Text
Here 2
Put Text
Here
1
Your Text
Here
Your Logo
7. Linear Flow Path Diagram
7
Your Text
Here 6 Put Text
Here
5
Put Text
Here 4 Your Text
Here
3
Your Text
Here 2
Put Text
Here
1
Your Text
Here
Your Logo
8. Linear Flow Path Diagram
7
Your Text
Here 6
Put Text
5 Here
Put Text
Here 4 Your Text
Here
3
Your Text
Here 2
Put Text
Here
1
Your Text
Here
Your Logo
9. All images are 100% editable in Powerpoint
“Change color, size and orientation of any icon to your liking”
10. Ungrouping the object
2
1
3
1. Right click the object.
2. Choose Group and then Ungroup.
3. Click beside the object and drag the arrow over it.
11. Edit Color
2 3
1
1. Select the shape to change the color and Right click the object( click any object which you
want to change color)
2. Choose Format Shape in the dialog box.
3. Choose “Fill” in the Format Shape box then “Solid” or “Gradient” depending on the
appearance of the object. Change colour as shown in the picture.
12. Edit Color by Theme Colors
2
1
3
1. Select the shape to change the color
2. Go to Design Tab then “Colors”
3. Choose any theme color “Built In” depending on the appearance of the object.