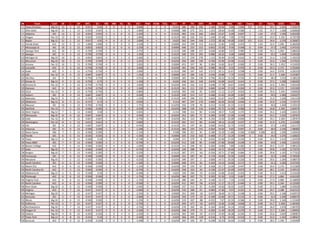
SlideShare a Scribd company logo
1 of 2
Download to read offline
RK 
Team 
Conf 
W 
L 
GP 
W% 
GV 
RW 
NW 
HL 
NL 
ESV 
P5W 
FCSW 
FCSL 
NCV 
PF 
PA 
DIFF 
PV 
MOV 
MOL 
MV 
Champ 
CV 
Rating 
SOSV 
Total 
1 
Texas Christian 
Big 12 
11 
1 
12 
0.917 
0.92 
4 
0 
0 
0 
3.000 
1 
1 
0 
-0.313 
586 
290 
296 
1.184 
29.00 
3.00 
1.040 
0.5 
0.53 
33.1 
1.324 
7.15217 
2 
Ohio State 
Big 10 
12 
1 
13 
0.923 
0.923 
5 
1 
1 
0 
2.800 
0 
0 
0 
0.0000 
588 
275 
313 
1.252 
28.64 
14.00 
0.586 
1 
1.05 
31.7 
1.268 
6.82868 
3 
Alabama 
SEC 
12 
1 
13 
0.923 
0.923 
3 
2 
0 
0 
2.350 
1 
0 
0 
0.3125 
482 
216 
266 
1.064 
22.67 
6.00 
0.667 
1 
1.05 
37.5 
1.500 
6.81638 
4 
Oregon 
Pac 12 
12 
1 
13 
0.923 
0.923 
5 
1 
1 
0 
2.800 
1 
1 
0 
-0.3125 
602 
292 
310 
1.240 
25.58 
7.00 
0.743 
1 
1.05 
33.3 
1.332 
6.72578 
5 
Baylor 
Big 12 
11 
1 
12 
0.917 
0.92 
4 
0 
0 
0 
3.000 
0 
1 
0 
-0.625 
562 
244 
318 
1.272 
28.18 
14.00 
0.567 
0.5 
0.53 
34.4 
1.376 
6.50687 
6 
Florida State 
ACC 
13 
0 
13 
1.000 
1.000 
4 
2 
0 
0 
3.100 
2 
1 
0 
0.0000 
452 
299 
153 
0.612 
11.85 
0.00 
0.474 
1 
1.05 
32.4 
1.296 
6.48200 
7 
Mississippi St 
SEC 
10 
2 
12 
0.833 
0.833 
3 
0 
0 
0 
2.250 
0 
0 
0 
0.0000 
446 
233 
213 
0.852 
23.20 
9.50 
0.548 
0 
0.00 
37.3 
1.492 
5.97533 
8 
Georgia Tech 
ACC 
10 
3 
13 
0.769 
0.769 
5 
0 
1 
1 
2.753 
1 
1 
0 
-0.3125 
446 
289 
157 
0.628 
16.80 
4.67 
0.485 
0 
0.00 
34.1 
1.364 
5.68643 
9 
Georgia 
SEC 
9 
3 
12 
0.750 
0.750 
3 
0 
1 
0 
1.250 
1 
0 
0 
0.3125 
500 
255 
245 
0.980 
30.22 
9.00 
0.849 
0 
0.00 
35.1 
1.404 
5.54530 
10 
Michigan St 
Big 10 
10 
2 
12 
0.833 
0.833 
4 
0 
1 
0 
2.000 
0 
1 
0 
-0.6250 
517 
239 
278 
1.112 
30.90 
15.50 
0.616 
0 
0.00 
31.4 
1.256 
5.19233 
11 
Wisconsin 
Big 10 
10 
3 
13 
0.769 
0.769 
3 
0 
0 
2 
2.255 
0 
1 
0 
-0.6250 
450 
260 
190 
0.760 
25.90 
23.00 
0.116 
0 
0.00 
32.6 
1.304 
4.57923 
12 
Arizona 
Pac 12 
10 
3 
13 
0.769 
0.769 
4 
0 
1 
1 
2.003 
0 
0 
0 
0.0000 
453 
357 
96 
0.384 
14.60 
16.67 
-0.083 
0 
0.00 
36.3 
1.452 
4.52493 
13 
Louisville 
ACC 
9 
3 
12 
0.750 
0.750 
4 
0 
1 
0 
2.000 
0 
1 
0 
-0.6250 
391 
246 
145 
0.580 
18.22 
6.33 
0.476 
0 
0.00 
29.3 
1.172 
4.35260 
14 
Duke 
ACC 
9 
3 
12 
0.750 
0.750 
4 
0 
1 
0 
2.000 
1 
1 
0 
-0.3125 
390 
247 
143 
0.572 
20.11 
12.67 
0.298 
0 
0.00 
24.4 
0.976 
4.28310 
15 
USC 
Pac 12 
8 
4 
12 
0.667 
0.667 
3 
0 
1 
0 
1.250 
0 
0 
0 
0.0000 
421 
285 
136 
0.544 
20.88 
7.75 
0.525 
0 
0.00 
31.7 
1.268 
4.25387 
16 
Ole Miss 
SEC 
9 
3 
12 
0.750 
0.750 
2 
1 
1 
1 
0.553 
0 
0 
0 
0.0000 
365 
166 
199 
0.796 
26.22 
12.33 
0.556 
0 
0.00 
38.3 
1.532 
4.18610 
17 
Kansas St 
Big 12 
9 
3 
12 
0.750 
0.75 
3 
0 
1 
0 
1.250 
0 
1 
0 
-0.625 
430 
261 
169 
0.676 
23.00 
12.67 
0.413 
0 
0.00 
37.5 
1.500 
3.96420 
18 
Arizona St 
Pac 12 
9 
3 
12 
0.750 
0.750 
4 
0 
1 
0 
2.000 
0 
1 
0 
-0.6250 
444 
332 
112 
0.448 
17.78 
16.67 
0.044 
0 
0.00 
32.6 
1.304 
3.92140 
19 
Clemson 
ACC 
9 
3 
12 
0.750 
0.750 
2 
0 
0 
0 
1.500 
1 
1 
0 
-0.3125 
361 
211 
150 
0.600 
22.44 
17.33 
0.204 
0 
0.00 
29.3 
1.172 
3.91390 
20 
UCLA 
Pac 12 
9 
3 
12 
0.750 
0.750 
5 
1 
3 
0 
0.800 
2 
0 
0 
0.6250 
395 
330 
65 
0.260 
11.11 
11.67 
-0.022 
0 
0.00 
35.6 
1.424 
3.83660 
21 
Auburn 
SEC 
8 
4 
12 
0.667 
0.667 
2 
0 
1 
0 
0.500 
1 
0 
0 
0.3125 
430 
313 
117 
0.468 
21.63 
14.00 
0.305 
0 
0.00 
39.5 
1.580 
3.83237 
22 
Nebraska 
Big 10 
9 
3 
12 
0.750 
0.750 
3 
0 
1 
0 
1.250 
1 
1 
0 
-0.3125 
449 
298 
151 
0.604 
21.67 
14.67 
0.280 
0 
0.00 
31.0 
1.240 
3.81150 
23 
Oklahoma 
Big 12 
8 
3 
11 
0.727 
0.73 
4 
1 
3 
0 
0.050 
1 
0 
0 
0.313 
467 
297 
170 
0.680 
26.50 
10.50 
0.640 
0 
0.00 
32.9 
1.316 
3.72577 
24 
Missouri 
SEC 
10 
3 
13 
0.769 
0.769 
5 
0 
2 
1 
1.753 
0 
1 
0 
-0.6250 
356 
278 
78 
0.312 
14.50 
22.33 
-0.313 
0 
0.00 
36.0 
1.440 
3.33553 
25 
Stanford 
Pac 12 
7 
5 
12 
0.583 
0.583 
3 
0 
2 
0 
0.250 
0 
1 
0 
-0.6250 
308 
192 
116 
0.464 
25.71 
11.20 
0.580 
0 
0.00 
34.8 
1.392 
2.64473 
26 
West Virginia 
Big 12 
7 
5 
12 
0.583 
0.58 
4 
0 
3 
1 
0.003 
1 
1 
0 
-0.313 
398 
314 
84 
0.336 
18.57 
9.20 
0.375 
0 
0.00 
35.5 
1.420 
2.40413 
27 
Minnesota 
Big 10 
8 
4 
12 
0.667 
0.667 
2 
0 
1 
0 
0.500 
0 
1 
0 
-0.6250 
352 
281 
71 
0.284 
14.50 
11.00 
0.140 
0 
0.00 
33.3 
1.332 
2.29767 
28 
Utah 
Pac 12 
8 
4 
12 
0.667 
0.667 
5 
0 
3 
0 
0.750 
0 
1 
0 
-0.6250 
362 
314 
48 
0.192 
13.50 
15.00 
-0.060 
0 
0.00 
34.1 
1.364 
2.28767 
29 
Washington 
Pac 12 
8 
5 
13 
0.615 
0.615 
4 
0 
3 
0 
0.000 
1 
1 
0 
-0.3125 
401 
317 
84 
0.336 
18.13 
12.20 
0.237 
0 
0.00 
31.9 
1.276 
2.15208 
30 
LSU 
SEC 
8 
4 
12 
0.667 
0.667 
2 
1 
2 
0 
-0.450 
1 
1 
0 
-0.3125 
331 
197 
65 
0.260 
24.63 
15.75 
0.355 
0 
0.00 
37.3 
1.492 
2.01137 
31 
Arkansas 
SEC 
6 
6 
12 
0.500 
0.500 
1 
0 
2 
1 
-1.248 
1 
1 
0 
-0.3125 
384 
243 
141 
0.564 
33.50 
9.83 
0.947 
0 
0.00 
38.4 
1.536 
1.98680 
32 
Notre Dame 
IND 
7 
5 
12 
0.583 
0.583 
1 
2 
2 
0 
-1.150 
3 
0 
0 
0.938 
396 
351 
45 
0.180 
16.29 
11.80 
0.180 
0.000 
0.000 
30.0 
1.200 
1.93043 
33 
Florida 
SEC 
6 
5 
11 
0.545 
0.545 
2 
0 
3 
0 
-1.500 
0 
0 
0 
0.0000 
335 
233 
102 
0.408 
27.17 
12.20 
0.599 
0 
0.00 
34.4 
1.376 
1.42825 
34 
Texas 
Big 12 
6 
6 
12 
0.500 
0.50 
3 
0 
3 
1 
-0.748 
0 
0 
0 
0.000 
271 
279 
-8 
-0.032 
22.00 
17.20 
0.192 
0 
0.00 
35.3 
1.412 
1.32450 
35 
Texas A&M 
SEC 
7 
5 
12 
0.583 
0.583 
3 
1 
3 
0 
-0.700 
0 
1 
0 
-0.6250 
413 
328 
85 
0.340 
27.00 
20.80 
0.248 
0 
0.00 
34.9 
1.396 
1.24233 
36 
Boston College 
ACC 
7 
5 
12 
0.583 
0.583 
4 
0 
4 
0 
-1.000 
1 
1 
0 
-0.3125 
311 
246 
65 
0.260 
14.86 
7.80 
0.282 
0 
0.00 
29.3 
1.172 
0.98523 
37 
Iowa 
Big 10 
7 
5 
12 
0.583 
0.583 
3 
0 
3 
0 
-0.750 
0 
1 
0 
-0.6250 
339 
288 
51 
0.204 
14.71 
10.40 
0.172 
0 
0.00 
29.8 
1.192 
0.77673 
38 
Rutgers 
Big 10 
7 
5 
12 
0.583 
0.583 
3 
0 
2 
0 
0.250 
1 
1 
0 
-0.3125 
307 
371 
-64 
-0.256 
10.71 
27.80 
-0.684 
0 
0.00 
29.8 
1.192 
0.77323 
39 
Tennessee 
SEC 
6 
6 
12 
0.500 
0.500 
2 
0 
3 
0 
-1.500 
0 
0 
0 
0.0000 
331 
287 
44 
0.176 
20.83 
13.50 
0.293 
0 
0.00 
32.5 
1.300 
0.76920 
40 
Maryland 
Big 10 
7 
5 
12 
0.583 
0.583 
5 
0 
4 
0 
-0.250 
0 
1 
0 
-0.6250 
349 
347 
2 
0.008 
14.71 
20.20 
-0.220 
0 
0.00 
29.6 
1.184 
0.68073 
41 
South Carolina 
SEC 
6 
6 
12 
0.500 
0.500 
2 
0 
3 
0 
-1.500 
0 
0 
0 
0.0000 
400 
374 
26 
0.104 
14.33 
10.00 
0.173 
0 
0.00 
31.5 
1.260 
0.53720 
42 
Miami (FL) 
ACC 
6 
6 
12 
0.500 
0.500 
1 
0 
2 
0 
-1.250 
0 
1 
0 
-0.6250 
359 
292 
67 
0.268 
23.17 
12.00 
0.447 
0 
0.00 
29.4 
1.176 
0.51580 
43 
North Carolina St 
ACC 
7 
5 
12 
0.583 
0.583 
3 
0 
3 
0 
-0.750 
0 
1 
0 
-0.6250 
358 
324 
34 
0.136 
21.57 
23.40 
-0.073 
0 
0.00 
28.1 
1.124 
0.39513 
44 
Oklahoma St 
Big 12 
6 
6 
12 
0.500 
0.50 
2 
0 
2 
1 
-0.498 
0 
1 
0 
-0.625 
329 
384 
-55 
-0.220 
14.00 
22.83 
-0.353 
0 
0.00 
35.3 
1.412 
0.21630 
45 
Pittsburgh 
ACC 
6 
6 
12 
0.500 
0.500 
3 
0 
4 
0 
-1.750 
0 
1 
0 
-0.6250 
380 
307 
73 
0.292 
21.50 
9.33 
0.487 
0 
0.00 
27.1 
1.084 
-0.01220 
46 
Virginia Tech 
ACC 
6 
6 
12 
0.500 
0.500 
3 
0 
4 
0 
-1.750 
1 
1 
0 
-0.3125 
280 
245 
35 
0.140 
13.17 
7.33 
0.234 
0 
0.00 
27.0 
1.080 
-0.10890 
47 
North Carolina 
ACC 
6 
6 
12 
0.500 
0.500 
2 
0 
2 
0 
-0.500 
0 
1 
0 
-0.6250 
411 
467 
-56 
-0.224 
11.17 
22.17 
-0.440 
0 
0.00 
29.1 
1.164 
-0.12500 
48 
Penn State 
Big 10 
6 
6 
12 
0.500 
0.500 
2 
1 
4 
0 
-2.450 
0 
0 
0 
0.0000 
237 
212 
25 
0.100 
14.50 
10.33 
0.167 
0 
0.00 
27.1 
1.084 
-0.59920 
49 
Virginia 
ACC 
5 
7 
12 
0.417 
0.417 
0 
0 
2 
0 
-2.000 
0 
1 
0 
-0.6250 
310 
289 
21 
0.084 
17.60 
9.57 
0.321 
0 
0.00 
29.7 
1.188 
-0.61513 
50 
Michigan 
Big 10 
5 
7 
12 
0.417 
0.417 
1 
0 
3 
0 
-2.250 
0 
0 
0 
0.0000 
251 
269 
-18 
-0.072 
18.40 
15.71 
0.108 
0 
0.00 
29.2 
1.168 
-0.62973 
51 
Kentucky 
SEC 
5 
7 
12 
0.417 
0.417 
0 
0 
2 
0 
-2.000 
0 
1 
0 
-0.6250 
350 
375 
-25 
-0.100 
22.60 
19.71 
0.116 
0 
0.00 
32.4 
1.296 
-0.89673 
52 
Illinois 
Big 10 
6 
6 
12 
0.500 
0.500 
1 
0 
2 
0 
-1.250 
0 
1 
0 
-0.6250 
319 
407 
-88 
-0.352 
7.67 
22.33 
-0.586 
0 
0.00 
29.0 
1.160 
-1.15340 
53 
California 
Pac 12 
5 
7 
12 
0.417 
0.417 
3 
0 
5 
0 
-2.750 
1 
1 
0 
-0.3125 
459 
477 
-18 
-0.072 
13.20 
12.00 
0.048 
0 
0.00 
31.7 
1.268 
-1.40183 
54 
Northwestern 
Big 10 
5 
7 
12 
0.417 
0.417 
3 
0 
5 
0 
-2.750 
0 
1 
0 
-0.6250 
276 
302 
-26 
-0.104 
14.60 
14.14 
0.018 
0 
0.00 
26.9 
1.076 
-1.96793 
55 
Oregon St 
Pac 12 
5 
7 
12 
0.417 
0.417 
2 
0 
4 
0 
-2.500 
0 
1 
0 
-0.6250 
308 
379 
-71 
-0.284 
11.40 
18.29 
-0.276 
0 
0.00 
31.7 
1.268 
-1.99993 
56 
Indiana 
Big 10 
4 
8 
12 
0.333 
0.333 
1 
0 
3 
0 
-2.250 
0 
1 
0 
-0.6250 
301 
394 
-93 
-0.372 
13.50 
18.38 
-0.195 
0 
0.00 
25.6 
1.024 
-2.08487 
57 
Texas Tech 
Big 12 
4 
8 
12 
0.333 
0.33 
2 
0 
4 
0 
-2.500 
0 
1 
0 
-0.625 
366 
495 
-129 
-0.516 
6.75 
19.50 
-0.510 
0 
0.00 
33.3 
1.332 
-2.48567 
58 
Syracuse 
ACC 
3 
9 
12 
0.250 
0.250 
2 
0 
5 
1 
-3.498 
0 
1 
0 
-0.6250 
205 
292 
-87 
-0.348 
20.33 
16.44 
0.156 
0 
0.00 
28.5 
1.140 
-2.92490
59 
Kansas 
Big 12 
3 
9 
12 
0.250 
0.25 
0 
0 
3 
0 
-3.000 
0 
1 
0 
-0.625 
214 
399 
-185 
-0.740 
13.33 
25.00 
-0.467 
0 
0.00 
33.5 
1.340 
-3.24180 
60 
Wake Forest 
ACC 
3 
9 
12 
0.250 
0.250 
0 
0 
3 
0 
-3.000 
0 
1 
0 
-0.6250 
178 
317 
-139 
-0.556 
7.33 
17.89 
-0.422 
0 
0.00 
26.7 
1.068 
-3.28540 
61 
Purdue 
Big 10 
3 
9 
12 
0.250 
0.250 
1 
0 
5 
1 
-4.248 
0 
0 
0 
0.0000 
286 
380 
-94 
-0.376 
14.00 
15.11 
-0.044 
0 
0.00 
27.3 
1.092 
-3.32590 
62 
Colorado 
Pac 12 
2 
10 
12 
0.167 
0.167 
1 
0 
5 
1 
-4.248 
0 
0 
0 
0.0000 
342 
468 
-126 
-0.504 
6.00 
13.80 
-0.312 
0 
0.00 
32.7 
1.308 
-3.58883 
63 
Washington St 
Pac 12 
3 
9 
12 
0.250 
0.250 
2 
0 
6 
0 
-4.500 
0 
1 
0 
-0.6250 
382 
463 
-81 
-0.324 
15.33 
14.11 
0.049 
0 
0.00 
33.1 
1.324 
-3.82620 
64 
Vanderbilt 
SEC 
3 
9 
12 
0.250 
0.250 
0 
0 
5 
0 
-5.000 
0 
0 
0 
0.0000 
206 
399 
-193 
-0.772 
6.00 
23.44 
-0.698 
0 
0.00 
29.5 
1.180 
-5.03960 
65 
Iowa St 
Big 12 
2 
10 
12 
0.167 
0.17 
1 
0 
6 
0 
-5.250 
1 
0 
1 
-0.813 
278 
466 
-188 
-0.752 
5.00 
19.80 
-0.592 
0 
0.00 
32.8 
1.312 
-5.92783

More Related Content

Similar to Final

Week 7 PPI Rankings (Power 5 Conferences + Notre Dame)
Week 7 PPI Rankings (Power 5 Conferences + Notre Dame)Week 7 PPI Rankings (Power 5 Conferences + Notre Dame)
Week 7 PPI Rankings (Power 5 Conferences + Notre Dame)PPIRankings
 
PPI Rankings Volume 2
PPI Rankings Volume 2PPI Rankings Volume 2
PPI Rankings Volume 2PPIRankings
 
PPI Rankings 2014 Volume 01
PPI Rankings 2014 Volume 01PPI Rankings 2014 Volume 01
PPI Rankings 2014 Volume 01PPIRankings
 
August top100 bulls - jpi jersey
August top100 bulls - jpi jerseyAugust top100 bulls - jpi jersey
August top100 bulls - jpi jerseyKátya Castro
 
IFSA Big Mtn. | Whistler Blackcomb
IFSA Big Mtn. | Whistler BlackcombIFSA Big Mtn. | Whistler Blackcomb
IFSA Big Mtn. | Whistler BlackcombJennifer Wright
 
Top200 cowsgjpi vacas jersey gjpi 0814 eua
Top200 cowsgjpi   vacas jersey gjpi 0814 euaTop200 cowsgjpi   vacas jersey gjpi 0814 eua
Top200 cowsgjpi vacas jersey gjpi 0814 euaKátya Castro
 
Angelo State Softball Notes vs. Texas A&M-Commerce
Angelo State Softball Notes vs. Texas A&M-CommerceAngelo State Softball Notes vs. Texas A&M-Commerce
Angelo State Softball Notes vs. Texas A&M-CommerceAngeloStateSports
 
Resultados do Sumário Gir Leiteiro – PNMGL ABCGIL/EMBRAPA 2016
Resultados do Sumário Gir Leiteiro – PNMGL ABCGIL/EMBRAPA 2016 Resultados do Sumário Gir Leiteiro – PNMGL ABCGIL/EMBRAPA 2016
Resultados do Sumário Gir Leiteiro – PNMGL ABCGIL/EMBRAPA 2016 Rural Pecuária
 
Composición del gasto en el presupuesto nacional para La Rioja en 2020
Composición del gasto en el presupuesto nacional para La Rioja en 2020Composición del gasto en el presupuesto nacional para La Rioja en 2020
Composición del gasto en el presupuesto nacional para La Rioja en 2020Eduardo Nelson German
 
Heptathlon Results
Heptathlon ResultsHeptathlon Results
Heptathlon Resultslscmedia
 
2012 Air Pollution Caused by Marcellus Shale Drilling in PA Counties
2012 Air Pollution Caused by Marcellus Shale Drilling in PA Counties2012 Air Pollution Caused by Marcellus Shale Drilling in PA Counties
2012 Air Pollution Caused by Marcellus Shale Drilling in PA CountiesMarcellus Drilling News
 

Similar to Final (20)

Week 7 PPI Rankings (Power 5 Conferences + Notre Dame)
Week 7 PPI Rankings (Power 5 Conferences + Notre Dame)Week 7 PPI Rankings (Power 5 Conferences + Notre Dame)
Week 7 PPI Rankings (Power 5 Conferences + Notre Dame)
 
PPI Rankings Volume 2
PPI Rankings Volume 2PPI Rankings Volume 2
PPI Rankings Volume 2
 
PPI Power Index
PPI Power IndexPPI Power Index
PPI Power Index
 
PPI Rankings 2014 Volume 01
PPI Rankings 2014 Volume 01PPI Rankings 2014 Volume 01
PPI Rankings 2014 Volume 01
 
August top100 bulls - jpi jersey
August top100 bulls - jpi jerseyAugust top100 bulls - jpi jersey
August top100 bulls - jpi jersey
 
2010 Best Cities for Job Creation
2010 Best Cities for Job Creation2010 Best Cities for Job Creation
2010 Best Cities for Job Creation
 
Regression project
Regression projectRegression project
Regression project
 
pinewood-baseball-2007
pinewood-baseball-2007pinewood-baseball-2007
pinewood-baseball-2007
 
IFSA Big Mtn. | Whistler Blackcomb
IFSA Big Mtn. | Whistler BlackcombIFSA Big Mtn. | Whistler Blackcomb
IFSA Big Mtn. | Whistler Blackcomb
 
Top200 cowsgjpi vacas jersey gjpi 0814 eua
Top200 cowsgjpi   vacas jersey gjpi 0814 euaTop200 cowsgjpi   vacas jersey gjpi 0814 eua
Top200 cowsgjpi vacas jersey gjpi 0814 eua
 
Angelo State Softball Notes vs. Texas A&M-Commerce
Angelo State Softball Notes vs. Texas A&M-CommerceAngelo State Softball Notes vs. Texas A&M-Commerce
Angelo State Softball Notes vs. Texas A&M-Commerce
 
Resultados do Sumário Gir Leiteiro – PNMGL ABCGIL/EMBRAPA 2016
Resultados do Sumário Gir Leiteiro – PNMGL ABCGIL/EMBRAPA 2016 Resultados do Sumário Gir Leiteiro – PNMGL ABCGIL/EMBRAPA 2016
Resultados do Sumário Gir Leiteiro – PNMGL ABCGIL/EMBRAPA 2016
 
Composición del gasto en el presupuesto nacional para La Rioja en 2020
Composición del gasto en el presupuesto nacional para La Rioja en 2020Composición del gasto en el presupuesto nacional para La Rioja en 2020
Composición del gasto en el presupuesto nacional para La Rioja en 2020
 
Delhi b tech2013
Delhi b tech2013Delhi b tech2013
Delhi b tech2013
 
Heptathlon Results
Heptathlon ResultsHeptathlon Results
Heptathlon Results
 
600 c 1
600 c 1600 c 1
600 c 1
 
Dispach 6 meses
Dispach 6 mesesDispach 6 meses
Dispach 6 meses
 
2012 Air Pollution Caused by Marcellus Shale Drilling in PA Counties
2012 Air Pollution Caused by Marcellus Shale Drilling in PA Counties2012 Air Pollution Caused by Marcellus Shale Drilling in PA Counties
2012 Air Pollution Caused by Marcellus Shale Drilling in PA Counties
 
FLT catalog
FLT catalogFLT catalog
FLT catalog
 
shs2006
shs2006shs2006
shs2006
 

Final

  • 1. RK Team Conf W L GP W% GV RW NW HL NL ESV P5W FCSW FCSL NCV PF PA DIFF PV MOV MOL MV Champ CV Rating SOSV Total 1 Texas Christian Big 12 11 1 12 0.917 0.92 4 0 0 0 3.000 1 1 0 -0.313 586 290 296 1.184 29.00 3.00 1.040 0.5 0.53 33.1 1.324 7.15217 2 Ohio State Big 10 12 1 13 0.923 0.923 5 1 1 0 2.800 0 0 0 0.0000 588 275 313 1.252 28.64 14.00 0.586 1 1.05 31.7 1.268 6.82868 3 Alabama SEC 12 1 13 0.923 0.923 3 2 0 0 2.350 1 0 0 0.3125 482 216 266 1.064 22.67 6.00 0.667 1 1.05 37.5 1.500 6.81638 4 Oregon Pac 12 12 1 13 0.923 0.923 5 1 1 0 2.800 1 1 0 -0.3125 602 292 310 1.240 25.58 7.00 0.743 1 1.05 33.3 1.332 6.72578 5 Baylor Big 12 11 1 12 0.917 0.92 4 0 0 0 3.000 0 1 0 -0.625 562 244 318 1.272 28.18 14.00 0.567 0.5 0.53 34.4 1.376 6.50687 6 Florida State ACC 13 0 13 1.000 1.000 4 2 0 0 3.100 2 1 0 0.0000 452 299 153 0.612 11.85 0.00 0.474 1 1.05 32.4 1.296 6.48200 7 Mississippi St SEC 10 2 12 0.833 0.833 3 0 0 0 2.250 0 0 0 0.0000 446 233 213 0.852 23.20 9.50 0.548 0 0.00 37.3 1.492 5.97533 8 Georgia Tech ACC 10 3 13 0.769 0.769 5 0 1 1 2.753 1 1 0 -0.3125 446 289 157 0.628 16.80 4.67 0.485 0 0.00 34.1 1.364 5.68643 9 Georgia SEC 9 3 12 0.750 0.750 3 0 1 0 1.250 1 0 0 0.3125 500 255 245 0.980 30.22 9.00 0.849 0 0.00 35.1 1.404 5.54530 10 Michigan St Big 10 10 2 12 0.833 0.833 4 0 1 0 2.000 0 1 0 -0.6250 517 239 278 1.112 30.90 15.50 0.616 0 0.00 31.4 1.256 5.19233 11 Wisconsin Big 10 10 3 13 0.769 0.769 3 0 0 2 2.255 0 1 0 -0.6250 450 260 190 0.760 25.90 23.00 0.116 0 0.00 32.6 1.304 4.57923 12 Arizona Pac 12 10 3 13 0.769 0.769 4 0 1 1 2.003 0 0 0 0.0000 453 357 96 0.384 14.60 16.67 -0.083 0 0.00 36.3 1.452 4.52493 13 Louisville ACC 9 3 12 0.750 0.750 4 0 1 0 2.000 0 1 0 -0.6250 391 246 145 0.580 18.22 6.33 0.476 0 0.00 29.3 1.172 4.35260 14 Duke ACC 9 3 12 0.750 0.750 4 0 1 0 2.000 1 1 0 -0.3125 390 247 143 0.572 20.11 12.67 0.298 0 0.00 24.4 0.976 4.28310 15 USC Pac 12 8 4 12 0.667 0.667 3 0 1 0 1.250 0 0 0 0.0000 421 285 136 0.544 20.88 7.75 0.525 0 0.00 31.7 1.268 4.25387 16 Ole Miss SEC 9 3 12 0.750 0.750 2 1 1 1 0.553 0 0 0 0.0000 365 166 199 0.796 26.22 12.33 0.556 0 0.00 38.3 1.532 4.18610 17 Kansas St Big 12 9 3 12 0.750 0.75 3 0 1 0 1.250 0 1 0 -0.625 430 261 169 0.676 23.00 12.67 0.413 0 0.00 37.5 1.500 3.96420 18 Arizona St Pac 12 9 3 12 0.750 0.750 4 0 1 0 2.000 0 1 0 -0.6250 444 332 112 0.448 17.78 16.67 0.044 0 0.00 32.6 1.304 3.92140 19 Clemson ACC 9 3 12 0.750 0.750 2 0 0 0 1.500 1 1 0 -0.3125 361 211 150 0.600 22.44 17.33 0.204 0 0.00 29.3 1.172 3.91390 20 UCLA Pac 12 9 3 12 0.750 0.750 5 1 3 0 0.800 2 0 0 0.6250 395 330 65 0.260 11.11 11.67 -0.022 0 0.00 35.6 1.424 3.83660 21 Auburn SEC 8 4 12 0.667 0.667 2 0 1 0 0.500 1 0 0 0.3125 430 313 117 0.468 21.63 14.00 0.305 0 0.00 39.5 1.580 3.83237 22 Nebraska Big 10 9 3 12 0.750 0.750 3 0 1 0 1.250 1 1 0 -0.3125 449 298 151 0.604 21.67 14.67 0.280 0 0.00 31.0 1.240 3.81150 23 Oklahoma Big 12 8 3 11 0.727 0.73 4 1 3 0 0.050 1 0 0 0.313 467 297 170 0.680 26.50 10.50 0.640 0 0.00 32.9 1.316 3.72577 24 Missouri SEC 10 3 13 0.769 0.769 5 0 2 1 1.753 0 1 0 -0.6250 356 278 78 0.312 14.50 22.33 -0.313 0 0.00 36.0 1.440 3.33553 25 Stanford Pac 12 7 5 12 0.583 0.583 3 0 2 0 0.250 0 1 0 -0.6250 308 192 116 0.464 25.71 11.20 0.580 0 0.00 34.8 1.392 2.64473 26 West Virginia Big 12 7 5 12 0.583 0.58 4 0 3 1 0.003 1 1 0 -0.313 398 314 84 0.336 18.57 9.20 0.375 0 0.00 35.5 1.420 2.40413 27 Minnesota Big 10 8 4 12 0.667 0.667 2 0 1 0 0.500 0 1 0 -0.6250 352 281 71 0.284 14.50 11.00 0.140 0 0.00 33.3 1.332 2.29767 28 Utah Pac 12 8 4 12 0.667 0.667 5 0 3 0 0.750 0 1 0 -0.6250 362 314 48 0.192 13.50 15.00 -0.060 0 0.00 34.1 1.364 2.28767 29 Washington Pac 12 8 5 13 0.615 0.615 4 0 3 0 0.000 1 1 0 -0.3125 401 317 84 0.336 18.13 12.20 0.237 0 0.00 31.9 1.276 2.15208 30 LSU SEC 8 4 12 0.667 0.667 2 1 2 0 -0.450 1 1 0 -0.3125 331 197 65 0.260 24.63 15.75 0.355 0 0.00 37.3 1.492 2.01137 31 Arkansas SEC 6 6 12 0.500 0.500 1 0 2 1 -1.248 1 1 0 -0.3125 384 243 141 0.564 33.50 9.83 0.947 0 0.00 38.4 1.536 1.98680 32 Notre Dame IND 7 5 12 0.583 0.583 1 2 2 0 -1.150 3 0 0 0.938 396 351 45 0.180 16.29 11.80 0.180 0.000 0.000 30.0 1.200 1.93043 33 Florida SEC 6 5 11 0.545 0.545 2 0 3 0 -1.500 0 0 0 0.0000 335 233 102 0.408 27.17 12.20 0.599 0 0.00 34.4 1.376 1.42825 34 Texas Big 12 6 6 12 0.500 0.50 3 0 3 1 -0.748 0 0 0 0.000 271 279 -8 -0.032 22.00 17.20 0.192 0 0.00 35.3 1.412 1.32450 35 Texas A&M SEC 7 5 12 0.583 0.583 3 1 3 0 -0.700 0 1 0 -0.6250 413 328 85 0.340 27.00 20.80 0.248 0 0.00 34.9 1.396 1.24233 36 Boston College ACC 7 5 12 0.583 0.583 4 0 4 0 -1.000 1 1 0 -0.3125 311 246 65 0.260 14.86 7.80 0.282 0 0.00 29.3 1.172 0.98523 37 Iowa Big 10 7 5 12 0.583 0.583 3 0 3 0 -0.750 0 1 0 -0.6250 339 288 51 0.204 14.71 10.40 0.172 0 0.00 29.8 1.192 0.77673 38 Rutgers Big 10 7 5 12 0.583 0.583 3 0 2 0 0.250 1 1 0 -0.3125 307 371 -64 -0.256 10.71 27.80 -0.684 0 0.00 29.8 1.192 0.77323 39 Tennessee SEC 6 6 12 0.500 0.500 2 0 3 0 -1.500 0 0 0 0.0000 331 287 44 0.176 20.83 13.50 0.293 0 0.00 32.5 1.300 0.76920 40 Maryland Big 10 7 5 12 0.583 0.583 5 0 4 0 -0.250 0 1 0 -0.6250 349 347 2 0.008 14.71 20.20 -0.220 0 0.00 29.6 1.184 0.68073 41 South Carolina SEC 6 6 12 0.500 0.500 2 0 3 0 -1.500 0 0 0 0.0000 400 374 26 0.104 14.33 10.00 0.173 0 0.00 31.5 1.260 0.53720 42 Miami (FL) ACC 6 6 12 0.500 0.500 1 0 2 0 -1.250 0 1 0 -0.6250 359 292 67 0.268 23.17 12.00 0.447 0 0.00 29.4 1.176 0.51580 43 North Carolina St ACC 7 5 12 0.583 0.583 3 0 3 0 -0.750 0 1 0 -0.6250 358 324 34 0.136 21.57 23.40 -0.073 0 0.00 28.1 1.124 0.39513 44 Oklahoma St Big 12 6 6 12 0.500 0.50 2 0 2 1 -0.498 0 1 0 -0.625 329 384 -55 -0.220 14.00 22.83 -0.353 0 0.00 35.3 1.412 0.21630 45 Pittsburgh ACC 6 6 12 0.500 0.500 3 0 4 0 -1.750 0 1 0 -0.6250 380 307 73 0.292 21.50 9.33 0.487 0 0.00 27.1 1.084 -0.01220 46 Virginia Tech ACC 6 6 12 0.500 0.500 3 0 4 0 -1.750 1 1 0 -0.3125 280 245 35 0.140 13.17 7.33 0.234 0 0.00 27.0 1.080 -0.10890 47 North Carolina ACC 6 6 12 0.500 0.500 2 0 2 0 -0.500 0 1 0 -0.6250 411 467 -56 -0.224 11.17 22.17 -0.440 0 0.00 29.1 1.164 -0.12500 48 Penn State Big 10 6 6 12 0.500 0.500 2 1 4 0 -2.450 0 0 0 0.0000 237 212 25 0.100 14.50 10.33 0.167 0 0.00 27.1 1.084 -0.59920 49 Virginia ACC 5 7 12 0.417 0.417 0 0 2 0 -2.000 0 1 0 -0.6250 310 289 21 0.084 17.60 9.57 0.321 0 0.00 29.7 1.188 -0.61513 50 Michigan Big 10 5 7 12 0.417 0.417 1 0 3 0 -2.250 0 0 0 0.0000 251 269 -18 -0.072 18.40 15.71 0.108 0 0.00 29.2 1.168 -0.62973 51 Kentucky SEC 5 7 12 0.417 0.417 0 0 2 0 -2.000 0 1 0 -0.6250 350 375 -25 -0.100 22.60 19.71 0.116 0 0.00 32.4 1.296 -0.89673 52 Illinois Big 10 6 6 12 0.500 0.500 1 0 2 0 -1.250 0 1 0 -0.6250 319 407 -88 -0.352 7.67 22.33 -0.586 0 0.00 29.0 1.160 -1.15340 53 California Pac 12 5 7 12 0.417 0.417 3 0 5 0 -2.750 1 1 0 -0.3125 459 477 -18 -0.072 13.20 12.00 0.048 0 0.00 31.7 1.268 -1.40183 54 Northwestern Big 10 5 7 12 0.417 0.417 3 0 5 0 -2.750 0 1 0 -0.6250 276 302 -26 -0.104 14.60 14.14 0.018 0 0.00 26.9 1.076 -1.96793 55 Oregon St Pac 12 5 7 12 0.417 0.417 2 0 4 0 -2.500 0 1 0 -0.6250 308 379 -71 -0.284 11.40 18.29 -0.276 0 0.00 31.7 1.268 -1.99993 56 Indiana Big 10 4 8 12 0.333 0.333 1 0 3 0 -2.250 0 1 0 -0.6250 301 394 -93 -0.372 13.50 18.38 -0.195 0 0.00 25.6 1.024 -2.08487 57 Texas Tech Big 12 4 8 12 0.333 0.33 2 0 4 0 -2.500 0 1 0 -0.625 366 495 -129 -0.516 6.75 19.50 -0.510 0 0.00 33.3 1.332 -2.48567 58 Syracuse ACC 3 9 12 0.250 0.250 2 0 5 1 -3.498 0 1 0 -0.6250 205 292 -87 -0.348 20.33 16.44 0.156 0 0.00 28.5 1.140 -2.92490
  • 2. 59 Kansas Big 12 3 9 12 0.250 0.25 0 0 3 0 -3.000 0 1 0 -0.625 214 399 -185 -0.740 13.33 25.00 -0.467 0 0.00 33.5 1.340 -3.24180 60 Wake Forest ACC 3 9 12 0.250 0.250 0 0 3 0 -3.000 0 1 0 -0.6250 178 317 -139 -0.556 7.33 17.89 -0.422 0 0.00 26.7 1.068 -3.28540 61 Purdue Big 10 3 9 12 0.250 0.250 1 0 5 1 -4.248 0 0 0 0.0000 286 380 -94 -0.376 14.00 15.11 -0.044 0 0.00 27.3 1.092 -3.32590 62 Colorado Pac 12 2 10 12 0.167 0.167 1 0 5 1 -4.248 0 0 0 0.0000 342 468 -126 -0.504 6.00 13.80 -0.312 0 0.00 32.7 1.308 -3.58883 63 Washington St Pac 12 3 9 12 0.250 0.250 2 0 6 0 -4.500 0 1 0 -0.6250 382 463 -81 -0.324 15.33 14.11 0.049 0 0.00 33.1 1.324 -3.82620 64 Vanderbilt SEC 3 9 12 0.250 0.250 0 0 5 0 -5.000 0 0 0 0.0000 206 399 -193 -0.772 6.00 23.44 -0.698 0 0.00 29.5 1.180 -5.03960 65 Iowa St Big 12 2 10 12 0.167 0.17 1 0 6 0 -5.250 1 0 1 -0.813 278 466 -188 -0.752 5.00 19.80 -0.592 0 0.00 32.8 1.312 -5.92783