Privacy through Anonymisation in Large-scale Socio-technical Systems: The BIS...
Poster_SEPSA_05b
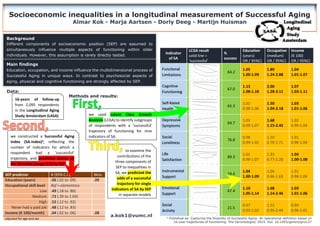
1. Indicator
of SA
LCGA result
solid line =
‘successful’
%
success
Education
(years)
OR / 95%CI
Occupation
(medium)
OR / 95%CI
Income
(€ 100)
OR / 95%CI
Functional
Limitations
64.2
1.05
1.00-1.09
1.89
1.24-2.88
1.04
1.01-1.07
Cognitive
Functioning
67.0
1.13
1.08-1.18
2.00
1.28-3.11
1.07
1.03-1.11
Self-Rated
Health
65.3
1.02
0.98-1.06
1.50
1.04-2.18
1.03
1.01-1.06
Depressive
Symptoms
64.7
1.03
0.99-1.07
1.68
1.15-2.45
1.02
0.99-1.04
Social
Loneliness
76.8
0.98
0.94-1.02
1.10
0.70-1.71
1.01
0.98-1.04
Life
Satisfaction
89.3
1.01
0.96-1.07
1.33
0.77-2.28
1.04
1.00-1.08
Instrumental
Support
29.4
1.04
1.00-1.09
1.04
0.66-1.63
1.01
0.98-1.04
Emotional
Support
67.4
1.10
1.05-1.14
1.68
1.14-2.46
1.03
1.01-1.06
Social
Activity
21.5
0.97
0.93-1.02
1.52
0.95-2.44
0.99
0.96-1.01
Socioeconomic inequalities in a longitudinal measurement of Successful Aging
Almar Kok - Marja Aartsen - Dorly Deeg - Martijn Huisman
SEP predictor B (95% C.I.) Bèta
Education (years) .06 (.02 to .09) .09
Occupational skill level Ref = elementary
Low .49 (.18 to .80)
Medium .72 (.39 to 1.04)
High .52 (.12 to .92)
Never had a paid job .48 (.12 to .83)
Income (€ 100/month) .04 (.02 to .06) .08
adjusted for age and sex a
Published as: Capturing the Diversity of Successful Aging: An operational definition based on
16-year trajectories of functioning. The Gerontologist, 2015. Doi: 10.1093/geront/gnv127
Methods and results:
we used Latent Class Growth
Analysis (LCGA) to identify subgroups
of respondents with a ‘successful’
trajectory of functioning for nine
indicators of SA.
to examine the
contributions of the
three components of
SEP to inequalities in
SA, we predicted the
odds of a successful
trajectory for single
indicators of SA by SEP
in separate models
we constructed a Successful Aging
Index (SA-index)a
, reflecting the
number of indicators for which a
respondent had a ‘successful’
trajectory, and predicted scores on
the SA-index (range 0-9) by SEP.
Data:
16-years of follow-up
from 2,095 respondents
in the Longitudinal Aging
Study Amsterdam (LASA)
Background
Different components of socioeconomic position (SEP) are assumed to
simultaneously influence multiple aspects of functioning within older
individuals. However, this assumption is rarely directly tested.
a.kok1@vumc.nl
Main findings
Education, occupation, and income influence the multidimensional process of
Successful Aging in unique ways. In contrast to psychosocial aspects of
aging, physical and cognitive functioning are strongly affected by SEP.