![CCS Options for Co-production of Electricity and Synthetic Fuels from indigenous Coal in an Indian Context Presented at the International Conference on Advances in Energy Research, ICAER-07, Mumbai, India, 12-14 December 2007 Jens Hetland, PhD, Senior Scientist, SINTEF Energy Research, Norway [email_address] Co-author Rahul Anantharaman The Norwegian University of Science and Technology, Trondheim, Norway](https://image.slidesharecdn.com/0712-hetland-ccs-india-rev2-1225495062462340-8/85/Polygeneration-and-CCS-India-1-320.jpg)
![CCS Options for Co-production of Electricity and Synthetic Fuels from indigenous Coal in an Indian Context Presented at the International Conference on Advances in Energy Research, ICAER-07, Mumbai, India, 12-14 December 2007 Jens Hetland, PhD, Senior Scientist, SINTEF Energy Research, Norway [email_address] Co-author Rahul Anantharaman The Norwegian University of Science and Technology, Trondheim, Norway](https://image.slidesharecdn.com/0712-hetland-ccs-india-rev2-1225495062462340-8/75/Polygeneration-and-CCS-India-1-2048.jpg)

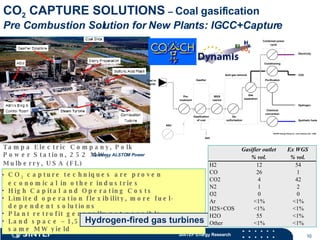
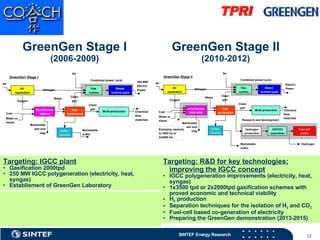
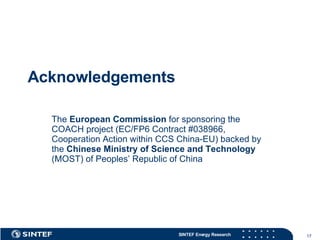
![COACH - Overall objective To prepare for large-scale polygeneration [1] from coal with CO 2 capture and storage with special impact on China . T opical areas: Coal gasification facilitating polygeneration schemes combined with carbon capture and storage . Improved power cycles requiring a large-scale topping cycle based on gas turbines that operate on hydrogen-rich fuels (still to be developed for their intended purpose). Identification of reliable storage of CO 2 in China , via capture, pre-treatment, transport, and injection of CO 2 into geological structures with - optionally - enhanced oil/gas and coal-bed methane recovery stages (EOR/EGR/ECMB). Societal anchorage , including legal, regulatory, funding and economic aspects, and public issues. [1] Options for electric power and hydrogen production as well as production of synthetic fuels with provisions for heat integration with surrounding industries. Courtesy TPRI](https://image.slidesharecdn.com/0712-hetland-ccs-india-rev2-1225495062462340-8/85/Polygeneration-and-CCS-India-11-320.jpg)


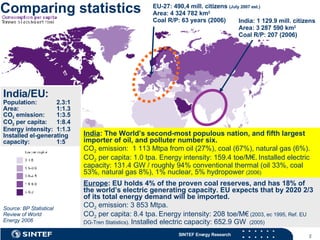
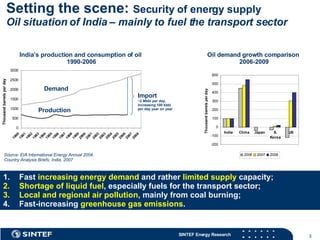
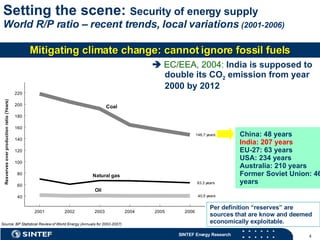
This document summarizes statistics comparing energy usage in the European Union and India and discusses options for co-producing electricity and synthetic fuels from coal in India using carbon capture and storage (CCS) technologies. It notes India's growing energy demand and limited supply as well as environmental issues from coal use. It then outlines CCS technology options like coal gasification and pre-combustion carbon capture that could allow continued coal use while reducing emissions. The document concludes that CCS could help justify harnessing India's domestic coal reserves in a sustainable way while extending the use of fossil fuels.


![[Smart Grid Market Research] Coal: Closer Look at CCS (Part 3 of 3), May 2012](https://cdn.slidesharecdn.com/ss_thumbnails/coalcloserlookatccsmay2012zprymeresearchsmartgridinsights-120508111726-phpapp01-thumbnail.jpg?width=640&height=640&fit=bounds)


