Global Ultrasound Systems Market Size, Share, Growth & Trends Analysis
SonoSite Undervalued Medical Imaging Leader
1. SonoSite, Inc.
Medical Imaging Devices | NASDAQ Ticker: SONO
SonoSite Found the Needle in the Hay Stack
We establish our initial BUY recommendation for Sonosite, Inc. (SONO) based on the company’s
strategic financial management, strong brand image in medical fields, a favorable position for greater
market penetration, and a good outlook for short-term and long-term steady revenue growth as a result
of the acquisitions and health care reform. Given these factors, we justify SonoSite is undervalued. Our
valuation targets a $54.01 share price, resulting in a 52.14% upside from the current market price of
$35.50.
Strong Financials: SonoSite has maintained good financial standing that will position the company for
growth. The company has recently paid down long-term debt and in January 2010 and June 2010
confirmed to repurchase stock worth $89 million and $50 million, respectively. We anticipate SonoSite
to strengthen its cash flows.
SonoSite is the “Gold Standard” for hand-carried ultrasound: Sonosite’s first-mover strategy into
the hand-carried ultrasound market shaped the industry. The company’s technologically forward,
dynamic products combined with their valued customer service have provided SonoSite with an
established brand image – described by one medical practitioner as the “gold standard” for hand-carried
ultrasound.
•
• Greater Potential for Market Penetration: Hand-carried ultrasound units are now fulfilling the same
tasks that larger and more expensive ultrasound units do, especially in the cardiology and diagnostic
fields. As the technology of the smaller, hand-carried ultrasound units have become more powerful,
these units have replaced the roles of the larger, cart-based ultrasound units. Additionally, hand-carried
ultrasound units can be implemented in medical fields, such as point-of-care services, that are typically
not suited for larger cart-based units. SonoSite has been influential in bringing hand-carried ultrasound
into new medical fields because of the unit’s advanced visualization technology that expands the
applications of the units. Additionally, SonoSite’s education program and customer relations work with
medical practitioners to adopt the technology quickly and implement these devices in the field
immediately.
•
• Steady Revenue Growth: Despite a weak year in 2009, SonoSite has maintained a strong revenue
growth trend. Numbers for the first three quarters of 2010 expand on previous growth trends, with YTD
growth exceeding 11%. In addition, SonoSite possesses several lucrative government contracts and
strong international sales that will ensure strong growth while the domestic economy recovers. Long-
term growth drivers will include the acquisition of smaller related companies, such as CardioDynamics
and VisualSonics, which will maintain the innovative nature of SonoSite. We predict VisualSonics will
play an important role in SonoSite’s future growth as the company looks to adopt the technologies of
VisualSonic’s into their hand-carried ultrasound units.
•
• Changes in the Healthcare Industry: The healthcare industry is currently in a state of reformation.
Current economic and political conditions are resulting in strong downward pressure on overall
healthcare costs. We believe that this will work in SonoSite’s favor because the HCU units that
company produces are 25% less expensive than the next comparable imaging systems. Additionally,
SonoSite’s advanced imaging technologies, notably needle visualization, have the potential to enhance
safety within the field, and so therefore reduce litigation costs. As hospitals and health insurers look to
reduce expenditures, SonoSite is able to meet demands with cheaper units, better imaging, and safer
procedures. This provides SonoSite a competitive advantage and positions the company to benefit from
health care reform, which we predict will result in steady future revenue growth.
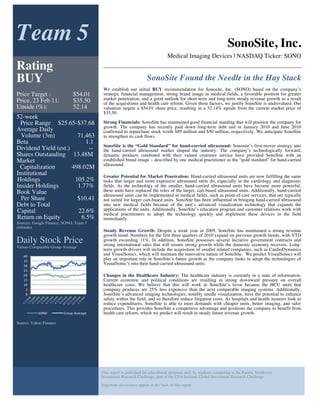
Team 5
52-week
Price Range $25.65-$37.68
Average Daily
Volume (3m) 71,463
Beta 1.1
Dividend Yield (est.) --
Shares Outstanding 13.48M
Market
Capitalization 498.02M
Institutional
Holdings 105.2%
Insider Holdings 1.77%
Book Value
Per Share $10.41
Debt to Total
Capital 22.6%
Return on Equity 6.5%
Sources: Google Finance, SONO, Team 5
estimates
Daily Stock Price
Versus Comparable Group Average
Source: Yahoo Finance
0
5
10
15
20
25
30
35
40
SONO
Group Average
Rating
BUY
Price Target : $54.01
Price, 23 Feb 11: $35.50
Upside (%): 52.14
This report is published for educational purposes only by students competing in the Pacific Northwest
Investment Research Challenge, part of the CFA Institute Global Investment Research Challenge.
Important disclosures appear at the back of this report
2. 2
Pacific Northwest Investment Research Challenge - Team 5
January 14,
2010
Earnings/Share
Mar. Jun. Sept. Dec. Year P/E Ratio
2009A $0.05 $0.02 ($0.01) $0.13 $0.19 160.79x
2010A 0.08 0.12 0.07 0.22E 0.49E 69.67x
2011E 0.12E 0.16E 0.14E 0.28E 0.70E 54.68x
2012E 0.11E 0.09E 0.14E 0.31E 0.65E 68.49x
Business Description
SonoSite, Inc. develops, manufactures, and distributes hand-carried ultrasound (HCU) systems for broad
range of clinical and treatment settings. SonoSite manufactures four product lines, The NanoMaxx™
(introduced July 2009), the M-Turbo ® system and the S Series™ (introduced October 2007), and the
MicroMaxx ® system (introduced in 2005) offer broad application products for point-of-care treatment in
hospital and private physician markets. The NanoMaxx Ultrasound Tool supports a range of examinations
and procedures, including thoracic assessment for hemothorax, hydrothorax and pneumothorax, vascular
access, needle aspirations, and injections, as well as abdominal, cardiac, nerve, obstetrics/gynecology,
musculoskeletal, small parts, and vascular scanning. The M-Turbo system is used in clinical and procedural
guidance applications at the point-of-care, such as abdominal, nerve, vascular, cardiac, venous access, small
part, and superficial imaging. The S Series ultrasound tool is one of the only products sold specifically for
mountable applications. The series consists of market specific devices based on the S platform. The products
are unique in that they can be attached to a cart, wall, or ceiling. The MicroMaxx System is used in
anesthesia, cardiology, critical and acute care, emergency medicine, obstetrics/gynecology, preventive
cardiology, radiology, surgery, vascular application, and non-invasive hemodynamic parameters for tracking
and evaluating cardiovascular health.
SonoSite designs a comprehensive array of products for applications where ultrasound has not typically been
used in the past, such as emergency medicine, surgery, critical care, internal medicine, musculoskeletal, and
vascular access procedures. SonoSite’s HCU systems can be cost effective by eliminating the need for more
time intensive, invasive and expensive procedures, allowing for earlier diagnosis of diseases and conditions.
The company also offers an array of accessories for its products including mobile docking stations, multiple
transducer connections, image transfer and management software, printers, video recorders, auxiliary
monitors, storage devices, carrying cases, and disposable supplies. In addition to its HCU and accessory
product lines, SonoSite also develops programs in ultrasound education.
The company sells its products directly to healthcare practitioners and institutions, as well as through
independent third-party distributors and strategic alliances in the United States, Australia, Canada, France,
Germany, India, Italy, Japan, Spain, the United Kingdom, Africa, Asia, China, the Middle East, and Latin
America. SonoSite, Inc. was founded in 1986 and is headquartered in Bothell, Washington.
Industry Analysis and Competitive Positioning
The ($4.9 billion) medical ultrasound market is divided into four segments: cart-based units, hand-carried
units (HCU), hybrid units, and pocket-sized units. Current trends indicate the portable ultrasound market –
consisting of the HCU, hybrid, and pocket-sized units – is growing faster than the cart-based market. This is
attributed to the following factors: 1) Because of the global economic recession, customers are demanding
cost effective portable ultrasound units to replace costly substitutes; 2) advances in technology have blurred
the line between cost effective high-end portable units and costly low-end cart-based units; and 3) portable-
units better meet the needs of high-growth medical fields, which include the point-of-care, interventional,
diagnostic, and cardiology medical fields.
Competition within the broader medical ultrasound industry is fierce. In 2008, the big names – GE Health
Care, Philips, Siemens, and Toshiba – accounted for 76 per cent of the ultrasound market. However, within
the portable ultrasound industry, specifically the HCU market, SonoSite has maintained 64% of the global
market share, with GE Healthcare in a distant second place.
Given that SonoSite maintains roughly two-thirds of the HCU market share and our estimates that SonoSite’s
total revenue for 2010 will be between $240 to $270 million, our prediction for the size of the HCU market,
despite certain analysts’ higher estimates upwards of $1 billion, is currently roughly $375 to $451 million.
Increased competition from GE Healthcare, Philips, Toshiba, and Zonare, among others, indicates that the
HCU market is growing rapidly. However, our projected models for industry growth for 2011 indicate that
SonoSite will likely lose market share to increased competition, yet will maintain positive sales growth.
While SonoSite may lose between 4-7% of the HCU market share, more conservative estimates of the
industry indicate that the market will reach upwards of $500 to $530 million in 2011 as a result of increased
competition from companies in the market. Based on these projections, the growth rate of the HCU market
from 2010 to 2011 is 13-19%. Because the HCU market is relatively small in comparison to the greater
ultrasound market – and could at this point be considered a niche market – competition from larger
• Point of care
• Interventional
• Musculo-Skeletal
• Other Diagnostic
+10%
• Cardiology
5-10%
• OBGYN
• Radiology
<5%
• Vascular Only
Declining
Market
3. 3
Pacific Northwest Investment Research Challenge - Team 5
January 14,
2010
companies, such as GE Health Care, is still in its nascent stage. SonoSite’s market share in the HCU
market will likely remain insulated from intense competition for the next three to five years.
Vast Potential in Portable Ultrasound Market
By 2012, the world's ultrasound medical equipment, spare parts and maintenance services market is
estimated to reach $4.7 billion. While certain analysts’ predictions projected the HCU market to grow in
excess of $500 million in 2007, our industry analysis indicates that the HCU market has slowed as a
result of the global economic downturn, especially in the U.S. economy. We establish that the HCU
market is just now reaching $500 million, but that growth is expected to remain steady at between 15-
20% for the next three to five years. The HCU market will remain dynamic over the next 5 years as
clinicians face increasing demand for portable ultrasound exams. Traditional ultrasound large, expensive
cart-based systems are being replaced by compact, low cost portable systems, upsetting the market share
of established companies. This disruption will continue as technology in portable products improve and
take on more demanding tasks in the existing markets. New products, such as pocket portables like GE’s
V-scan, are developing to compete in the low-end markets, threatening the market share of current
portable ultrasound suppliers, such as SonoSite.
Global Population Aging, HCU Applications Will Become Integral as Elderly Population and
Chronic Diseases Increase
Growth in medical imaging field will also continue as the global populations are aging worldwide,
accompanied by a concurrent rise in chronic disease rates. As a result, we expect the portable ultrasound
market to grow significantly during 2010-20 because of the ever-increasing applications for portable
ultrasound devices. In the US alone, there is an estimated 215 million people between ages 65-74, and
19-21 million between 75 and 100. While Emerging Market Economies (EMEs) are considered to be
relatively “young” countries compared to advanced economies, the population aged over 65 is expected
to grow rapidly: EMEs will have a total of 415 million people aged over 65 by 2020 compared to 299
million people in 2010, with the average old-age dependency ratio {(# of people aged 65+) / (# of people
aged 15-64) x 100} rising to 14.6% by 2020 from 11.4% in 2010. The elderly will have higher health
care requirements and healthcare systems in most EMEs need to be upgraded. In the long term,
consumer-spending patterns will shift with expenditure on health and medical services increasing. In
China, for example, consumer expenditure on health and medical services as a percentage of total
consumer expenditure will rise to 13.0% by 2020 compared to 9.1% in 2010. Because we expect
exponential growth of the elderly population, we estimate that this growth will coincide with strong
positive performance in the ultrasound market, but more specifically in HCU applications, sales, and
point of care use in hospital and clinical settings, especially as large EME populations grow older and
require better imaging as a component of care packages.
Emerging Market Growth Will Invariably Continue to Fuel Portable Ultrasound Growth
We believe the growth rate for the HCU market in 2011 to be approximately 13-19% globally, with faster
growth in Asia and North America. The HCU market is the fastest growing segment of the broader
ultrasound imaging market. The emerging markets grew by 50% in 2007, and are expected to approach
70% by 2010. The BRIC (Brazil, Russia, India and China) countries will account for over 60% of the
increase in aggregate consumer spending within emerging market economies (EMEs) between 2010 and
2020. Of this, China alone will account for more than a quarter of the total increase in consumer spending
between 2010 and 2020. Another market that is growing is the Middle East. For example, countries such
as the United Arab Emirates (UAE) are forecasting massive orders for imaging modalities, projecting $1
billion in spending in the next five years. There are many unknown variables that may influence
(positively or negatively) the HCU growth in EME’s such as currency exchange rates, central bank
policies, and the potential of healthcare reform in the BRIC. Despite these unknown variables, we expect
to see strong growth in the next 12-18 months in the HCU market in EME’s, ranging from 11.5% to
18.5%. This estimate will invariably increase as HCU suppliers, such as SonoSite and GE Healthcare,
increase hospital and clinical applications in the point of care medical field.
Point of Care Highest Growth Potential in HCU Market
The most prominent application for portable ultrasound devices, specifically for HCU devices, is in
point-of-care (POC) treatment solutions. HCU units have increasingly found their way into emergency
rooms, and the portability and ease of HCU systems has recently held a strong appeal over cart-based
systems. However, the HCU industry is still in its nascent stage of growth in the POC industry. We
expect the applications of HCU to increase as new ultrasound treatment approaches continue to gain
momentum. As HCU products evolve and become more efficient and useful in these applications, HCU
suppliers will likely focus more resources specifically toward the POC industry, especially as estimates
for the POC industry are expected to grow above 10% per year.
Emerging Market Growth
215
235
205
210
215
220
225
230
235
240
EME Population Aged 65+
2010-2020
EME
Population
Aged 65+
2010-2020
200
210
220
230
240
United States
Aging Population
Figures in
Millions
United
States
Aging
Populat
ion
Figures
in
Millions
50%
2007
70%
2010
+75%
2010-2015
4. 4
Pacific Northwest Investment Research Challenge - Team 5
January 14,
2010
Company Analysis and Competitive Positioning
Strengths, Weaknesses, Opportunities, Threats
SonoSite is Strategically Positioned in Portable Ultrasound Market
SonoSite is well positioned in the hand-carried, portable ultrasound market. The company pioneered
the HCU market, establishing a strong brand image that has continued to provide SonoSite with a
strong position. In addition, smaller, start-up firms will experience high barriers to entry into the
HCU market as a result of tough competition from SonoSite and larger companies, such as GE
Health Care, Siemens Health Care, and Philips Health Care. While these larger companies have
more available resources and can offer a cheaper price per unit to the customer than smaller firms,
such as SonoSite and Zonare, they have been slow to claim market share. This indicates that
SonoSite is a trusted brand within the HCU market, but may also represent that the HCU market is
not large enough for the larger companies to take interest. For these reasons, we believe SonoSite is
strategically positioned to experience strong growth in the next three to five years. After this period,
we predict the larger companies to become more competitive as the HCU market grows.
Head Start and Effective Implementation Propel SonoSite into Market Leader Position
SonoSite has firmly cemented itself as the “Gold Standard” for HCU devices. Because of their
reputation for producing the highest quality medical imaging devices and superior customer service
to implement their products with ease, educate their customers quickly and effectively, they have
established a dominant position in the HCU market over competitors. SonoSite is constantly seeking
new channels to fuel innovation in their imaging products, and their ability to effectively develop
breakthrough research and technology for their current products as well as acquiring technology
externally through acquisitions of companies such as Cardio Dynamics and Visual Sonics. SonoSite
will face increased pressure as new market entrants such as GE Healthcare, Philips, and Toshiba
compete for control of HCU market share. As long as SonoSite does not let product innovation or
market position complacency allow them to lose their strategic positioning advantage, we expect
SonoSite to lose minimal market share and benefit from the increased attention new market entrants
will unequivocally bring to HCU devices and technology.
Expectation of Active “Value” Acquisition Strategy and Strategic Partnerships
In the last 12 months SonoSite has strengthened its market share through a proactive “value based”
acquisition strategy, acquiring both CardioDynamics (Aug 2009) and Visual Sonics (June 2010).
SonoSite is strategically employing an active acquisition strategy to maintain innovativeness in the
industry. SonoSite’s strong sales and revenue resilience during bear market conditions has enabled it
to acquire firms at a discounted cost (relative to the costs of acquisition prior to the 2008 crisis)
strengthening their research and development value, and increasing their market hold in the HCU
sector. We believe that these acquisitions will improve SonoSite’s intrinsic value. In October 2010,
SonoSite anchored a partnership with the NBA as the sole provider of ultrasound to the league’s
athletic trainers and medical staff. While we do not expect that this partnership will translate directly
into significantly increased revenue immediately, we note that future partnership moves with other
athletic association’s (i.e. MLB, NFL, NHL) could directly impact revenue and profit growth, and
indirectly strengthen SonoSite’s industry image as a leader in point of care ultrasound.
SonoSite Must Maintain Diverse Distribution Channels and Minimize Barriers to Expanding
HCU Applications
In order to effectively reduce operational risks stemming from a narrow distribution network,
SonoSite must actively engage in proactive diversifying of their sales and distribution channels.
Complacency and subsequent failure to do so would allow new entrants to dominate the newly
established distribution networks and severely limit SonoSite’s ability to stay in its competitive
position as the market-share leader. We expect that SonoSite will be highly proactive in engaging
with and capturing new domestic and international HCU markets as they become available and
subsequently grow. Concurrently, SonoSite must continue to make the expansion of HCU
applications a top-level priority. SonoSite is exposed to a great deal of risk if they do not continue to
develop diverse applications and engage in partnerships with external organizations who demand
top tier portable ultrasound care. However, we expect not only SonoSite, but the entire HCU market
to continue to aggressively research, develop, and expand the medical applications for portable
ultrasound, thus limiting the risk SonoSite potentially faces from barriers for HCU applications and
expansion.
SonoSite Face Uncertainty Regarding Healthcare Legislation Reform Domestically and
Internationally
SonoSite is potentially threatened by drastic changes in the healthcare and insurance reform
stemming from legislative reform, as many medical device corporations are. It is imperative to note
Portable
Ultrasound
Systems
Cart Based
Ultrasound
Systems
• Hand Carried
Ultrasound
• Hybrid Ultrasound
• Pocket Ultrasound
$4.9
B
$45
0m
8%
Size of the Hand-
Carried
Ultrasound
Market
Entire Medical
Ultrasound
Market Size
Hand-Carried
Ultrasound
Market Size
US
HCU
Growth
• 13-1
9%
Global HCU Growth
15-20%
5. 5
Pacific Northwest Investment Research Challenge - Team 5
January 14,
2010
that these changes could have a detrimental effect on SonoSite’s sales, revenue and profitability. However,
despite this regulatory risk, we expect that the current legislation will financially bolster SonoSite position.
This is because as healthcare searches for more cost effective methods of care, SonoSite’s products offer
HCU units that are 25% less expensive than the next comparable imaging systems. In short, we expect that
changes in healthcare legislation will affect SonoSite and the HCU market, however, we expect SonoSite to
be more resilient to changes in cost and market dynamics than comparable competitors.
Financial Analysis
SonoSite has Consistently Maintained Profitability
SonoSite has historically maintained strong financial strength, which we believe will continue into the future.
Evident in the company’s income statement, SonoSite has maintained a high gross profit margin of 71 per
cent – 27.4 per cent higher than the peer group average of 55.8 per cent. Additionally, SonoSite’s 2010 gross
profit margins increased 2.4 per cent over last year’s gross margin percentage.
Furthermore, SonoSite’s operating returns on assets (OROA) is 10.7 per cent – 79.43 per cent higher than the
comparison company peer group’s average of 5.9 per cent. This ratio illustrates that SonoSite’s management,
compared to the industry peer group average, has been more effective at using the company’s assets to
generate earnings.
SonoSite’s return on equity (ROE) is 6.5 per cent – also above the peer group average, which is 4.9 per cent.
These ratios cement our belief that SonoSite has consistently maintained strong profitability through effective
financial management, and will likely continue to do so.
SonoSite Continues its Solvency & Liquidity
According to SonoSite’s balance sheet and statement of cash flows, the company has maintained positive
cash flows while paying down long-term debt. SonoSite’s debt ratio is 22.6 per cent – 42 per cent above the
peer group average of 15.9 per cent. While the company’s debt ratio is higher than the peer group average,
SonoSite has historically been able to pay its immediate and long-term obligations.
We believe that SonoSite’s long-term debt will continue to diminish throughout our 2018 forecasted period.
This assumption is based on the expectation of SonoSite to strengthen its cash flows as a result of increased
revenue streams from VisualSonics and a statement from the company that they will not be seeking further
acquisitions.
SonoSite’s 4.42 current ratio is another measure of the company’s liquidity. Compared with the peer group
average of 4.38, SonoSite is leading. Additionally, according to an acid-test ratio that measures the
company’s ability to pay short-term liabilities without selling inventory, SonoSite’s financial integrity is
intact at a ratio of 3.68 – 4.1 per cent above the peer group average ratio of 3.51. Arguably, part of SonoSite’s
strong acid-test ratio is the fact that the company’s inventory turnover is lower than the peer group average.
The reasoning, we believe, is because SonoSite uses a “pull” system, in which they maintain low inventory
by manufacturing only what its clients order, thereby decreasing overhead costs and further effectively
managing use of company assets.
SonoSite Expected to Remain Stable into the Future
SonoSite targets a revenue growth of 13% to 18% for 2011. Our estimate for SonoSite’s revenue growth
through 2018 is 12.5%. This estimate is calculated based on the following long-term and short-term
predictors: 1) A strong, 92.01% correlation between the company’s historical growth and average GDP
growth broken down by geographic region; 2) estimated growth of 13% to 19% for the HCU Industry over
the next three to five years; 3) growth drivers that include anticipation that U.S. hospitals will increase capital
budgets by 6.5%, predictions of future consistent growth from CardioDynamics and VisualSonics
acquisitions, and higher growth from emerging markets and the increasing trend of an aging population; and
4) increased strategic partnerships and contracts in the U.S. and international markets.
Valuation
We used a combination of Free Cash Flow to Equity and P/E models to determine our target price of $54.01.
Comparison of SonoSite’s price-earnings ratio to that of similar companies in the industry indicates that the
market expects greater earnings growth in the future from SonoSite. On average, the peer group P/E ratio
was 26.89 over the last year. SonoSite stands out with an average of 22.83. This indicates that the market
expects substantially greater earnings growth from SonoSite than from any of its competitors. We believe
this is because of SonoSite’s strategic acquisitions as well as its dedication to technological advancements in
the field of hand-held ultrasound equipment. By acquiring smaller competitors, SonoSite has now integrated
needle-visualization technology that is unprecedented into its hand-held units. With an increasing transition
from less expensive cart-based ultrasound systems to lighter and smaller units, SonoSite has a unique position
as perceived by the market, which is expressed through its P/E multiple.
0.00
0.10
0.20
0.30
0.40
0.50
0.60
0.70
Return on Invested
Capital
Operating Return on
Assets (OROA)
Return on Equity Ratio
0.00
2.00
4.00
6.00
8.00
10.00
12.00
Sonosite Liquidity
Current Ratio
Acid Test ratio
Inventory Turnover
Ratio:
22.83
3.37
26.89
2.60
0
20
40
Price to
Earnings
Price-
to-book
Average for Peer Group
SonoSite
6. 6
Pacific Northwest Investment Research Challenge - Team 5
January 14,
2010
Out of the companies to which we directly compared SonoSite, only two exhibited price-earnings
ratios that consistently surpassed those of SonoSite. This confirms our rating of SonoSite shares as a
worthy investment.
Our valuation depends on strong revenue growth as well as economic recovery, which was
demonstrated in the fourth quarter of 2010. We also expect current market conditions in the health
care sector to positively affect SonoSite’s market price as its products become more widely accepted.
The ability of SonoSite’s management to effectively market the possible reductions in litigation risk
that its product provides is crucial to continuing success within the currently turbulent regulatory
climate of the health care industry. Given that this is successful, we see net income rising from $9.2
million in 2010 to as much as $30 million by 2013. Despite these impressive gains, SonoSite’s stock is
already aggressively priced relative to its underlying balance sheet numbers, we view the rise in stock
price as the attainment of acknowledged potential.
We projected revenue by breaking down sales in each macroeconomic area and assessing the
correlation between revenue growth and corresponding GDP growth in each area, for which we found
a correlation upwards of 92 per cent over the last 5 years in each area. We then found the covariance
and used it to predict sales for each area as a multiple of IMF GDP predictions until constant growth in
2018. In order to maintain a conservative estimate, forecasts were taken down one standard deviation.
Investment Summary
Our FCFE targets a $54.01 share price, resulting in a 52.14% upside from the current market price of
$35.50. Because of the lack of realistic public comparative companies we used multiples to evaluate
SonoSite, all of the multiples we used with a variety of comparable public companies resulted in a
fairly low market value price. We disregarded the price to sales multiple which resulted in a price of
$33.56 and operating cash flow multiple of $23.06. When looking at the financials and the positive
outlook the numbers were presenting along with the limited comparability of companies used in the
multiples, these numbers were not effective in determining the future of SonoSite’s equity value. Yet,
the FCFE used financials that followed GDP growth and SonoSite’s sales growth across various
markets.
We predicted SonoSite’s revenue growth because it’s about 92% correlation among GDP growth in
markets SonoSite was selling their products. HCU market growth, we predicted to grow between 13-
19% from 2010-11 and around 15-20% for the next five years, this resulted in SonoSite’s revenue
growth to be about 10.4-11.6% per year, with the use of GDP growth and HCU market growth.
SonoSite has supplemented our view by open market purchases of $89 million for 2010 at a price of
$30 per share and will plan to purchase another $50 million next year to remove the shares off the
open market and increase each shares value. SonoSite did this because the company believes the stock
is undervalued while their revenue growth and products are advancing in strong form.
The recent acquisition of Visual Sonics technological advancements could continue and advance
SonoSite’s competitive edge in innovative high quality imaging devices. We believe this was a good
investment for SonoSite and adds to the value of the stock price. We believe SonoSite will continue its
revenue growth, capture developing markets and continue its strong brand name with its high quality
imaging products.
Investment Risks
Operational Risks: SonoSite may be unable to expand the market for their products. This may be
caused by clients not being willing to take the time to be properly trained, as well as the lack of desire
for new physicians to use their products.
SonoSite may be unable to compete effectively with major global competitors with a greater financial
infrastructure and resources, such as GE Healthcare, Siemens and Phillips. These companies possess
large R&D staff, more experience and brand recognition, and existing contracts and relationships with
customers. These competitors may also be able to produce product bundles or other services that
SonoSite is unable to provide or afford.
SonoSite may fail to innovate and produce new products and procedures. Because they are totally
reliant on the sales of HCU units, if they fail to create new products they could quickly lose market
share and revenue.
Production delays such as suppliers failing to produce parts in a timely manner could lead to delays in
production and sales. Changes in relationships with suppliers could lead to decreased sales.
SonoSite is reliant on technology that it licenses from ATL and is used in all HCU systems. Failure to
keep licenses and access to proprietary technology could lead to a loss of revenue and or product.
Potential Factors
Affecting EME and BRIC
Sustained Growth Rates:
Currency
Exchange
Rates
Healthcare
Reform
Central
Bank Policy
7. 7
Pacific Northwest Investment Research Challenge - Team 5
January 14,
2010
Credit Risk: The acquisition of VisualSonics and CDIC could have been overvalued, which would lead to a
decrease in overall profit and operations. Efforts to integrate future acquisitions could result in significant
disruptions that outweigh potential benefits.
Intellectual Property Risk: A large portion of SonoSite's value is derived from intellectual property and
proprietary technology used in the design and manufacture of its ultrasound imaging systems. This represents
two potential investment risks. First, failure to protect existing intellectual property rights, both domestically
and abroad, could lead to other companies’ exploiting SonoSite's technology and ultimately decreasing their
market share. Second, existing and future litigation either initiated by or against SonoSite could cause
significant damage to SonoSite's business. Such litigation could result in significant litigation costs, delays of
product release and shipment, diversion of resources, as well as significant financial liabilities.
Regulatory Risk: Increased reliance on group repurchasing programs and U.S. governmental agencies could
lead to increased pricing pressure and competition in which SonoSite may not be able to compete. If health
care reimbursement policies such as (Medicare, Medicaid and private insurers) change, market acceptance of
products may be reduced. Timely regulatory approval, both in the US and abroad, could lead to potential
product delays and decreased revenue. Healthcare reform legislation, as well as general government pressure
to contain healthcare costs, represents a large risk for SonoSite. Such a risk would include an excise tax on
medical device manufacturers that would go into effect in 2013 and result in as much as a 2.7% tax on total
revenues.
Exchange Rate Risk: A large portion of SonoSite's revenue is from foreign sales. Failure to properly hedge
exchange rate risk, as well as unforeseen fluctuations, could lead to decreased revenue.
Economic Risk: Current economic conditions could constrain sales of costly medical HCUs produced by
SonoSite. Also, general economic pressure for decreased health care spending could potentially lead to a drop
in SonoSite's revenue.
8. 8
Pacific Northwest Investment Research Challenge - Team 5
January 14,
2010
Appendices
Figure 1: Income Statement
In thousands
2009 2010 2011 2012 2013 2014 2015 2016 2017 2018
Revenue $ 227,389 $ 275,362 $ 296,290 $ 338,452 $ 394,973 $ 427,361 $ 489,499 $ 567,329 $ 611,581 $ 651,334
Cost of revenue 69,715 79,740 82,961 101,535 118,492 128,208 146,850 170,199 183,474 195,400
Gross margin 157,674 195,622 213,328 236,916 276,481 299,152 342,649 397,130 428,107 455,934
Operating expenses:
Research and
development
29,021 32,550 34,991 37,791 41,948 45,723 50,204 55,676 60,631 65,421
Sales, general and
administrative
115,208 136,156 148,410 161,767 176,326 192,195 209,493 228,347 248,898 271,299
Total operating expenses 144,229 168,706 183,401 199,557 218,273 237,918 259,697 284,023 309,529 336,720
Other income (loss):
Interest income 2,159 2,310 2,449 2,596 2,751 2,916 3,091 3,277 3,474 3,682
Interest expense (9,918) (8,371) (9,007) (10,289) (12,007) (12,992) (14,881) (17,247) (18,592) (19,801)
Gain on convertible note
repurchase
1,100 - - - - - - - - -
Other (1,522) (1,046) (1,126) (1,286) (1,501) (1,624) (1,860) (2,156) (2,324) (2,475)
Total other income (8,181) (12,519) (7,684) (8,979) (10,757) (11,699) (13,649) (16,126) (17,442) (18,594)
Income before income
taxes
5,264 14,397 22,243 28,379 47,451 49,535 69,303 96,982 101,135 100,620
Income tax (provision)
benefit
(1,981) (4,425) (8,230) (10,500) (17,557) (18,328) (25,642) (35,883) (37,420) (37,229)
Net income 3,283 9,972 14,013 17,879 29,894 31,207 43,661 61,098 63,715 63,390
Source: SONO, Team 5 Estimates
10. 10
Pacific Northwest Investment Research Challenge - Team 5
January 14,
2010
Preferred stock,
$1.00 par value
authorized shares
- 6,000,000
issued and
outstanding
shares - none
- - - - - - - - -
Common stock,
$0.01 par value
shares authorized
- 50,000,000
issued and
outstanding
shares
174 174 174 174
Treasury stock (133) (86,133) (136,133) (136,000) (80,000) (30,000) - - - -
Additional paid-in
capital
287,496 293,186 297,960 300,904 303,854 306,838 309,879 319,682 330,041 333,339
Deferred stock
compensation
- - - - - - - - - -
Accumulated
deficit
(32,753) (33,408) (34,076) (34,758) (35,453) (36,162) (36,885) (37,623) (38,375) (39,143)
Accumulated
other
comprehensive
(loss) income
(354) 419 367 374 448 516 559 576 594 603
Total
shareholders'
equity
254,430 174,064 128,118 130,521 188,850 241,192 273,554 282,809 292,433 294,974
TOTAL
LIABILITIES AND
SHAREHOLDERS'
EQUITY
422,974 349,150 306,040 311,600 373,425 429,621 466,216 480,105 494,787 502,836
Source: SONO, Team 5 Estimates
11. 11
Pacific Northwest Investment Research Challenge - Team 5
January 14,
2010
Figure 3: Statement of Cash Flows
In thousands, as of December 31, 2010
2010 2009 2008 2007 2006 2005
Operating activities:
Net income $9,972 $3,283 $11,222 $6,884 $7,231 $5,436
Adjustments to reconcile net income to net cash provided
by operating activities:
Depreciation and amortization 8,176 5,352 4,125 4,290 3,118 3,138
Stock-based compensation 6,377 6,552 8,709 6,809 7,328 297
Deferred income tax provision (5,073) 427 3,551 1,933 220 2,212
Amortization of debt discount and debt issuance costs 4,505 5,015 8,305 (523) (386) 434
Accretion of contingent purchase consideration - - - 330 - -
Excess tax benefit from stock-based compensation (1,188) (144) (1,025) (630) (2,006) -
Gain on convertible note repurchase - (1,100) (8,246) - - -
Gain on bargain purchase of CardioDynamics - (1,099) - - - -
Other 1,469 730 855 170 44 73
Changes in operating assets and liabilities:
Accounts receivable - (3,013) (6,273) (6,994) (9,400) (10,301)
Inventories - 153 194 (6,210) (1,866) (3,242)
Prepaid expenses and other assets - (3,133) 1,391 (2,210) (593) 439
Accounts payable - (2,329) (2,624) 3,009 2,289 (2,158)
Accrued expenses - (9,613) 10,014 8,939 3,237 1,859
Deferred revenue - 19,463 (1,453) - - -
Deferred liabilities - 504 426 429 1,574 702
Net cash provided by operating activities 22,477 21,048 29,171 16,226 10,790 (1,111)
Investing activities:
Purchase of investment securities - (142,147) (248,124) (418,417) (93,963) (46,787)
Proceeds from sales/maturities of investment securities 74,777 138,323 298,514 339,806 97,091 49,033
Purchase of property and equipment (1,590) (2,586) (2,841) (3,341) (5,521) (2,555)
Proceeds from sale of property and equipment - - - - 75 -
Purchase of Visual Sonic, Inc., net of cash acquired (61,440) - - - - -
Purchase of LumenVu, Inc. - - - (3,498) - -
Payment of LumenVu contingent consideration (425) - - - - -
Purchase of CardioDynamics, net of cash acquired - (8,185) - - - -
Investment in Carticept Medical, Inc. (8,000) - - - - -
Purchase of SonoSite China Medical, Ltd. - - - - (402)
Earn-out consideration for SonoMetric Health, Inc. - (387) (921) (654) (797) (36)
Net cash (used in) provided by investing activities 3,747 (14,982) 46,628 (86,104) (3,115) (747)
Financing activities:
Excess tax benefit from stock-based compensation 1,188 144 1,025 630 2,006 -
Taxes withheld on stock-based compensation (1,212) (1,342) - - - -
Purchase of treasury stock - - - (133) - -
12. 12
Pacific Northwest Investment Research Challenge - Team 5
January 14,
2010
Proceeds from exercise of stock options and employee
stock purchase plan
5,267 1,769 4,551 5,597 10,161 9,862
Stock repurchase including transaction costs (126,104) - - - - -
Proceeds from issuance of convertible senior notes, net - - - 217,606 - -
Retirement of convertible debt - (30,492) (62,406) - - -
Repayment of long-term debt (8,865) - - - - -
Purchase of call options - - - (28,612) - -
Proceeds from sale of call options - 1,646 6,417 - - -
Proceeds from issuance of warrants - - - 19,546 - -
Purchase of warrants - (1,514) (5,934) - - -
Net cash (used in) provided by financing activities (130,151) (29,789) (56,347) 214,634 12,167 9,862
Effect of exchange rate changes on cash and cash
equivalents
(448) (2,470) 1,105 (1,728) (978) 1,533
Net change in cash and cash equivalents (104,375) (26,193) 20,557 143,028 18,864 9,537
Cash and cash equivalents at beginning of year 183,065 209,258 188,701 45,673 26,809 17,272
Cash and cash equivalents at end of year 78,690 $183,065 $209,258 $188,701 $45,673 $26,809
Source: SONO
13. 13
Pacific Northwest Investment Research Challenge - Team 5
January 14,
2010
Figure 4: Ratio Analysis
Source: Source: SONO, Team 5 Estimates
14. 14
Pacific Northwest Investment Research Challenge - Team 5
January 14,
2010
Figure 5: List of Companies in Comparison Peer Group
The following companies were chosen as a comparison peer group based on the following criteria: 1) Operate
within the medical imaging industry; 2) Relative market size to SonoSite; and 3) financial and operational
activities are made public.
Analogic Corporation Accuray Incorporated
ZOLL Medical Corporation Angio Dynamics, Inc.
Merit Medical Systems, Inc. Given Imaging, Ltd.
Abaxis, Inc. Greatbatch, Inc.
Orthofix International NV Coceptus, Inc.
Natus Medical, Inc. Cantel Medical Corp.
China Medical Technologies, Inc. (ADR)
Note: SonoSite’s main competitors – GE Healthcare, Philips Healthcare, Siemens Healthcare, and Toshiba –
are large companies with private healthcare divisions. As a result, financial and operational activities regarding
these healthcare divisions are not made public.
Sonosite
Abaxis
Accuray
Analogic Corp.
AngioDynamics
China Medical
Tech Inc.
Given Imaging
Greatbatch
Merit Medical
Systems
Merit Medical
Systems
Natus Medical
Inc
Orthofix
International NV
Zoll Medical
Corp.
-0.040
-0.020
0.000
0.020
0.040
0.060
0.080
0.100
0.120
0.140
-0.020
0.000
0.020
0.040
0.060
0.080
0.100
0.120
0.140
Operating
Return on
Assets
Return On Equity
Return on Invested Capital
15. 15
Pacific Northwest Investment Research Challenge - Team 5
January 14,
2010
• Chinese Healthcare & Medical Services as % tot consumer expenditure
$4.9B
$450m
8%
Size of the Hand-Carried
Ultrasound Market
Entire Medical Ultrasound Market Size
Hand-Carried Ultrasound Market Size
P/E Multiples
Abaxis 35.82
Accuray 493.14
Analogic Corp. 46.19
AngioDynamics 32.05
Centel Medical Corp
35.1
Conceptus Inc 42.73
Given Imaging 31.31
Greatbatch 11.57
Merit Medical Systems
86.23
Natus Medical Inc 36.41
Orthofix International NV
19.1
Zoll Medical Corp. 5.78
China Medical Tech Inc.
43.93
P/E Multiple for Sonosite
70.72
0 100 200 300 400 500 600
16. 16
Pacific Northwest Investment Research Challenge - Team 5
January 14,
2010
200
210
220
230
240
65-74
65+
United States Aging Population
Figures in Millions
United States
Aging
Population
Figures in
Millions
17. 17
Pacific Northwest Investment Research Challenge - Team 5
January 14,
2010
200
210
220
230
240
65-74
65+
215
235
EME Population Aged 65+
2010-2020
EME
Population
Aged 65+
2010-2020
Portable
Ultrasound
Systems
Cart Based
Ultrasound
Systems
• Hand Carried
Ultrasound
• Hybrid Ultrasound
• Pocket Ultrasound
18. 18
Pacific Northwest Investment Research Challenge - Team 5
January 14,
2010
Emerging Market Economy Growth
Disclosures:
Ownership and material conflicts of interest:
The author(s), or a member of their household, of this report does not hold a financial interest in the securities of this company.
The author(s), or a member of their household, of this report does not know of the existence of any conflicts of interest that might bias the content or publication of this
report.
Receipt of compensation:
Compensation of the author(s) of this report is not based on investment banking revenue.
Position as a officer or director:
The author(s), or a member of their household, does not serves as an officer, director or advisory board member of the subject company.
Market making:
The author(s) does not act as a market maker in the subject company’s securities.
Ratings guide:
Banks rate companies as either a BUY, HOLD or SELL. A BUY rating is given when the security is expected to deliver absolute returns of 15% or greater over the
next twelve month period, and recommends that investors take a position above the security’s weight in the S&P 500, or any other relevant index. A SELL rating is
given when the security is expected to deliver negative returns over the next twelve months, while a HOLD rating implies flat returns over the next twelve months.
Investment Research Challenge and Global Investment Research Challenge Acknowledgement:
Pacific Northwest Investment Research Challenge as part of the CFA Institute Global Investment Research Challenge is based on the Investment Research Challenge
originally developed by the New York Society of Security Analysts.
Disclaimer:
The information set forth herein has been obtained or derived from sources generally available to the public and believed by the author(s) to be reliable, but the
author(s) does not make any representation or warranty, express or implied, as to its accuracy or completeness. The information is not intended to be used as the basis of
any investment decisions by any person or entity. This information does not constitute investment advice, nor is it an offer or a solicitation of an offer to buy or sell any
security. This report should not be considered to be a recommendation by any individual affiliated with Pacific Northwest Investment Research Challenge, CFA
Institute or the Global Investment Research Challenge with regard to this company’s stock.
50%
2007
70%
2010
+75%
2010-2015