Download to read offline
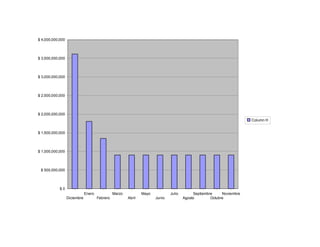


The document appears to show charts and tables related to television advertising investments and revenue over time. Specifically, it includes line graphs displaying monthly investment amounts in television advertising from December to November, with the highest investment in December at $3.6 billion and lower subsequent investments ranging from $900 million to $1.8 billion. It also includes tables with information on television programs, their time slots, CPR (cost per rating), and estimated monthly revenue.


