Downloaded 12 times


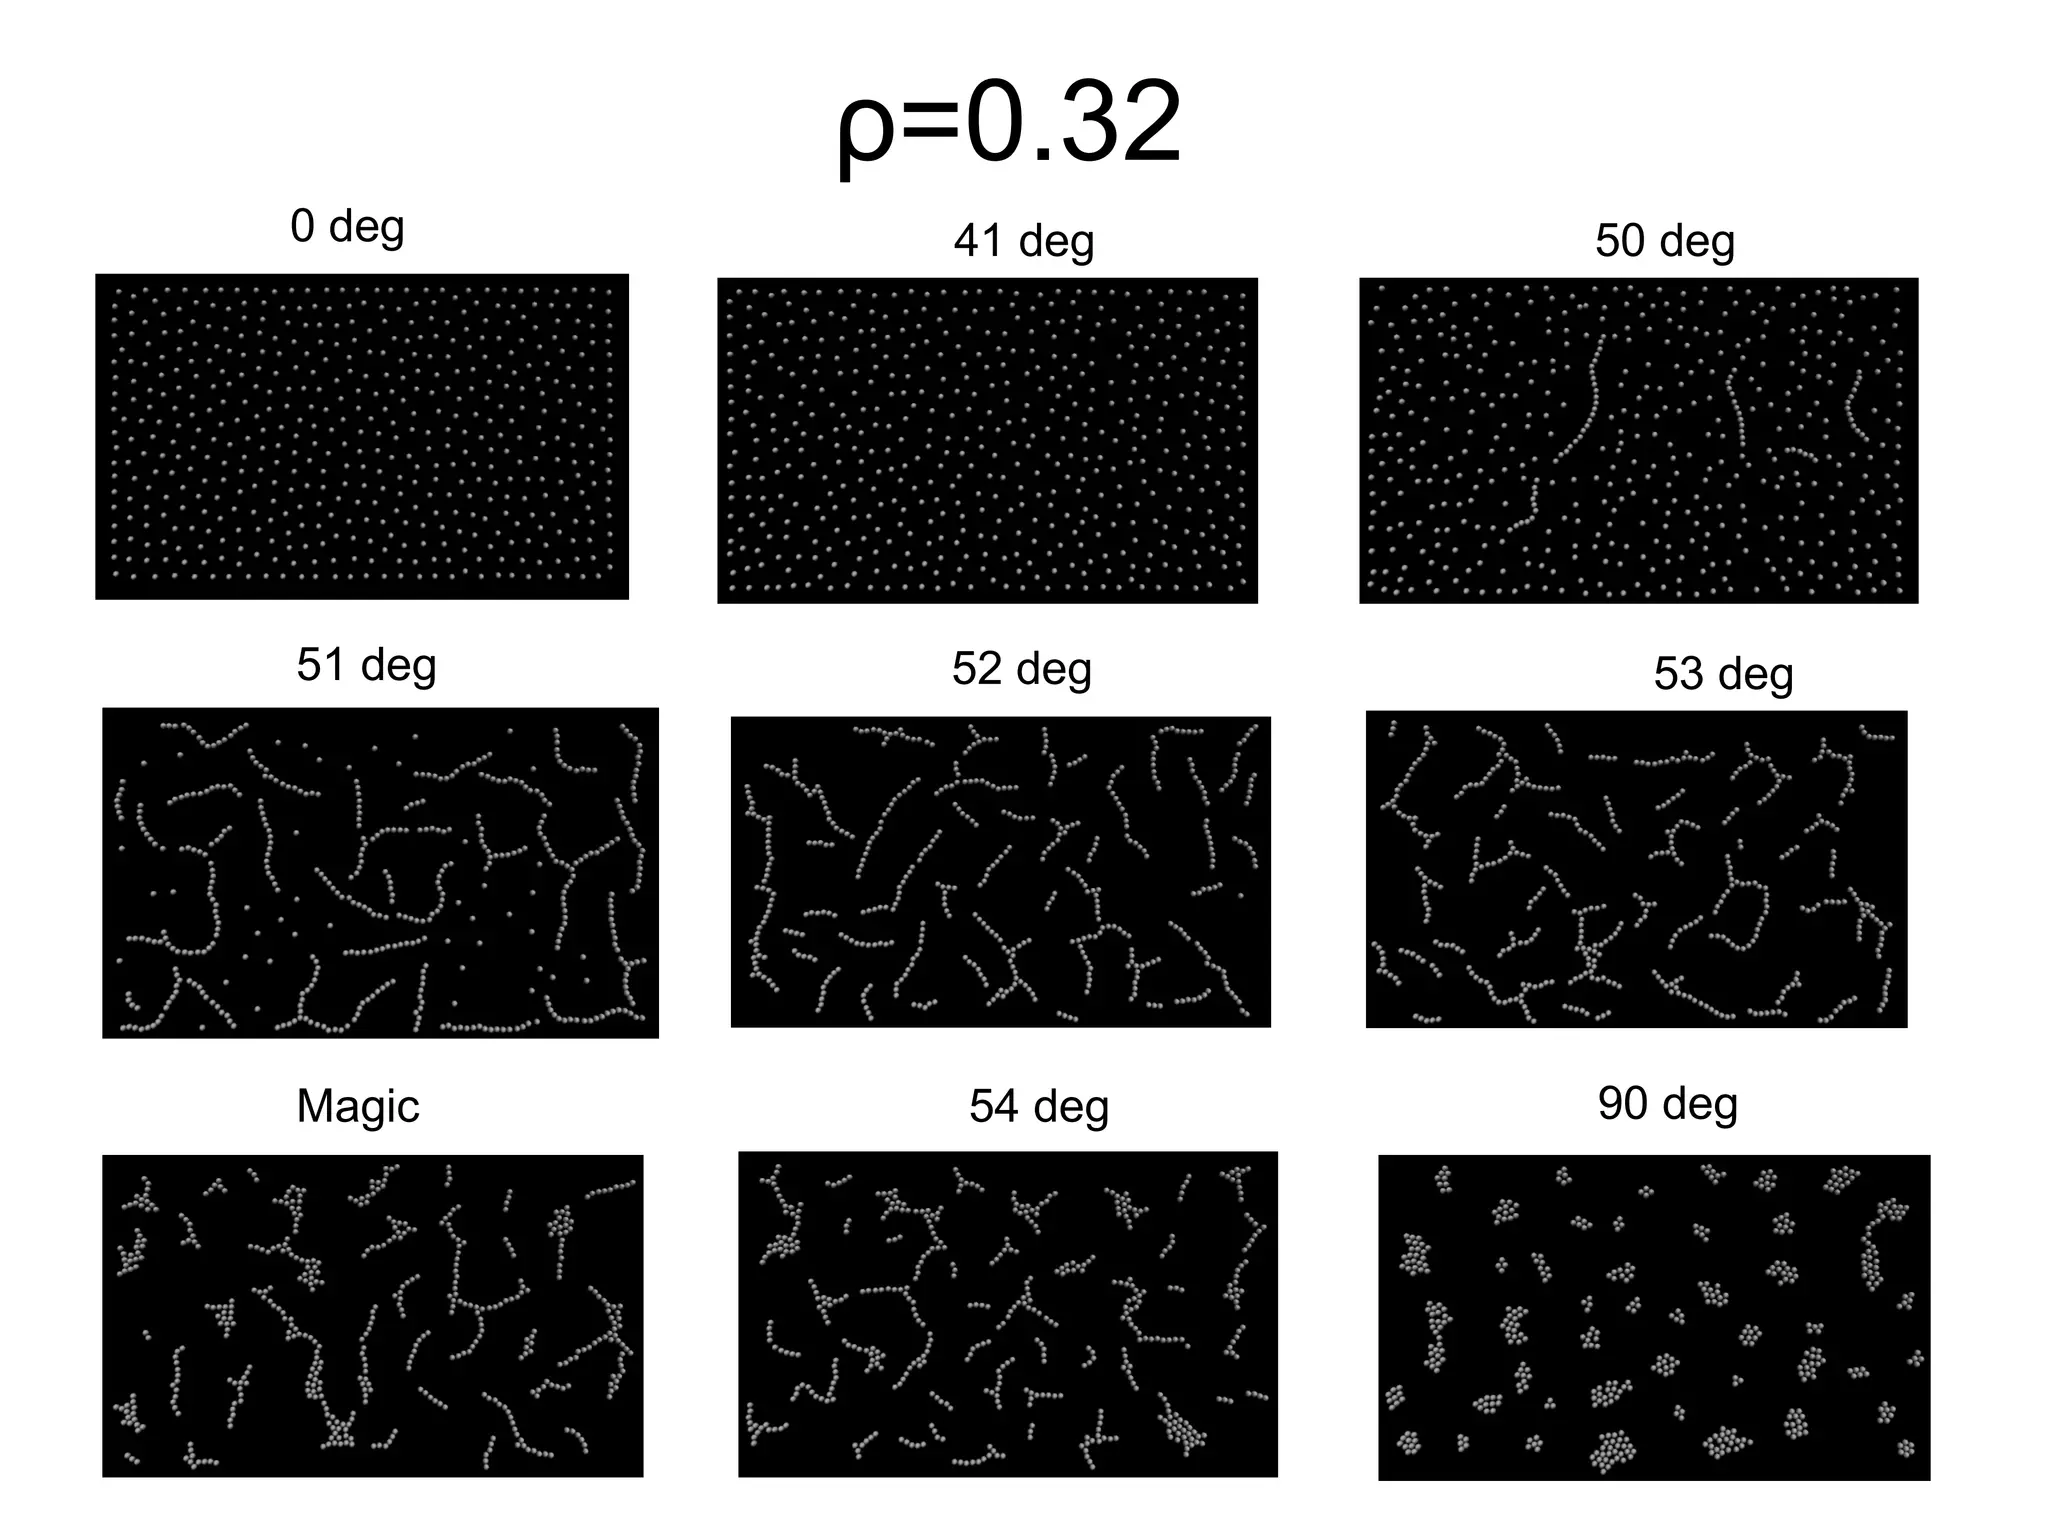


This document shows a phase diagram with density (ρ) on the y-axis ranging from 0.1 to 0.32 and temperature in degrees on the x-axis ranging from 0 to 90 degrees. There are phase transitions indicated at certain common temperature points like 41, 51-53, 55 degrees across the different densities.


