Downloaded 342 times


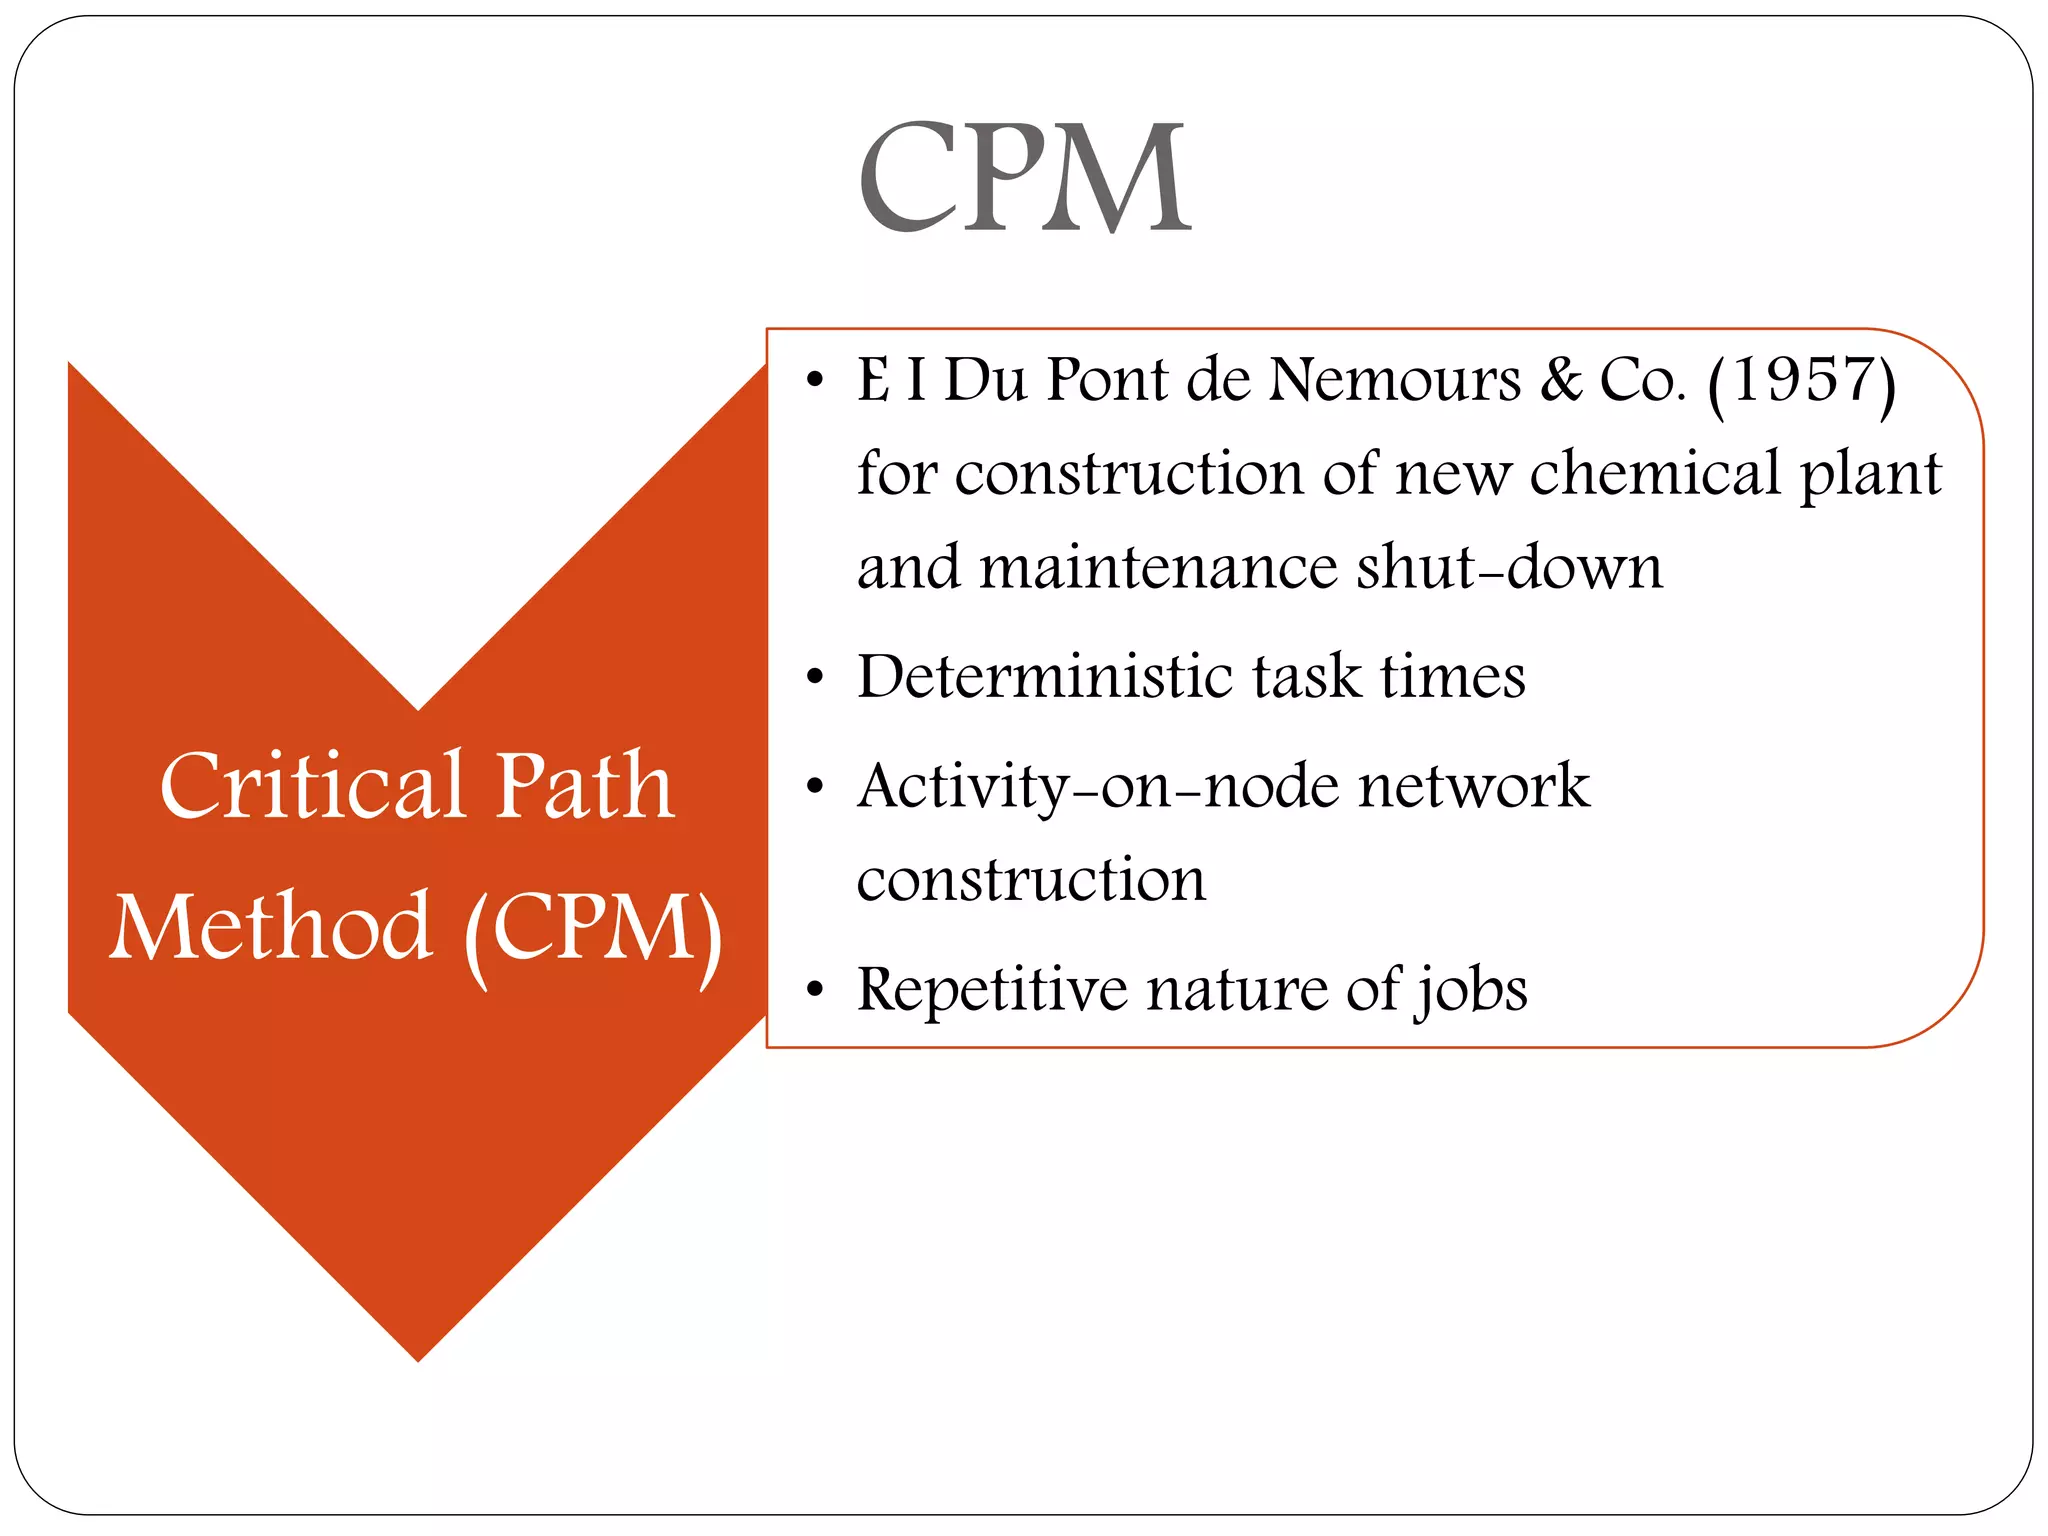


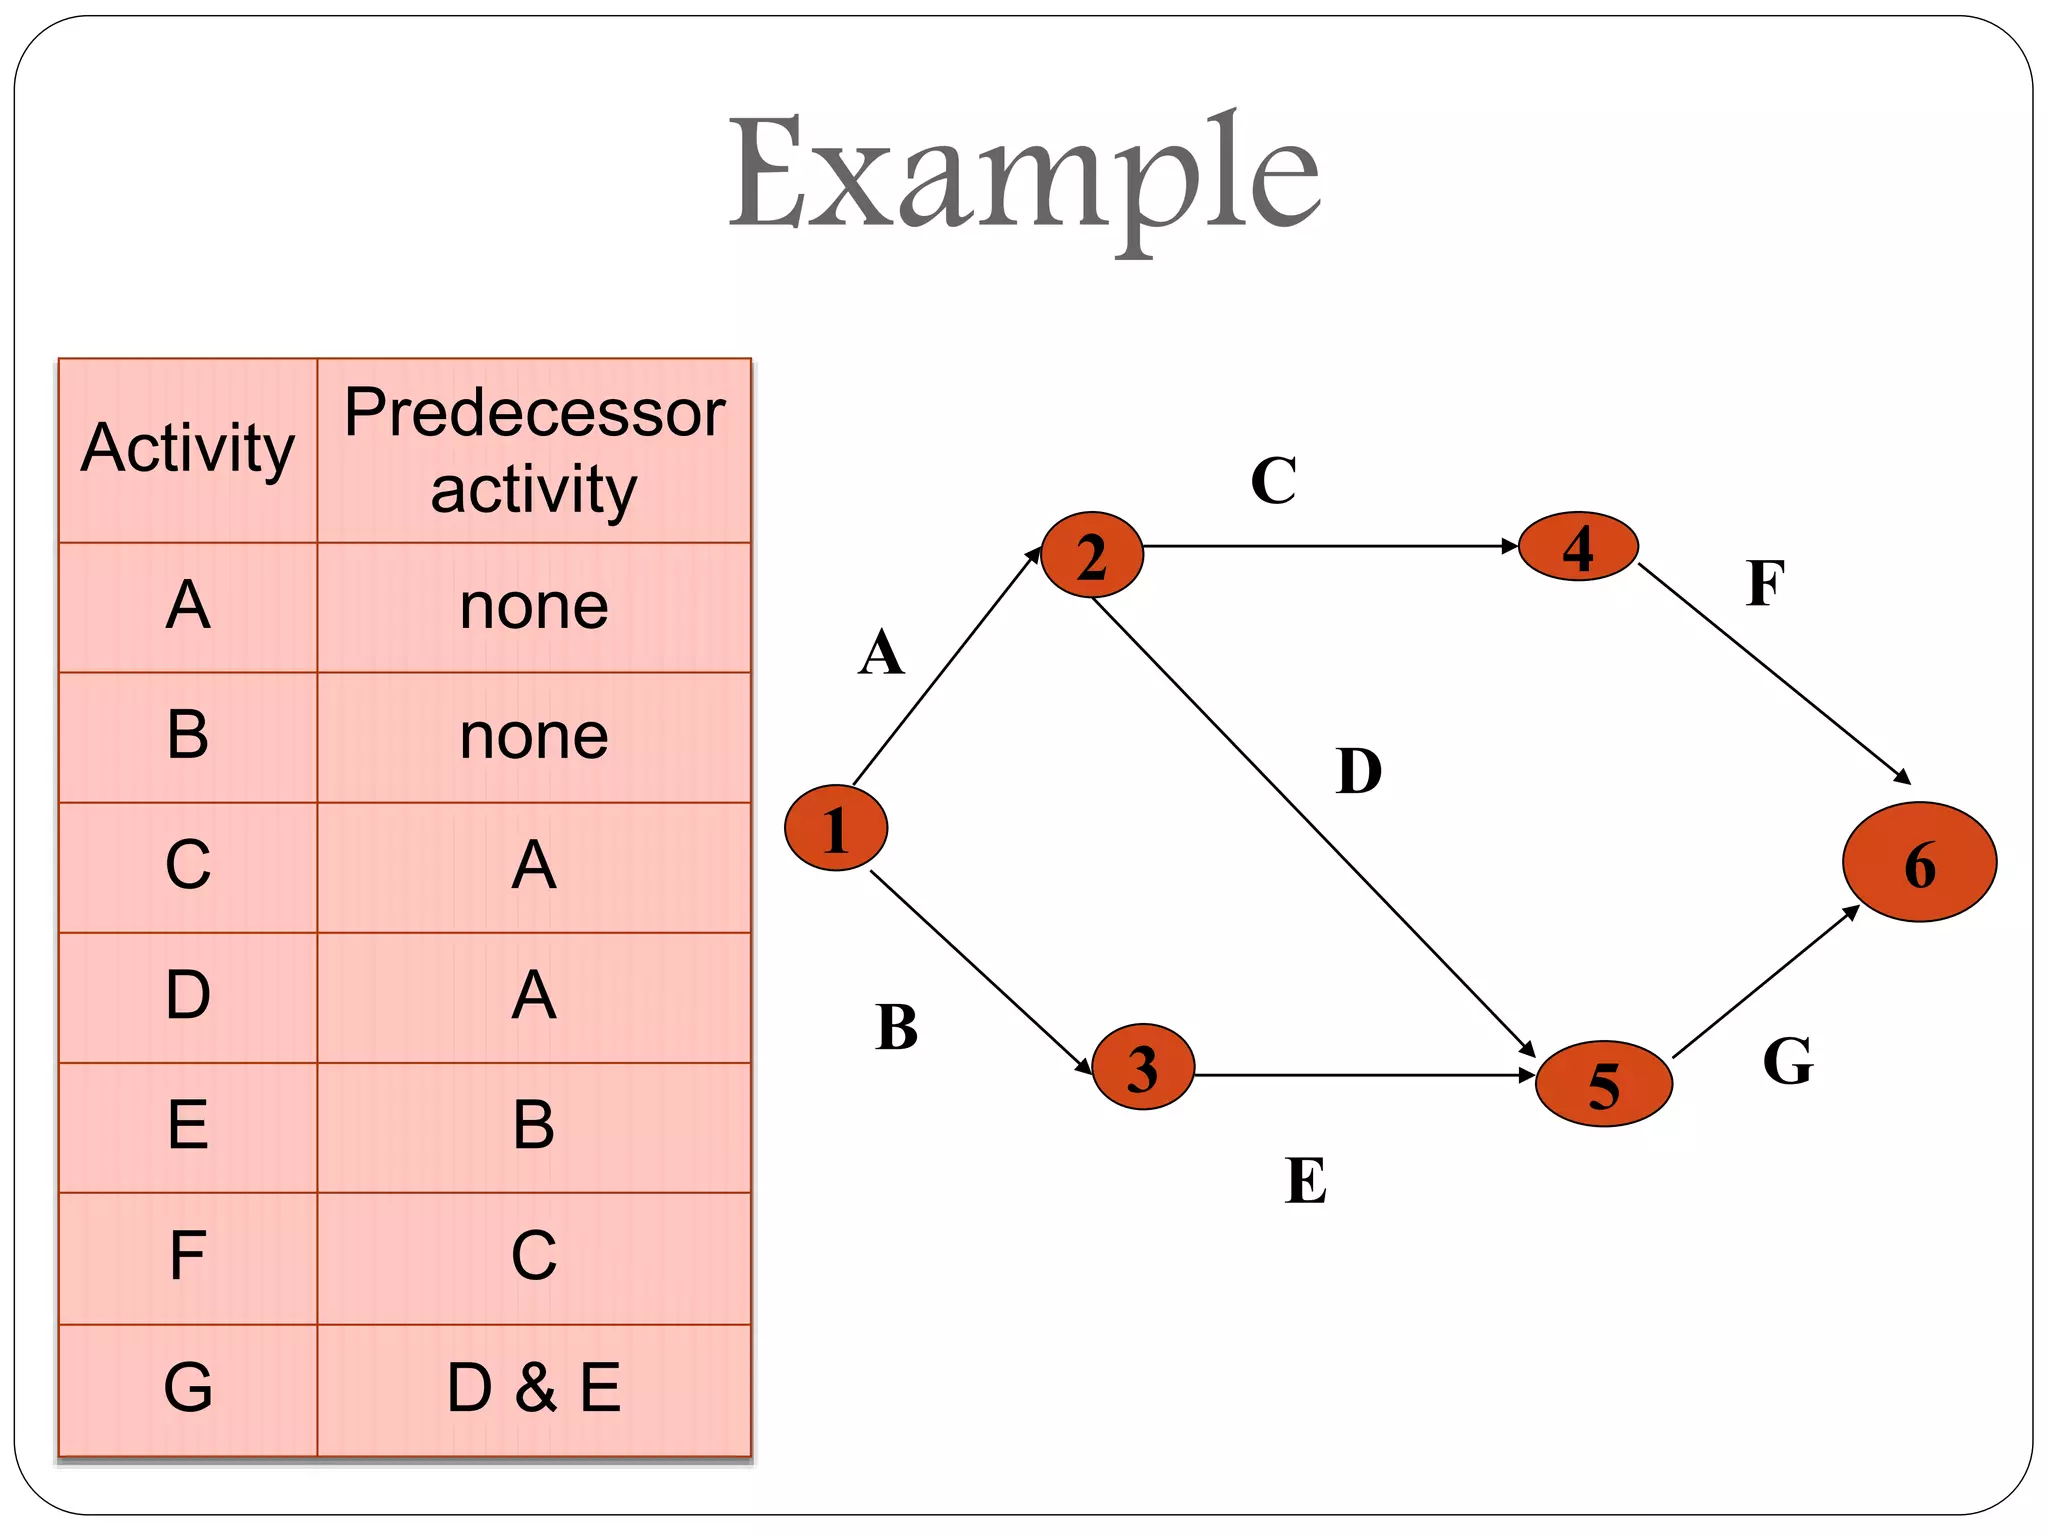


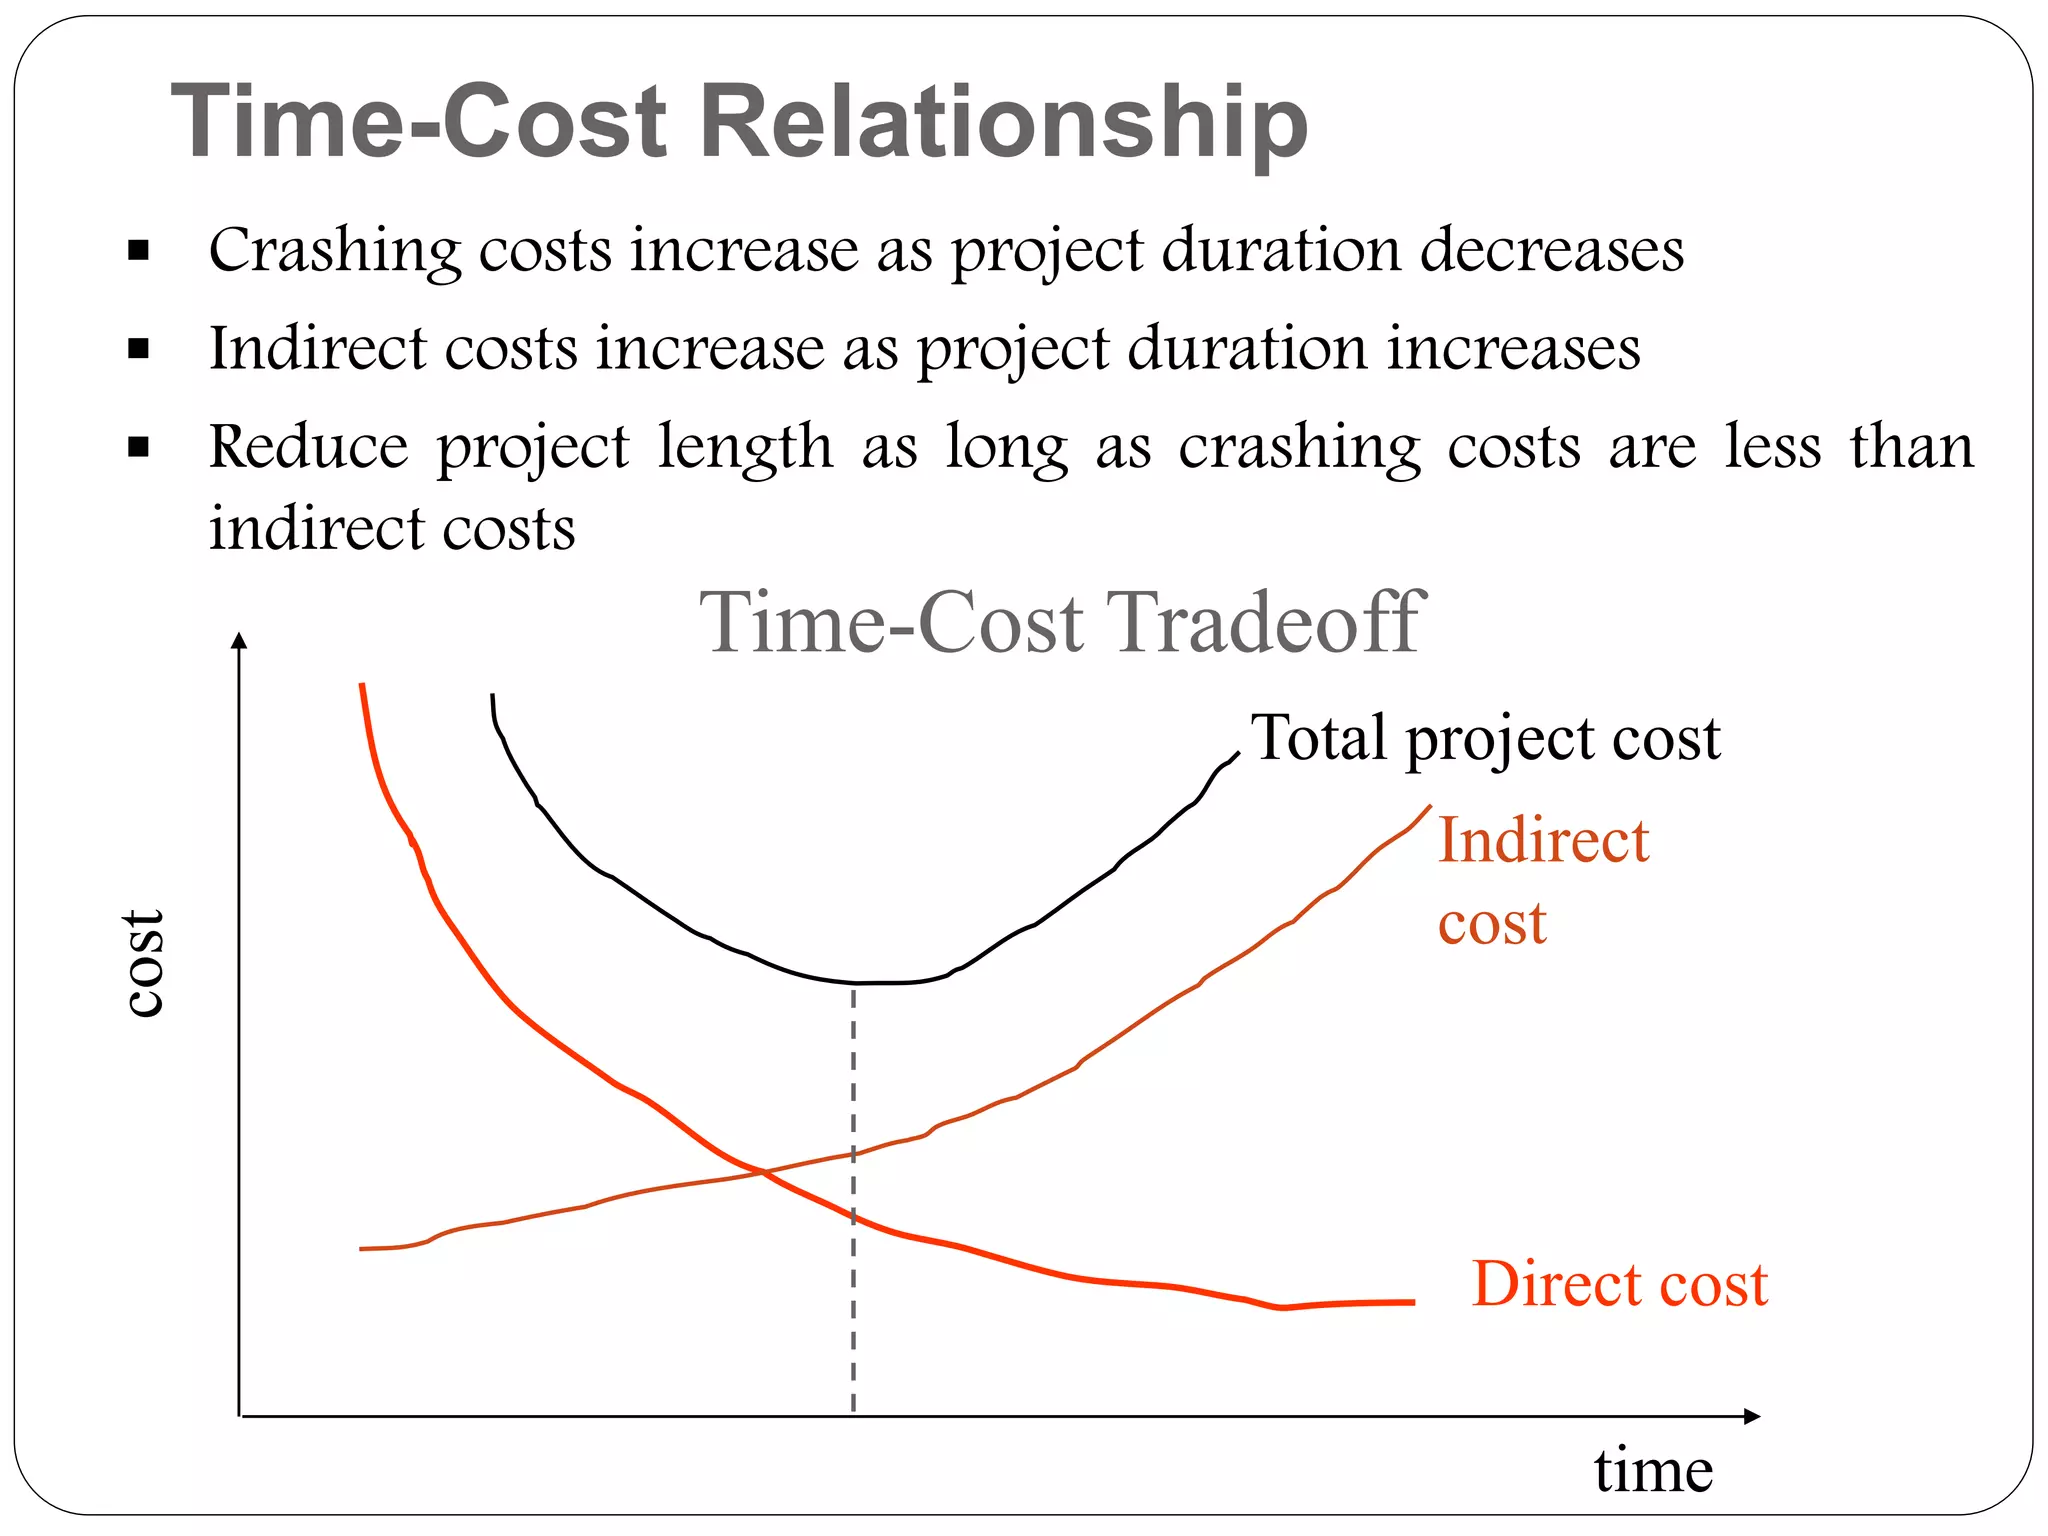
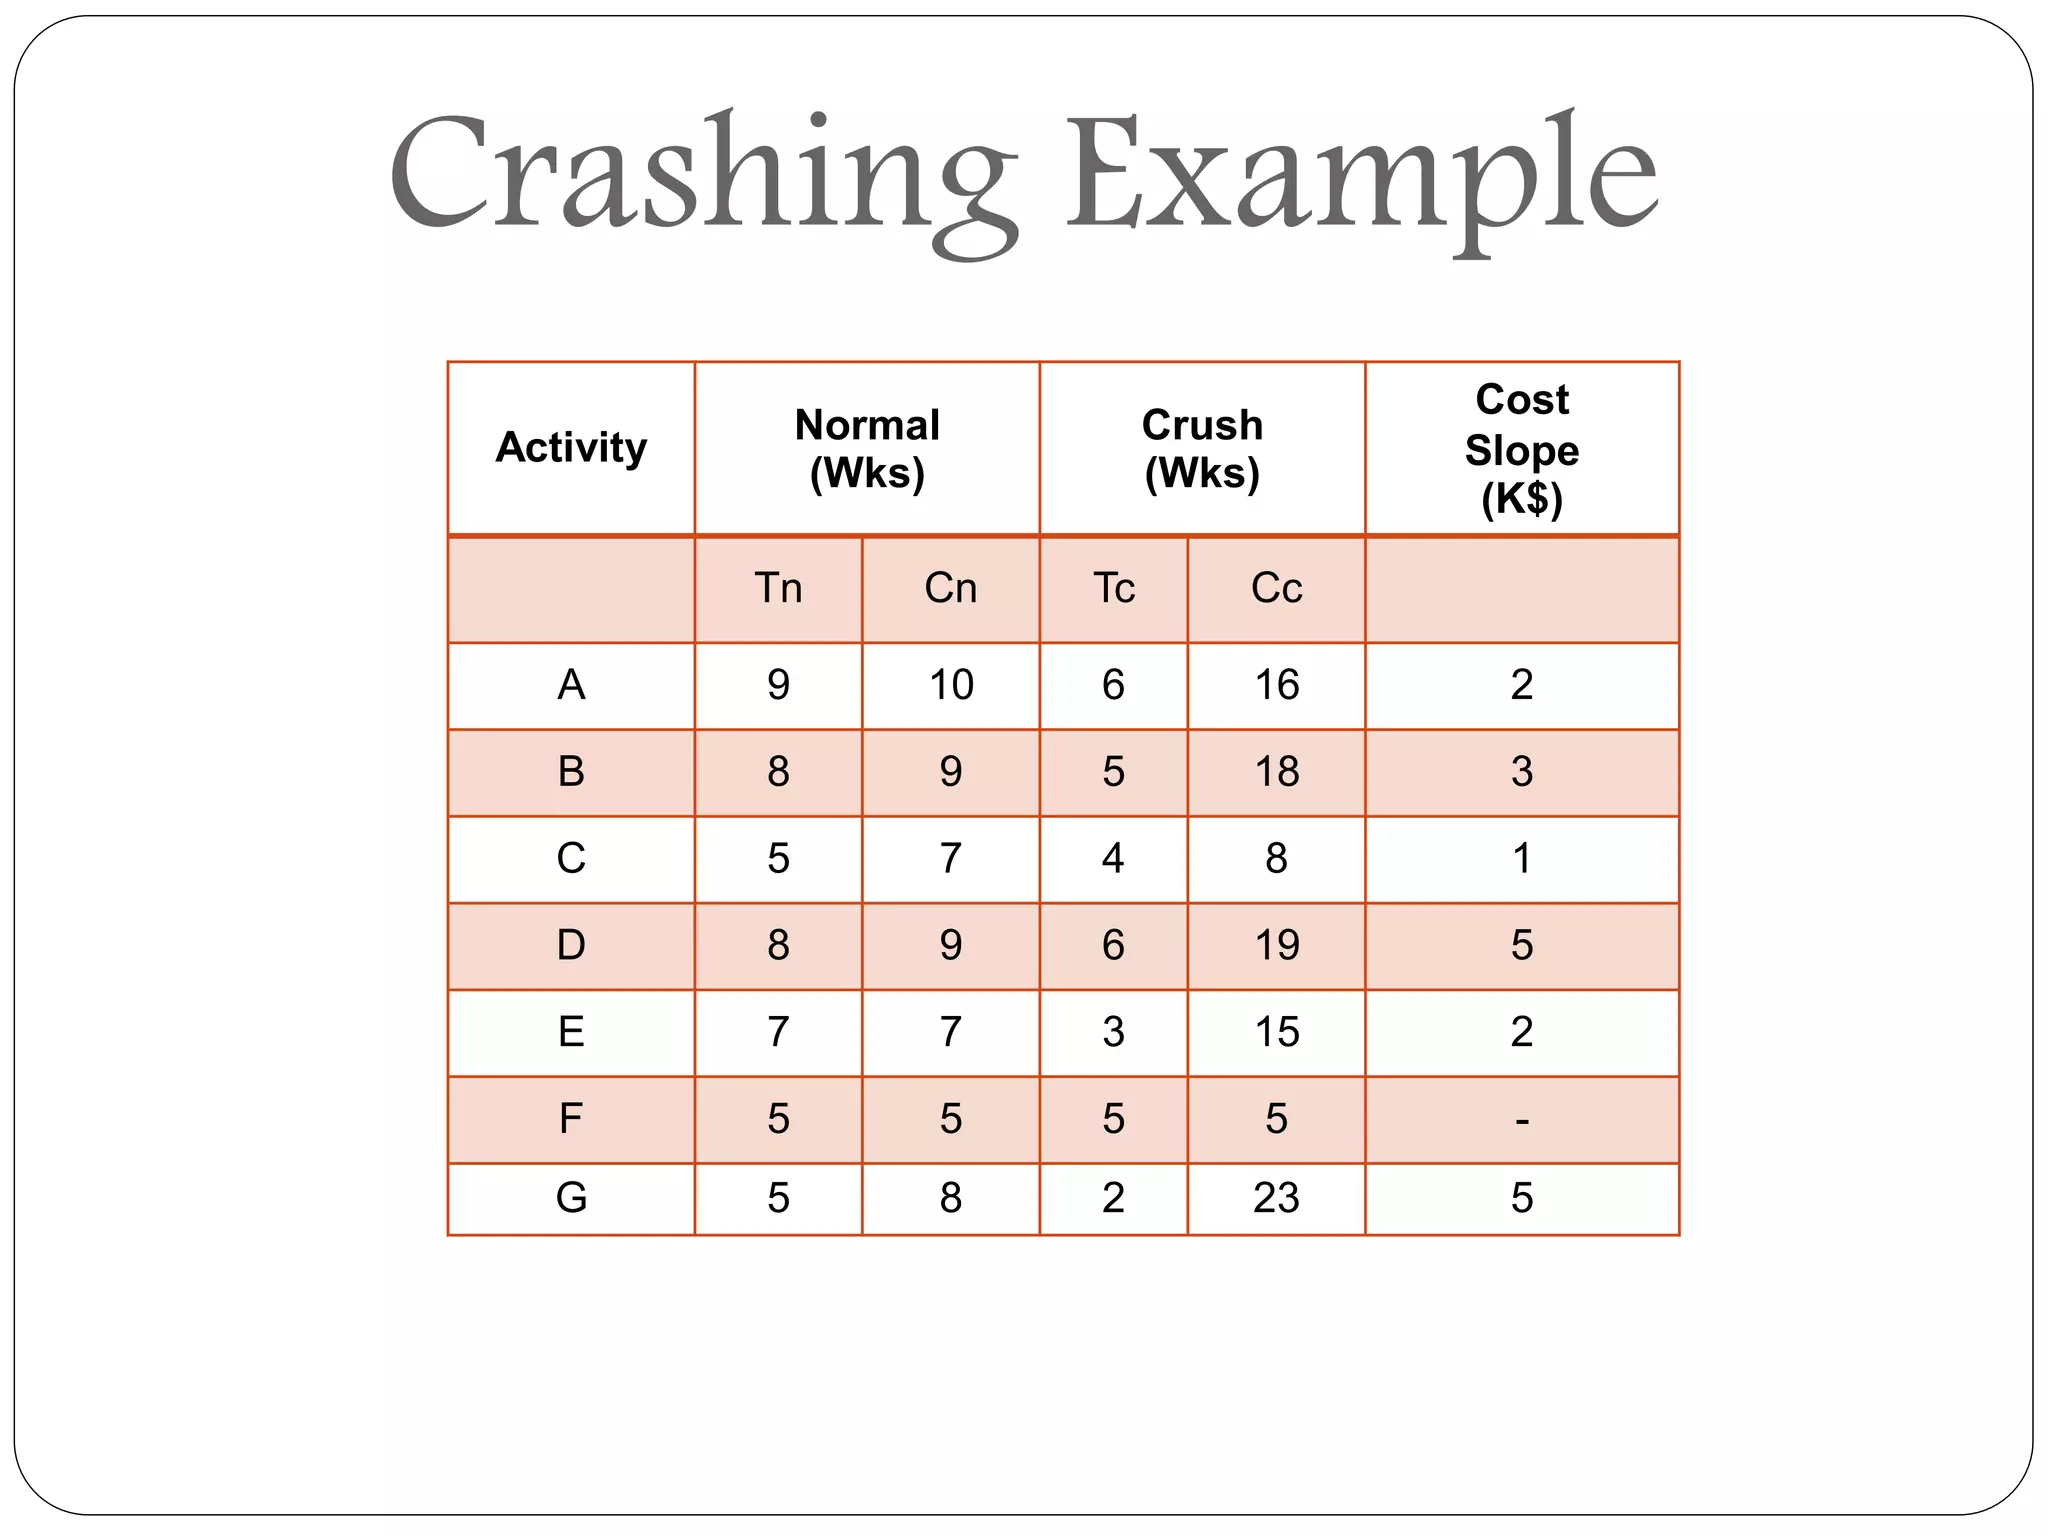


The document discusses network scheduling techniques, particularly PERT (Program Evaluation and Review Technique) and CPM (Critical Path Method), which are crucial for planning, monitoring, and controlling projects. PERT focuses on probabilistic task durations, while CPM uses deterministic task times and emphasizes critical activities that impact project duration. It also explores project crashing to reduce duration and resource management challenges in scheduling.


