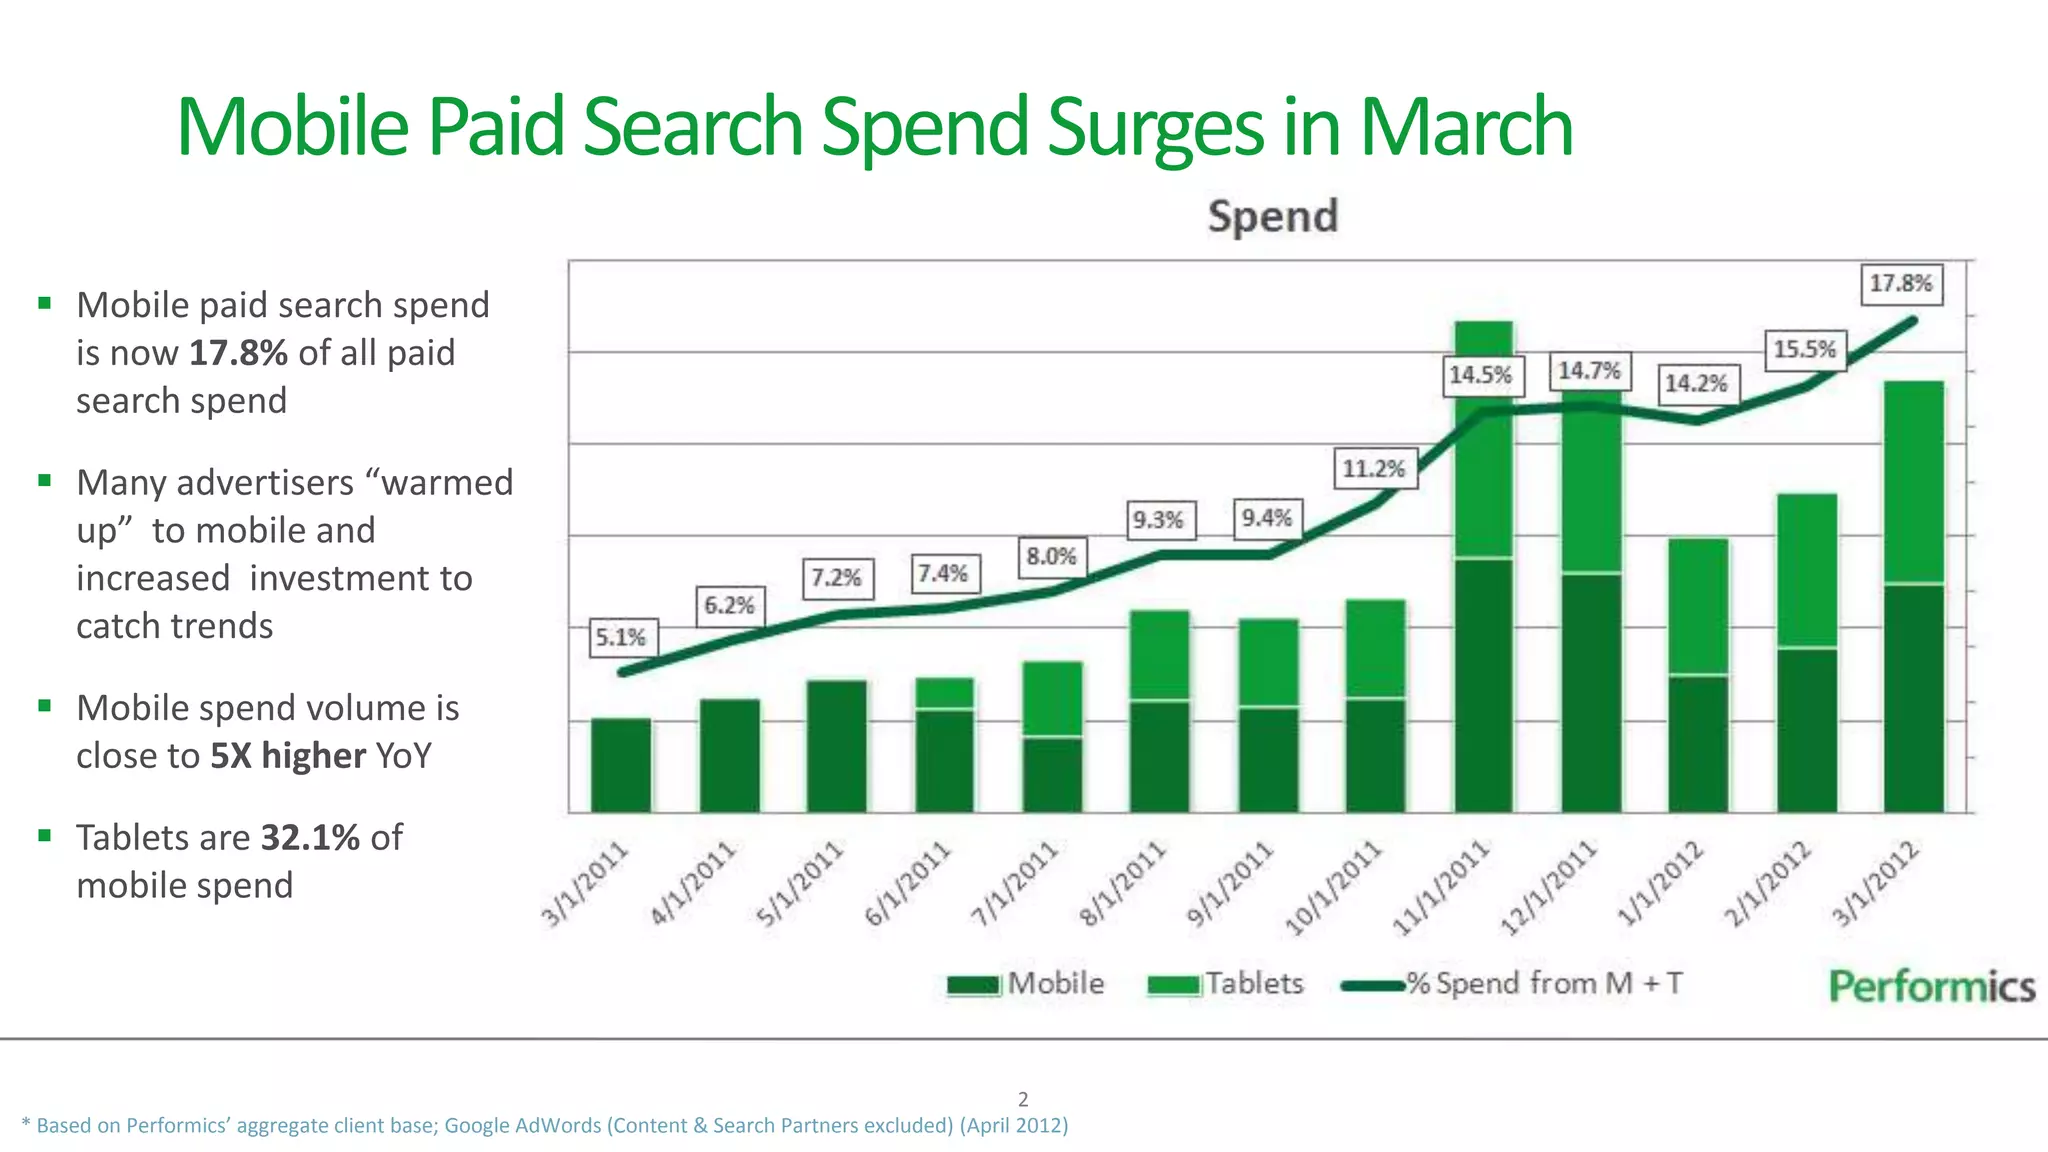
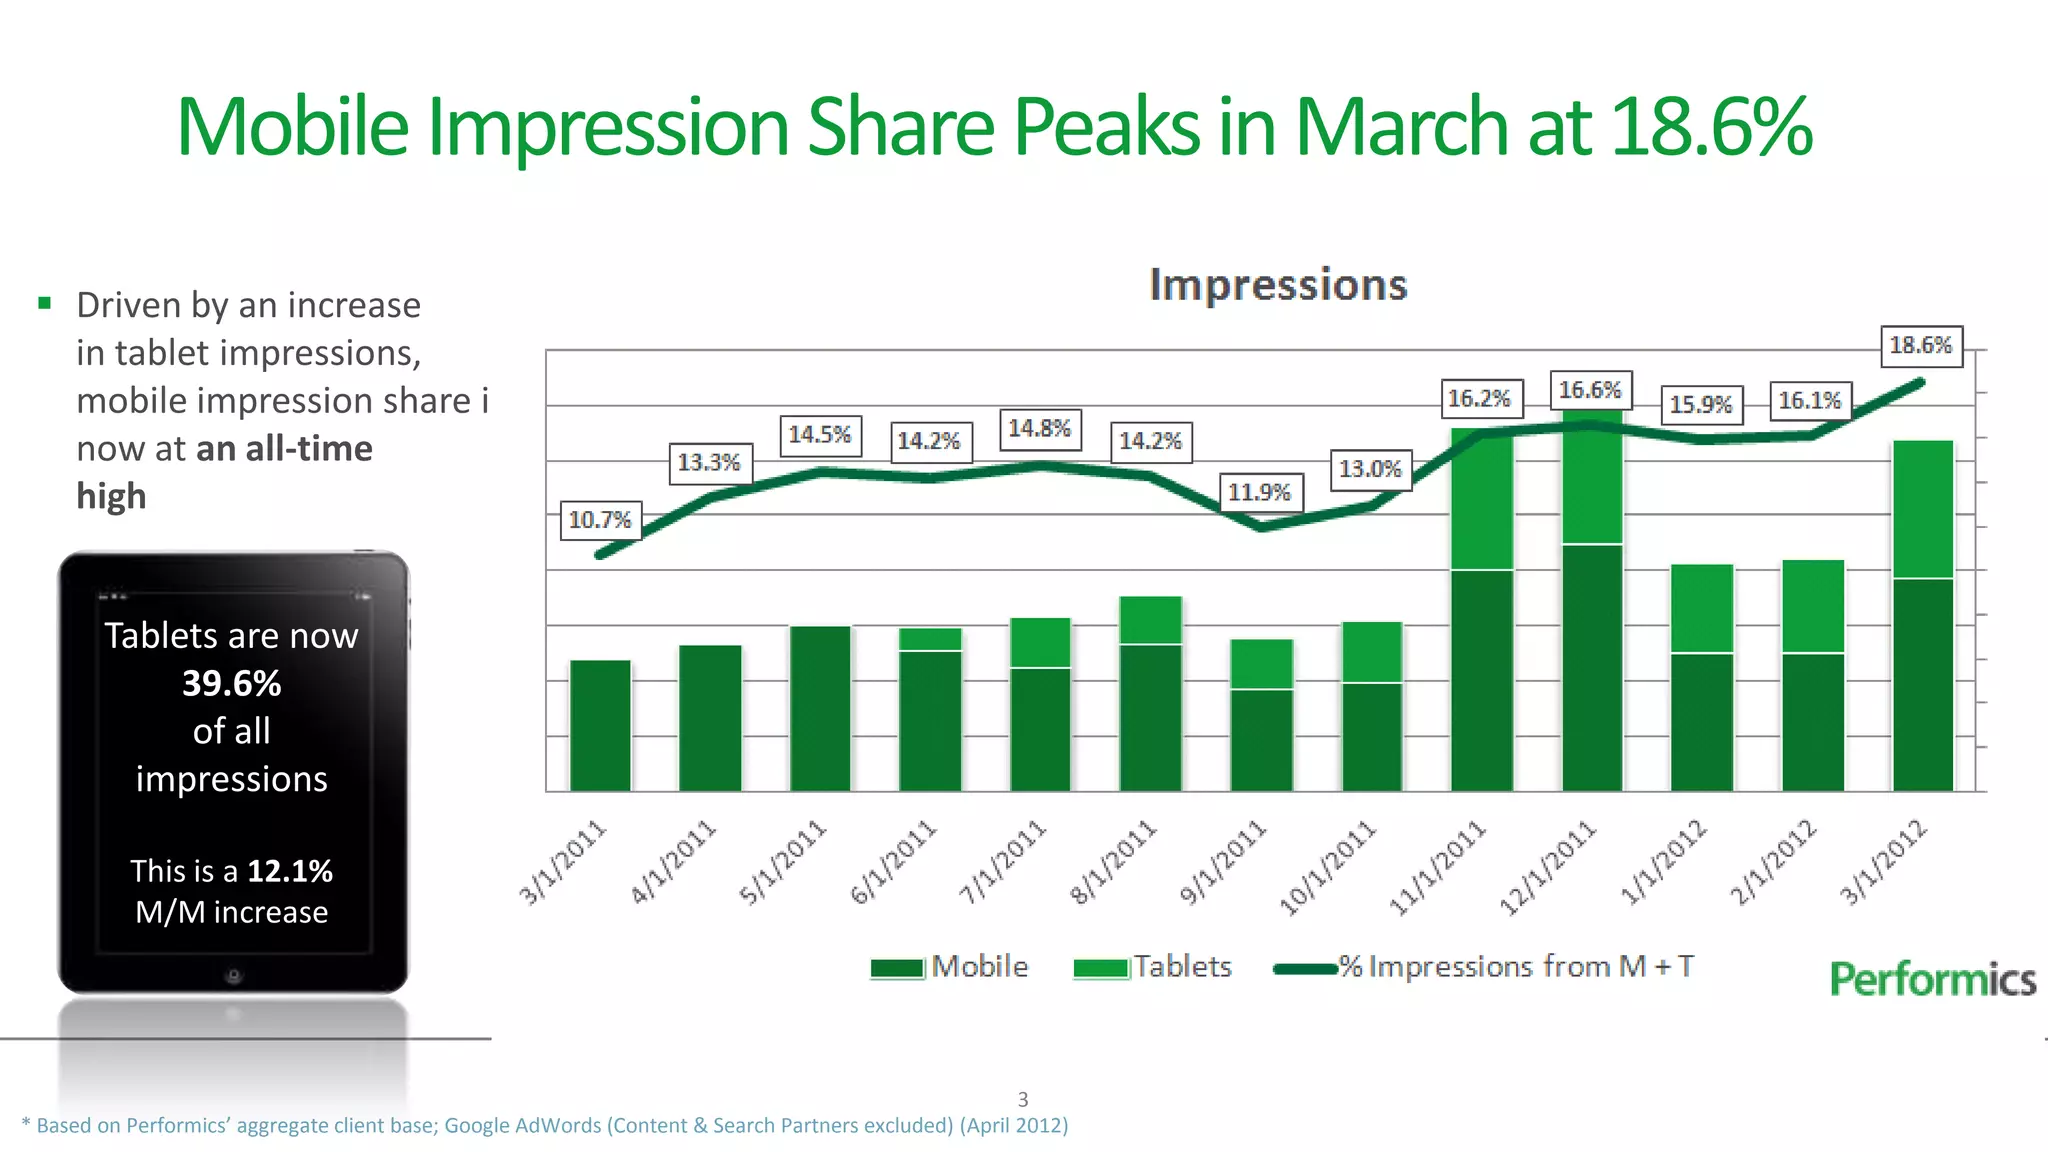
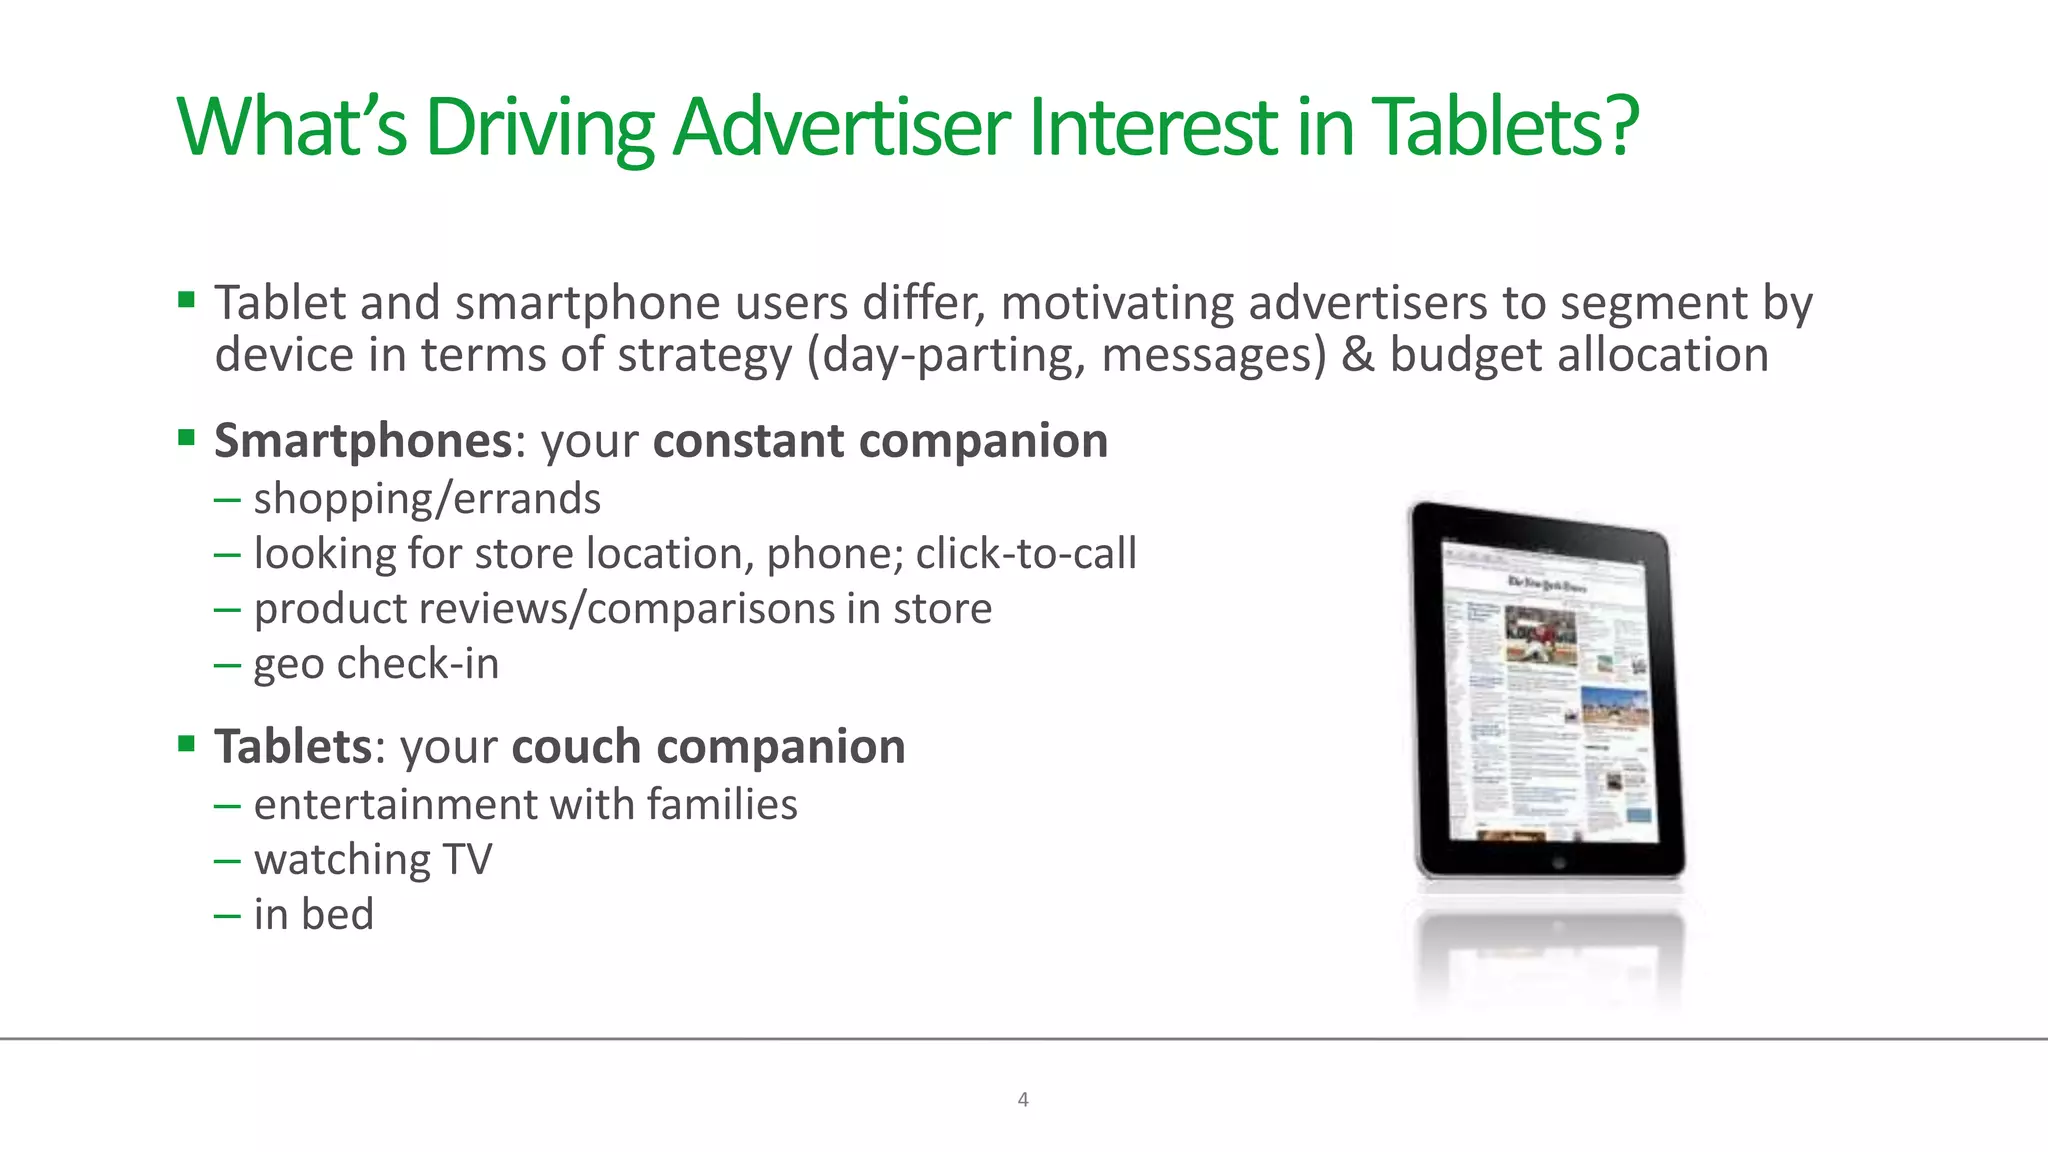
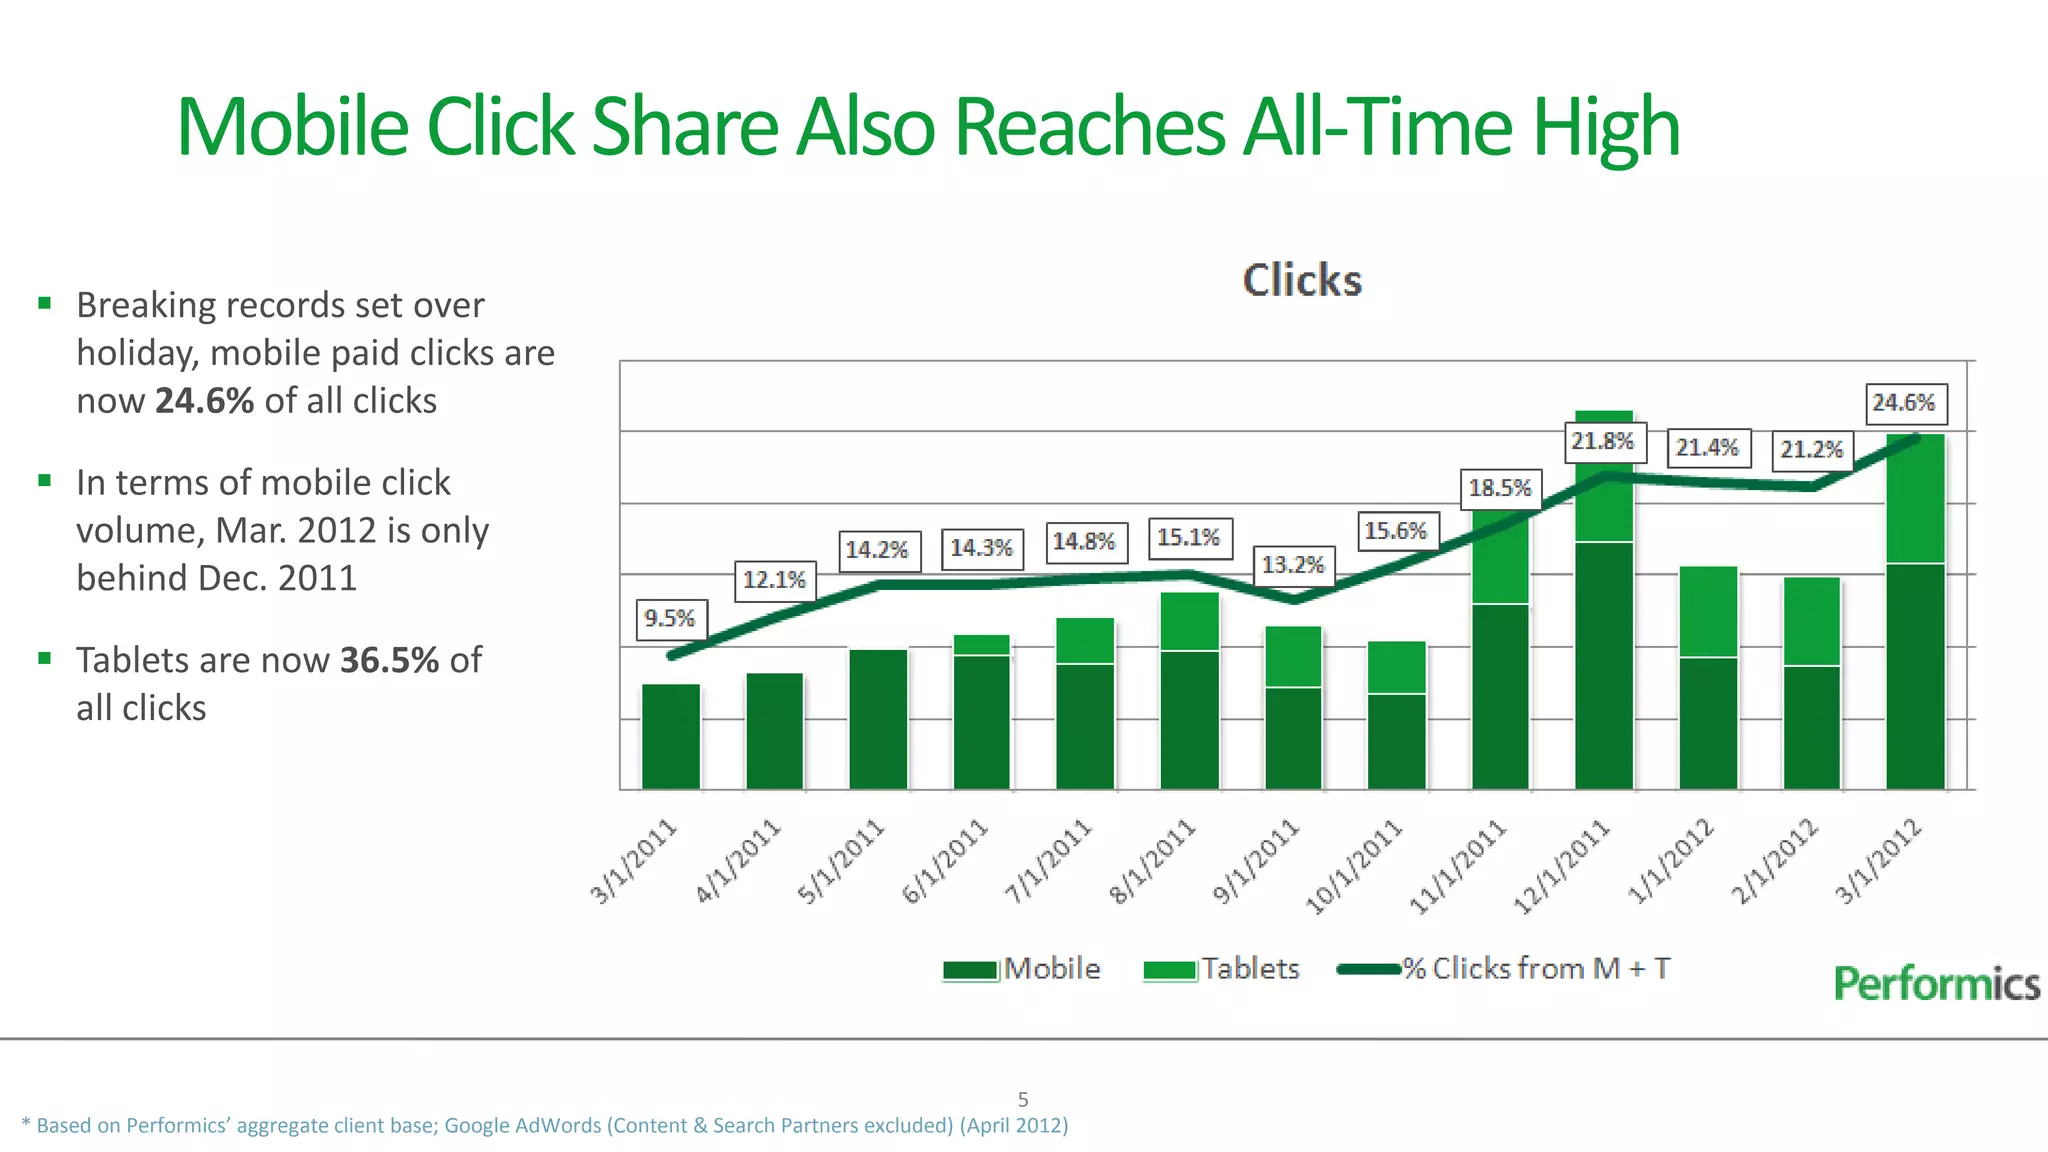
Performics Mobile Paid Search Benchmarks & Trends
(Q1 2012)


                          1
Mobile Paid Search Spend Surges in March
  Mobile paid search spend
   is now 17.8% of all paid
   search spend

  Many advertisers “warmed
   up” to mobile and
   increased investment to
   catch trends

  Mobile spend volume is
   close to 5X higher YoY

  Tablets are 32.1% of
   mobile spend


                                                                                                         2
* Based on Performics’ aggregate client base; Google AdWords (Content & Search Partners excluded) (April 2012)
Mobile Impression Share Peaks in March at 18.6%
  Driven by an increase
   in tablet impressions,
   mobile impression share is
   now at an all-time
   high


        Tablets are now
             39.6%
              of all
          impressions

           This is a 12.1%
           M/M increase


                                                                                                         3
* Based on Performics’ aggregate client base; Google AdWords (Content & Search Partners excluded) (April 2012)
What’s Driving Advertiser Interest in Tablets?
 Tablet and smartphone users differ, motivating advertisers to segment by
  device in terms of strategy (day-parting, messages) & budget allocation
 Smartphones: your constant companion
 – shopping/errands
 – looking for store location, phone; click-to-call
 – product reviews/comparisons in store
 – geo check-in
 Tablets: your couch companion
 – entertainment with families
 – watching TV
 – in bed


                                            4
Mobile Click Share Also Reaches All-Time High
  Breaking records set over
   holiday, mobile paid clicks are
   now 24.6% of all clicks

  In terms of mobile click
   volume, Mar. 2012 is only
   behind Dec. 2011

  Tablets are now 36.5% of
   all clicks


                                                                                                         5
* Based on Performics’ aggregate client base; Google AdWords (Content & Search Partners excluded) (April 2012)
Where is This Growth Coming From?
Is Mobile Cannibalizing Desktop?
 Mobile is exploding, but not at the expense of desktop
 We see desktop search volume growing, just not
  nearly at the pace of mobile
 This is a function of the always-connected searcher:
 – Searchers aren’t abandoning their desktops in favor of mobile
 – They search on their desktops at work, smartphones on the way home, and
   tablets at night in front of the TV
 But, given the similarities in experience and that most tablet users are
  tethered to Wi-Fi, tablets and laptops are sharing some territory

                                     6
Over Time, Device Will Be Just a Signal
 Searchers are de-tethering from the
  office/home/desktop
 People are searching in entirely
  new places, in the middle of new
  exchanges and processes and
  with entirely new needs
 Device will become merely a
  signal. What's increasingly
  important is understanding the
  context, the specific audience and
  its intent.

                                        7
With Low CPCs, Mobile Is Still a Buying Opportunity
  Tablets CPCs are 85% of
   desktop CPCs

  Smartphone CPCs are 55%
   of desktop CPCs


                                                                                                         8
* Based on Performics’ aggregate client base; Google AdWords (Content & Search Partners excluded) (April 2012)
Is Mobile’s Growth (with its Low CPCs) Hurting
Google’s Bottom Line?
 Mobile search continues to take a larger piece of
  the search pie (especially due to localization)
 Mobile CPCs remain lower than desktop
 Therefore, overall (desktop + mobile) Google
  CPCs dropped in Q4 and Q1, causing concern
  for Google investors
 But the better indicator of Google’s health is click volume. Even if CPCs
  drop, click growth results in higher revenue for Google.
 Plus, lower CPCs give advertisers more opportunity for efficiency

                                     9
Mobile CTRs Continue to Outpace Desktop
  Mobile CTRs increased
   9.8% M/M and 25.2%
   Y/Y

  March’s mobile CTR
   increase was driven by
   mobile devices (i.e.
   smartphones) rather
   than tablets
     – Mobile device CTRs
       increased 18.2% M/M
     – Tablets decreased 2.1%


                                                                                                        10
* Based on Performics’ aggregate client base; Google AdWords (Content & Search Partners excluded) (April 2012)
What’s Driving Mobile CTRs Above Desktop?
        In March, mobile CTRs were driven by smartphones
        Google is increasingly providing advertisers with more opportunities for
         enhanced listings on smartphones:
Sitelinks         Click to Call   Product Ads    Location Extensions   Offer Ads   Click to Download


        On the smaller smartphone SERP, enhancements occupy more space (not to
         mention, users don’t scroll like on desktop and tablets). Thus, CTRs rise.

                                                11

Performics Mobile Search Benchmarks & Trends (Q1 2012)

  • 1.
    Performics Mobile PaidSearch Benchmarks & Trends (Q1 2012) 1
  • 2.
    Mobile Paid SearchSpend Surges in March  Mobile paid search spend is now 17.8% of all paid search spend  Many advertisers “warmed up” to mobile and increased investment to catch trends  Mobile spend volume is close to 5X higher YoY  Tablets are 32.1% of mobile spend 2 * Based on Performics’ aggregate client base; Google AdWords (Content & Search Partners excluded) (April 2012)
  • 3.
    Mobile Impression SharePeaks in March at 18.6%  Driven by an increase in tablet impressions, mobile impression share is now at an all-time high Tablets are now 39.6% of all impressions This is a 12.1% M/M increase 3 * Based on Performics’ aggregate client base; Google AdWords (Content & Search Partners excluded) (April 2012)
  • 4.
    What’s Driving AdvertiserInterest in Tablets?  Tablet and smartphone users differ, motivating advertisers to segment by device in terms of strategy (day-parting, messages) & budget allocation  Smartphones: your constant companion – shopping/errands – looking for store location, phone; click-to-call – product reviews/comparisons in store – geo check-in  Tablets: your couch companion – entertainment with families – watching TV – in bed 4
  • 5.
    Mobile Click ShareAlso Reaches All-Time High  Breaking records set over holiday, mobile paid clicks are now 24.6% of all clicks  In terms of mobile click volume, Mar. 2012 is only behind Dec. 2011  Tablets are now 36.5% of all clicks 5 * Based on Performics’ aggregate client base; Google AdWords (Content & Search Partners excluded) (April 2012)
  • 6.
    Where is ThisGrowth Coming From? Is Mobile Cannibalizing Desktop?  Mobile is exploding, but not at the expense of desktop  We see desktop search volume growing, just not nearly at the pace of mobile  This is a function of the always-connected searcher: – Searchers aren’t abandoning their desktops in favor of mobile – They search on their desktops at work, smartphones on the way home, and tablets at night in front of the TV  But, given the similarities in experience and that most tablet users are tethered to Wi-Fi, tablets and laptops are sharing some territory 6
  • 7.
    Over Time, DeviceWill Be Just a Signal  Searchers are de-tethering from the office/home/desktop  People are searching in entirely new places, in the middle of new exchanges and processes and with entirely new needs  Device will become merely a signal. What's increasingly important is understanding the context, the specific audience and its intent. 7
  • 8.
    With Low CPCs,Mobile Is Still a Buying Opportunity  Tablets CPCs are 85% of desktop CPCs  Smartphone CPCs are 55% of desktop CPCs 8 * Based on Performics’ aggregate client base; Google AdWords (Content & Search Partners excluded) (April 2012)
  • 9.
    Is Mobile’s Growth(with its Low CPCs) Hurting Google’s Bottom Line?  Mobile search continues to take a larger piece of the search pie (especially due to localization)  Mobile CPCs remain lower than desktop  Therefore, overall (desktop + mobile) Google CPCs dropped in Q4 and Q1, causing concern for Google investors  But the better indicator of Google’s health is click volume. Even if CPCs drop, click growth results in higher revenue for Google.  Plus, lower CPCs give advertisers more opportunity for efficiency 9
  • 10.
    Mobile CTRs Continueto Outpace Desktop  Mobile CTRs increased 9.8% M/M and 25.2% Y/Y  March’s mobile CTR increase was driven by mobile devices (i.e. smartphones) rather than tablets – Mobile device CTRs increased 18.2% M/M – Tablets decreased 2.1% 10 * Based on Performics’ aggregate client base; Google AdWords (Content & Search Partners excluded) (April 2012)
  • 11.
    What’s Driving MobileCTRs Above Desktop?  In March, mobile CTRs were driven by smartphones  Google is increasingly providing advertisers with more opportunities for enhanced listings on smartphones: Sitelinks Click to Call Product Ads Location Extensions Offer Ads Click to Download  On the smaller smartphone SERP, enhancements occupy more space (not to mention, users don’t scroll like on desktop and tablets). Thus, CTRs rise. 11